distributions were predicted by the four packages, while for Cd, Cr, Ni, and Pb, ... The elements contained in fossil and biomass fuels can be grouped into three ... combustible organic matrix of the fuel; 2) the ash forming elements, Al, Ca, Fe, K, ..... water-soluble and is therefore more effectively captured by e.g. wet scrubber.
PREDICTION OF TRACE ELEMENT PARTITIONING IN UTILITY BOILERS F. J. Frandsen Department of Chemical Engineering, Technical University of Denmark, DK-2800 Lyngby, Denmark T. A. Erickson and V. Kühnel Energy and Environmental Research Center, University of North Dakota, Grand Forks, ND, USA J. J. Helble Chemical Engineering Department, University of Connecticut, Storrs, CT, USA W. P. Linak U. S. Environmental Protection Agency, National Risk Management Research Laboratory, Research Triangular Park, NC, USA
Abstract The phase partitioning and speciation of the trace elements As, Cd, Cr, Hg, Ni, Pb, and Se, in a model system based on a demonstration-scale PFBC, firing a Pittsburgh #8 bituminous coal, is mapped as a function of temperature, by use of Global Equilibrium Analysis (GEA). Ideal gas and pure condensed phases are assumed and the presence of a sorbent material, CaCO3, for sulfur capture, is taken into account. Results from four thermodynamic packages (MINGTSYS, NASA-CET89, FACT, and SOLGASMIX) are compared over the temperature range [700 - 2000 K], at 1 atm. For the trace elements, As, Hg, and Se almost identical equilibrium distributions were predicted by the four packages, while for Cd, Cr, Ni, and Pb, differences in the output from the four packages were observed, primarily due to lack of chemical species, and/or scattering in the thermodynamic input-data utilized, in the thermodynamic packages. This paper contains an outline of the trace elements chemistry mapping based on the output from the four thermodynamic packages. A comparison of the results and a detailed discussion of the application and limitations of GEA for trace element chemistry mapping in combustion systems is provided. 1. Introduction
The elements contained in fossil and biomass fuels can be grouped into three concentration levels: 1) the major elements, C, O, H, S, and N, building up the combustible organic matrix of the fuel; 2) the ash forming elements, Al, Ca, Fe, K, Mg, Na, and Si, typically present in the concentration range from about 1000 ppmw to a few %(w/w) on a dry fuel basis; and 3) the trace elements (e.g., As, B, Cd, Cr, Hg, Ni, Pb, and Se) present typically in concentrations below 1000 ppmw [1]. Several of the trace elements are vaporized during devolatilization and pyrolysis and recondensed on the surface of fly ash particles during subsequent cooling of the flue gases [2 - 3]. Full-scale measurements have revealed significant amounts of some trace elements (e.g., B, Hg, and Se) in the flue gas leaving the stack [4 8]. Direct gaseous emission of these trace elements is undesired because of suspected toxicological effects on the environment and potential genetic or biological changes in living creatures [1, 3, 5, 9]. A mechanistic model for trace element transformations in thermal fuel conversion systems will require detailed information on the release of trace elements (i.e. heatup, devolatilization and pyrolysis of the fuel), residual ash and aerosol formation (i.e., char burn-out and fragmentation, coalescence and fragmentation of mineral grains, gas phase supersaturation, cluster formation, nucleation and coagulation), gas phase reactions of trace element species and subsequent recondensation of trace elements (i.e., gas- and particle-particle interactions, and mass transfer from the bulk gas to fly ash particles). Only very few kinetic data for trace element transformations in hot flue gases are available. Thus, as a first approach, Global Equilibrium Analysis (GEA) has been used for several years in order to understand the various subprocesses in thermal fuel conversion systems. Frandsen et al. [10] have provided an introduction to the application of GEA on combustion systems, by utilizing the Gibbs energy minimization code MINGTSYS and reporting equilibrium distributions for 18 trace elements of concern with respect to coal utilization [1]. Reducing and oxidizing conditions were considered, and the results were compared qualitatively to experimental results published in the literature [8, 10 -11]. Numerous thermodynamic packages have been developed for the purpose of minimizing the total Gibbs energy of mass balance constrained systems containing ash forming and trace element species [12 - 13]. Differences in the output from these packages may be due to: 1) lack of important chemical species, 2) use of different or inconsistent thermochemical data or 3) use of different numerical solution techniques and/or convergence criteria. Thus, a GEA test was performed in order to compare the output from different thermodynamic packages. We reported preliminary results from this GEA round robin at the 3rd Int. Hot Gas Clean-Up Symposium, Karlsruhe, Germany, 1996 [13]. This paper contain several additional details and a further evaluation of the results. The complete GEA round robin will appear in J. Aerosol Sci. Tech., in near future.
2. Description of the Modeling Approach The total Gibbs energy, Gt, of a chemical system is given by: N G° Gt = ∑ ni ⋅ fi + ln(ai ) R ⋅ T i=1 R ⋅ T
(1)
where G symbolizes a Gibbs energy, superscript t denotes total, R is the universal gas constant, T is the absolute temperature, N is the total number of chemical species, ni is the number of moles of species i, superscript (°) denotes standard state, subscript fi denotes formation of species i, and ai is the activity of species i. The function Gt is combined with the mass balance constraints of the system and minimized, using the method of undetermined Lagrangian multipliers [14 - 15].
Equilibrium reactor
Gaseous phase: CO2, H2O, O2,N2 SO2, CO, H2, H2S, Me, MeO, MeCln, etc
Sorbent O 2, N 2 C, H, O, N, S, Me, etc.
T P Condensed phase: MeO, MeCO3, MeSO4, MeS, etc.
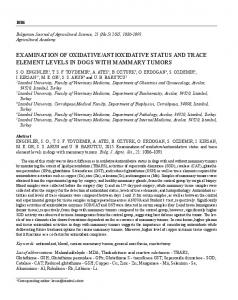
Figure 1: The model system used in Global Equilibrium Analysis. A GEA model, based on an actual operating combustion system, has been set up. The temperature, pressure, total elemental composition, and a list of chemical species to be considered, are specified, see Figure 1. The gas is assumed ideal, and all condensed phases are considered pure. Among the ash forming elements, only calcium, Ca, is taken into account as an As-, Cr-, and S-capturing sorbent in the form of CaCO3. The trace elements, As, Cd, Cr, Hg, Ni, Pb, and Se, are considered one at a time. The temperature is varied between 700 K and 2000 K and the pressure is set equal to 1 atm. and 20 atm. The elemental composition of the system considered is presented in Table 1.
Table 1: Reactor feedstock mass flows and compositions used in this study. Feedstock mass flows (kg/hr): Coal : Sorbent : Moisture = 15.2 : 8.7 : 5.2 %(w/w) (db): Coal: Sorbent: Carbon (C) 83.3 12.0 Oxygen (O) 9.0 48.0 Hydrogen (H) 5.0 Sulfur (S) 1.2 Nitrogen (N) 1.5 Calcium (Ca) 40.0 ppmw: Chlorine (Cl) 1200.0 320.0 Arsenic (As) 45.0 1.9 Cadmium (Cd) 0.11 0.14 Chromium (Cr) 16.0 2.8 Mercury (Hg) 0.15 0.0012 Nickel (Ni) 13.0 12.0 Lead (Pb) 6.3 6.9 Selenium (Se) 1.8 0.79
Four different thermodynamic packages, MINGTSYS, NASA-CET89, FACT, and SOLGASMIX, have been used to minimize the total Gibbs energy of a system with the elemental composition presented in Table 1. Preliminary results of the GEA round robin, i.e. comparison of output from the four packages were reported by [13]. A summary, with special focus on the results at 1 atm., is provided below. 3. Summary of GEA Round Robin Test Results A list of the major combustion products taken into account when minimizing the total Gibbs energy of the system considered in this study (see Table 1) is provided in Table 2. For the trace elements, As, Hg, and Se, all four packages predicted equilibrium distributions equal to those reported by [10], while for Cd, Cr, Ni, and Pb differences were observed in the calculated equilibrium distributions from the four packages [13]. Table 2: Major combustion and sorbent products included in this work: CO(g), CO2(g), COS(g), Cl(g), ClO(g), Cl2(g), Cl2O(g), HCN(g), HCl(g), H2O(g), NH(g), NH2(g), NH3(g), NO(g), NOCl(g), NO2(g), NO2Cl(g), N2(g), N2O(g), O(g), OH(g), O2(g), SO(g), SOCl2(g), SO2(g), SO2Cl2(g), SO3(g) CaO(cr,l), CaSO4(cr)
3.1. Arsenic (As), Mercury (Hg) and Selenium (Se) Results The chemical species of arsenic, mercury, and selenium taken into account in this study are presented in Table 3. Table 3: Arsenic (As), mercury (Hg), and selenium (Se) species considered in this study: Arsenic: As(g), AsCl3(g), AsO(g), As2(g), As3(g), As4(g), As4O6(g), As2O3(cr,l), As2O4(cr), As2O5(cr,l), Ca3(AsO4)2(cr). Mercury: Hg(g), HgCl(g), HgCl2(g), HgO(g), HgCl2(cr,l), Hg2Cl2(cr), HgO(cr), HgSO4(cr). Selenium: Se(g), SeCl2(g), SeO(g), SeO2(g), Se2(g), Se2Cl2(g), Se3(g), Se5(g), Se6(g), Se7(g), Se8(g), SeCl4(cr), SeO2(cr).
Arsenic forms the stable crystalline calcium arsenate, Ca3(AsO4)2 (cr), and gaseous arsenic(II) oxide, AsO(g), below respectively above 1400 K. No significant amount of AsCl3(g) is formed. Mercury forms the stable gaseous mercury dichloride, HgCl2(g), at temperatures up to 800 K. Above 850 K, Hg(g) and minor amounts of HgO(g) are the stable forms of mercury. Increasing the temperature above 900 K, HgO(g) is gradually decomposed, forming Hg(g) and O2(g). No condensed forms of mercury are formed. In analogy with sulfur, selenium forms the stable SeO2(g) in the temperature range [700 - 2000 K]. Above 1300 K, the equilibrium form of Se shifts toward SeO(g) and to a minor extent to Se(g). 3.2. Cadmium (Cd) Results The cadmium species taken into account in this study are presented in Table 4.
Table 4: Cadmium (Cd) species considered in this study: Cd(g), CdCl2(g), CdO(g), CdCl2(cr,l), CdO(cr), Cd(OH)2(cr), CdSO4(cr)
MINGTSYS has found cadmium to exist as CdCl2 at 1 atm. and temperatures up to 1100 K: CdCl2(cr) below, respectively CdCl2(g), above 750 K. At temperatures above 1200 K, Cd(g) and CdO(g) are the stable species, Cd(g) accounting for more than 95 %(mol/mol) of the Cd present at all temperatures. Gaseous cadmium oxide, CdO(g), is gradually decomposing as the temperature is raised above 1280 K, forming Cd(g) and O2(g), see Figure 2.
MINGTSYS: Cadmium, 1 atm.
Percent Cd-Species
100 80 60 40 20 0 700
900
1100
1300
1500
1700
1900
2100
Cd(g) CdCl2(g)
Temperature (K)
CdO(g)
FACT: Cadmium, 1 atm.
Percent Cd-Species
100 80 60 40
CdO(g)
20
Cd(g) CdO(cr)
0 700
900
1100
1300
1500
1700
1900
2100
CdCl2(cr)
Temperature (K)
Figure 2: Equilibrium distribution of Cd as predicted by MINGTSYS.
NASA-CET89 has found CdCl2(cr) to be stable below, and Cd(g) to be the major stable form of cadmium above 750 K. Small amounts (< 2 %(mol/mol)) of the Cd were present as CdO(g) in the temperature range 750 - 1000 K. FACT has found CdCl2(cr) to be stable up to 750 K, above which temperature CdO(cr) is stable up to 1000 K, see Figure 3. Formation of Cd(g) and CdO(g) begins at 850 K, Cd(g) being the major species above 1000 K, where CdO(g) gradually decomposes forming Cd(g) and O2(g). SOLGASMIX has found CdO(cr) to be the stable form of cadmium up to 1400 K. Formation of Cd(g) begins at 1200 K. Above 1600 K, Cd(g) is the major stable form of Cd present. In addition, minor amounts of CdO(g) and CdCl2(g) were formed in the temperature ranges [1300 - 2000 K] and [700 - 1500 K], respectively, see Figure 4. Figure 3: Equilibrium distribution of Cd, as predicted by FACT. SOLGASMIX: Cadmium, 1 atm.
Percent Cd-Species
100 80 60 40 20
Cd(g) CdO(g)
0 700
900
1100
1300
1500
1700
Temperature (K)
1900
2100
CdCl2(g) CdO(cr)
Figure 4: Equilibrium distribution of Cd, as predicted by SOLGASMIX.
3.3. Chromium (Cr) Results The chromium species taken into account in this study are presented in Table 5. Table 5: Chromium (Cr) species considered in this study: Cr(g), CrCl2(g), CrCl2O2(g), CrCl3(g), CrCl4(g), CrO(g), Cr(OH)(g), CrO2(g), Cr(OH)2(g), CrOOH(g), CrO3(g), Cr(OH)3(g), CrO(OH)2(g), Cr(OH)4(g),
CrO2OH(g), CrO(OH)3(g), Cr(OH)5(g), CrO2(OH)2(g), CrO(OH)4(g), Cr(OH)6(g), CrCl2(cr,l), CrCl3(cr), Cr2O3(cr), Cr2(SO4)3(cr). At 1 atm., MINGTSYS and NASA-CET89 have found Cr2O3(cr) to exist at temperatures up to approx. 1200 K, where it is decomposing, forming CrO2(OH)2(g). The latter has a maximum in occurrence around 1300 K. Above 1300 K, chromium showed a very complex equilibrium chemistry, forming the gaseous components, CrO(OH), CrO2(OH), CrO(OH)2, CrO2, and CrO3 [13]. FACT has showed a completely different distribution of chromium at 1 atm., primarily due to 1) lack of thermodynamic data for the gaseous chromiumoxides and -hydroxyoxides provided by [16] and 2) implementation of the composed oxide, CaO.Cr2O3(cr) which was shown to be thermodynamically stable between 800 and 1800 K [13]. SOLGASMIX has found CaO.Cr2O3 to be the major Cr-species stable in the temperature range [700 - 2000 K]. In addition, minor amounts of Cr2O3(cr), CrO2(g), and CrO3(g) were formed at temperatures above 1450 K. The thermochemical data for the gaseous chromiumoxides and -hydroxyoxides reported by [16] have not been included in these calculations. 3.3 Nickel (Ni) Results The nickel species taken into account in this study are presented in Table 6. Table 6: Nickel (Ni) species considered in this study: Ni(g), Ni(CO)4(g), NiCl(g), NiCl2(g), NiO(g), NiCl2(cr,l), NiO(cr), NiSO4(cr)
MINGTSYS and FACT have found Ni to form NiO(cr) at 1 atm. and temperatures up to approximately 1500 K, where NiO(g), Ni(g), and NiCl(g) were formed. Formation of NiCl2(g) begins at 1000 K. NiO(g), NiCl(g), NiCl2(g) were stable up to 1800 K, where the last trace amount of NiO(cr) disappeared. Above 1825 K, existing equilibrium among NiO(g), NiCl(g), NiCl2(g), and Ni(g) were shifted towards Ni(g) as the temperature was increased, see Figure 5. Calculations performed with FACT indicated that implementation of Ni(OH)2(g), which was not included in the common list of species taken into account in this study, could affect the stability of NiO(cr). NASA-CET89 has also predicted NiO(cr) to be stable at temperatures up to 1500 K, where formation of NiO(g), Ni(g), and NiCl(g) started, but NASA-CET89 has predicted a much higher concentration of Ni(g) and a correspondingly lower concentrations of NiO(g), NiCl(g), and NiCl2(g) above 1750 K, than MINGTSYS and FACT.
SOLGASMIX has found NiO(cr) to be the major stable form of Ni at all temperatures between 700 K and 2000 K. Trace amounts of various gaseous Nispecies (Ni, NiO, NiCl, and NiCl2) were formed at temperatures above 1600 K. As with FACT, the output from SOLGASMIX has indicated that Ni(OH)2(g) may affect the stability of NiO(cr). MINGTSYS: Nickel, 1 atm.
Percent Ni-Species
100 80
Ni(g)
60
NiCl(g) NiCl2(g)
40
NiO(g) NiO(cr)
20 0 700
900
1100
1300
1500
1700
1900
Temperature (K)
Figure 5: Equilibrium distribution of Ni, as predicted by MINGTSYS. 3.4. Lead (Pb) Results The lead species taken into account in this study are presented in Table 7. Table 7: Lead (Pb) species considered in this study: Pb(g), PbCl(g), PbCl2(g), PbCl4(g), PbO(g), Pb2(g), PbCl2(cr,l), PbO(cr,l), PbSO4(cr,l)
At 1 atm., MINGTSYS and NASA-CET89 have found PbCl4(g) to be the major stable form of Pb, below 1100 K, see Figure 6. Above 1300 K, PbO(g) was the major stable Pb-species, but it was gradually decomposed with increasing temperatures above 1500 K, forming Pb(g). Peaks of PbCl2(g) and PbCl(g) were in the temperature ranges [1000 - 1500 K] and [1100 - 2000 K], respectively. PbCl2(g) has a maximum occurrence of approx. 48 % (mol/mol) at 1200 K, while PbCl(g) has a maximum occurrence of approx. 8 % (mol/mol) at 1250 K. FACT and SOLGASMIX have showed an equilibrium distribution of Pb, similar to that reported above, but the relative amounts of PbCl(g) and PbCl2(g) formed were smaller than predicted by MINGTSYS and NASA-CET89. The output from SOLGASMIX has indicated formation of significant amounts of PbO(cr) in the
intermediate temperature range [1050 - 1800 K]. No condensed phases of Pb were found below 1000 K, see Figure 7. NASA-CET89: Lead, 1 atm.
Percent Pb-Species
100 80
Pb(g) PbCl(g)
60
PbCl2(g) 40
PbCl4(g) PbO(g)
20 0 700
900
1100
1300
1500
1700
1900
Temperature (K)
Figure 6: Equilibrium distribution of Pb, as predicted by NASA-CET89.
SOLGASMIX: Lead, 1 atm.
Percent Pb-Species
100 PbCl4(g)
80
PbO(g) 60
Pb(g) PbCl(g)
40
PbCl2(g) 20
PbO(cr)
0 700
900
1100
1300
1500
1700
1900
Temperature (K)
Figure 7: Equilibrium distribution of Pb, as predicted by SOLGASMIX.
4. Summary and Discussion Global Equilibrium Analysis (GEA), is an easy-to-use and cheap way of qualitatively predicting phase partitioning and speciation of trace elements in thermal fuel conversion systems. Phase partitioning data are important when evaluating the degree of trace element contamination of the fly ash separated in the electrostatic precipitator (or other particulate removal device). Speciation of
trace elements in the different phases (i.e., flue gas, bottom ash, fly ash) is important, since the properties and reactivities of the trace elements depend strongly on their oxidation state. Oxidized forms of trace elements are in general water-soluble and is therefore more effectively captured by e.g. wet scrubber systems and are more likely to deposit locally or regionally. Another important aspect is the mobility of oxidized trace element species during water leaching in fly ash disposal areas [17 - 18]. The equilibrium speciation of As, Cd, Cr, Hg, Ni, Pb, and Se have been predicted at 1 and 20 atm. in the temperature range [700 - 2000 K], by use of the thermodynamic packages MINGTSYS, NASA-CET89, FACT, and SOLGASMIX. For the trace elements, As, Hg, and Se, almost identical equilibrium distributions were predicted by the four packages, while for the elements, Cd, Cr, Ni, and Pb, differences in the output from the four packages were observed. The greatest differences were due to the presence or absence of chemical species, such as Ni(OH)2(g) and the chromium oxyhydroxides, in the respective databases of the four thermodynamic packages. Differences due to the thermodynamic data used for individual chemical species were also significant. For example, the amount of Ni(g) at 2000 K predicted by NASA-CET89 suggests that other thermodynamic data have been used than in the remaining packages. In the case of cadmium, where four different equilibrium distributions were predicted, a systematic comparison of the thermochemical input-data (i.e. CP(T), H(T), S(T), and G(T) data) utilized for major combustion and Cd species, in the four packages, are currently being performed. When GEA is used on a thermal fuel conversion system, one has to be aware of the following [10, 19]: 1.
2. 3. 4.
All relevant chemical species occuring in the thermal fuel conversion system must be taken into account, otherwise the output from the GEA will be misleading. Consistent thermodynamic data must be used. Appropriate mixing models (pure phases, ideal or non-ideal mixing) should be applied in the condensed phase(s). In thermal fuel conversion systems, mixing phenomena and/or boiler design characteristics may introduce local conditions (e.g., temperature and/or composition gradients) not taken into account in the GEA.
Item 1) above, has been illustrated through the comparison of thermodynamic packages performed in this study. All relevant chemical species in an actual operating thermal fuel conversion system must be included when performing a GEA, otherwise the result and conclusion will be misleading. Some trace element gas phase reactions in hot flue gases are expected to be kinetically limited, i.e. they do not reach equilibrium within the time scale actual in a fuel conversion system. Thus, a certain creativity in the selection of chemical species considered in the GEA, based on expected kinetic limitations, could be usefull.
Acknowledgement The authors are grateful to the Combustion and Harmful Emission Control (CHEC) research program at the Department of Chemical Engineering, Technical University of Denmark, for financial support. The CHEC research program is cofunded by ELSAM (The Jutland-Funen Electricity Consortium), ELKRAFT (The Zealand Electricity Consortium), the Danish Technical Research Council, the European Union, and the Danish and Nordic Energy research programs. The authors are also grateful to: the National Center for Excellence on Air Toxic Metals at the Energy and Environmental Research Center, University of North Dakota, the Environmental Research Institute, University of Connecticut, and the Air Pollution Prevention and Control Division, EPA/NRMRL. Grateful acknowledgement is also made to Dr. Bonnie McBride, NASA Lewis Research Center, and to Dr. Michael Michelsen, Department of Chemical Engineering, Technical University of Denmark, for providing the NASA-CET89 respectively the MINGTSYS codes, and other assistance. References: 1. 2.
3. 4.
5. 6.
7.
8.
9.
D. J. Swaine. Trace Elements in Coal. Butterworth and Co. Ltd., London, UK, 1990. R. M. Davidson, D. F. S. Natusch, J. R. Wallace, and C. A. Evans, Jr., “Trace Elements in Fly Ash - Dependence of Concentration on Particle Size”, Environ. Sci. Technol., Vol. 8, No. 13, pp. 1107 - 1113 (1974). D. J. Swaine and F. Goodarzi, Environmental Aspects of Trace Elements in Coal. Kluwer Acad. Publishers, Dordrecht, The Netherlands, 1995. R. Meij, J. Van der Kooij, J. L. G. Van der Sluys, F. G. C. Siepman, and H. A. Van der Sloot, “Characteristics of Emitted Fly Ash and Trace Elements from Utility Boilers Fired with Pulverized Coal”, KEMA Sci. & Technol. Reports, Vol. 2, No. 1, pp. 1 - 8 (1984). Trace Element Emissions from Coal Combustion and Gasification. London, UK: IEA Coal Research, 1992. Rep. No. IEACR/49. B. Sander, “Measurements of Trace Element Mass Balances in Coal-Fired Power Plants Equipped with Different Types of FGD Systems”, presented at the 2nd Int. EPRI Conf. on Managing Hazardous Air Pollutants, Washington D. C. (July 1993). G. F. Weber, S. R. Ness, S. J. Miller, T. D. Brown and C. E. Schmidt, “A Summary of Utility Trace Element Emissions Data from the DOE Air Toxics Study”, presented at the Int. EPRI Conf. on Managing Hazardous and Particulate Air Pollutants, Toronto, Canada (August 1995). L. Aunela-Tapola, F. J. Frandsen, E. Häsänen, “Trace Element Emissions from Estonian Oil Shale Fired Power Plant”, manuscript submitted to Fuel Proces. Techn., Jan. 1997. Trace Elements in Coal. London, UK: IEA Coal Research, 1996. Rep. No. IEAPER/21.
10. F. J. Frandsen, K. Dam-Johansen, and P. Rasmussen, “Trace Elements from Combustion and Gasification of Coal - An Equilibrium Approach”, Prog. Energy Comb. Sci., Vol. 20, 115 - 138 (1994). 11. F. J. Frandsen, Trace Elements from Coal Combustion. Ph.D.-Thesis, Dept. Chem. Eng, Techn. Univ. of Denmark. ISBN-87-90142-03-9. 12. Trace Element Emissions - Literature Review. Petten, The Nteherlands: ECN, 1994. Rep. No. ECN-C-94-096. 13. F. J. Frandsen, T. A. Erickson, V. Kühnel, J. J. Helble and W. P. Linak, “Equilibrium speciation of As, Cd, Cr, Hg, Ni, Pb, and se in oxidative thermal conversion of coal - A comparison of thermodynamic packages”, presented at the 3rd Int. Symp. on High Temperature Gas Cleaning, Karlsruhe, Germany (September, 1996). 14. G. Eriksson, “Thermodynamic Studies of High-Temperature Equilibria XII”, Chimica Scripta, Vol. 8, p. 100 (1975). 15. H. Greiner, “The Gibbs Energy of a Chemical Reaction System Considered as a Function of its Elemental Abundancies”, CALPHAD, Vol. 12, No. 2, pp. 143 -154 (1988). 16. B. B. Ebbinghaus, “Thermodynamic of Gas Phase Chromium Species: The Chromium Oxides, the Chromium Oxyhydroxides, and Volatility Calculations in Waste Incineration Processes”, Combust. Flame, Vol. 93, pp. 119 -137 (1993). 17. S. A. Benson, M. L. Jones, J. H. Pavlish, C. J. Zygarlicke and S. J. Miller, “Trace Element Behavior in Coal Combustion Systems”, presented at the EPRI conf. on Effects of Coal Quality on Power Plants, Kansas City, Missouri, USA (May, 1997). 18. K. Sandelin, “Water-Solubility of Trace Elements in Ashes and Other Solid Residues from Coal Combustion”, presented at 4th Nordic Ash Workshop, Alabama, Data City, Aabo, Finland (June, 1997). 19. W. P. Linak and J. O. L. Wendt, “Trace Metal Transformation Mechanisms during Coal Combustion”, Fuel Process. Techn., Vol. 39, pp. 173 - 198 (1994).