Imaging cells in a microfluidic chamber with an area scan camera is difficult due to ... lens less optics8, and programmable microfluidic chips9 , and holographic.
High-throughput microfluidic line scan imaging for cytological characterization Joshua A. Hutcheson¹, Amy J. Powless¹, Aneeka A. Majid¹, Adair Claycomb², Ingrid Fritsch², Kartik Balachandran¹, Timothy J. Muldoon¹ ¹Department of Biomedical Engineering, University of Arkansas, Fayetteville, AR, USA 72701 ²Department of Chemistry/ Biochemistry, University of Arkansas, Fayetteville, AR, USA 72701 ABSTRACT Imaging cells in a microfluidic chamber with an area scan camera is difficult due to motion blur and data loss during frame readout causing discontinuity of data acquisition as cells move at relatively high speeds through the chamber. We have developed a method to continuously acquire high-resolution images of cells in motion through a microfluidics chamber using a high-speed line scan camera. The sensor acquires images in a line-by-line fashion in order to continuously image moving objects without motion blur. The optical setup comprises an epi-illuminated microscope with a 40X oil immersion, 1.4 NA objective and a 150 mm tube lens focused on a microfluidic channel. Samples containing suspended cells fluorescently stained with 0.01% (w/v) proflavine in saline are introduced into the microfluidics chamber via a syringe pump; illumination is provided by a blue LED (455 nm). Images were taken of samples at the focal plane using an ELiiXA+ 8k/4k monochrome line-scan camera at a line rate of up to 40 kHz. The system’s line rate and fluid velocity are tightly controlled to reduce image distortion and are validated using fluorescent microspheres. Image acquisition was controlled via MATLAB’s Image Acquisition toolbox. Data sets comprise discrete images of every detectable cell which may be subsequently mined for morphological statistics and definable features by a custom texture analysis algorithm. This high-throughput screening method, comparable to cell counting by flow cytometry, provided efficient examination including counting, classification, and differentiation of saliva, blood, and cultured human cancer cells. Keywords: high-throughput, flow cytometry, leukopenia, line scan, lab-on-chip, microfluidics, proflavine
1. INTRODUCTION Traditional methods for neutrophil counts and three-part differentials (counting granulocyte, lymphocyte, and monocyte sub-populations of leukocytes) typically require up to several milliliters of blood per test. Three-part differential tests are essential in monitoring leukopenia in patients receiving chemotherapy. Chemotherapy typically leaves the patient myelosuppressed and susceptible to treatment induced infection.1-3 The differential test is also required to monitor the body’s response to certain chemotherapy drugs in leukemia patients and predict other potential hematopoietic disorders.4 Point-of-care hematology analysis methods seeking to provide differential counts aim to improve the speed at which results are delivered at the same or improved accuracy of traditional flow cytometry methods, while greatly reducing cost.5-6 Significant work has been accomplished lab-on-chip methods by exploiting cell impedance measurements7, lens less optics8, and programmable microfluidic chips9 , and holographic microscopy10 . These technologies present ways of sensing, however they are limited in imaging for morphological statistics outside of size. In this proposal we present an on-chip fluorescent imaging system that could be used at the point-of-care to image large numbers of proflavine stained leukocytes; these imaging data can be used to count and accurately classify large numbers of cells to yield and effective, statistically robust leukocyte differential count.
Microfluidics, BioMEMS, and Medical Microsystems XIII, edited by Bonnie L. Gray, Holger Becker Proc. of SPIE Vol. 9320, 93200Y · © 2015 SPIE · CCC code: 1605-7422/15/$18 doi: 10.1117/12.2079946 Proc. of SPIE Vol. 9320 93200Y-1 Downloaded From: http://proceedings.spiedigitallibrary.org/ on 03/31/2015 Terms of Use: http://spiedl.org/terms
Proflavine hemisulfate has been previously demonstrated as an effective rapid fluorescent staining method for a variety of point-of-care diagnostic imaging platforms.11-13 This dye can be applied as a topical contrast agent to tissue or in whole blood to preferentially stain leukocytes due to its ability to intercalate DNA. Since only leukocytes are nucleated in human blood, this makes it an attractive fluorescent stain for point-of-care blood analysis. A line scan camera was used as the preferential imaging modality of microscopic biospecimens; method of imaging has the capability to acquire images of fluid with limited motion blur. The image sensor is constructed of a line of pixels (as opposed to a two-dimensional array) which can be used to reconstruct the moving object line by line depending on the integration time, line read time, and data transfer rate. Our imaging system uses an ELiiXA+ 8k/4k monochrome line scan camera (e2v Aerospace, France) to acquire images of beads and biospecimens in a microfluidic environment. The line scan camera has a CMOS sensor of 4 lines with 8192 pixels, 5 X 5 um in size. It has 6 vertical and horizontal binning modes that yield a combination of pixel sizes. The ELiiXA 8k/4k features a line exposure time as low as 10 µs and the option to acquire at 8, 10, or 12 bit images. Line scan cameras have been previously used in biomedical applications in confocal imaging, hyper spectral imaging, optical coherence tomography, and fluorescence microscopy applications 14-16 but are also used in non-biomedical, commercial settings for high-resolution document scanning, postal sorting, and raw material surface inspection. The fast exposure times due to the high line-scanning rate of the camera typically result in very low signal-to-noise ratios, particularly in low intensity fluorescence imaging applications. To combat this, we adjusted the binning mode and set each line to maximize exposure for a given line-scanning rate. Binning pixels increases the effective pixel size and light- collection efficiency.
2. METHODS 2.1 Microfluidic chamber fabrication The microfluidic chambers were produced via standard soft lithography methods using a channel mold grafted by SU-8 negative photoresist onto a silicon wafer. The mold was produced with equipment supplied by the High Density Electronics Center (HiDEC) at the University of Arkansas. The fabrication of the poly(dimethylsiloxane) (PDMS) microfluidics channel requires a 10:1 ratio mixture of elastomer and curing agent (Sylgard), respectively. The mixture was thoroughly stirred and degassed in a vacuum chamber to remove air bubbles. Next, the degassed PDMS was poured over the channel mold inside a petri dish. The settled PDMS was degassed again to ensure complete removal of air bubbles then placed in the oven at 70°C for 3 hours. Once the PDMS was cured and allowed to cool for 5 minutes a razorblade was used to cut the mold from the excess PDMS. PDMS and silicon wafer were detached and gently score around the bottom edge of the silicon wafer to detach the PDMS. Using the dimensions of a coverslip, the microfluidics channel was cut out of the PDMS. The PDMS channel was then was washed in 50/50 ethanol and water in the sonicator for 30 minutes. The coverslip was washed in pre-prepared beakers of acetone, methanol, and isopropyl for 5 minutes each. PDMS channel and coverslip were dried separately and placed in UV/Ozone chamber for 15 minutes with the exposed channel indention facing up. Once surface modification is complete, the coverslip and PDMS were bonded to seal the channel. A hole punch, with a 3.18 mm outer diameter, was used to cut into the backside of the PDMS to create inlet and outlet ports. The chamber dimensions are 500 µm across and 50 µm deep. 2.2 Optical system design The line scan camera was set to bin the pixels in a 2 X 4 configuration (yielding an effective pixel size of 10 x 20 microns) and acquire at 75 µs integration and line read time. Line images were acquired with 8-bit bit depth and subsequently concatenated to display a graphical representation of the channel in a vertical time stack. The data was
Proc. of SPIE Vol. 9320 93200Y-2 Downloaded From: http://proceedings.spiedigitallibrary.org/ on 03/31/2015 Terms of Use: http://spiedl.org/terms
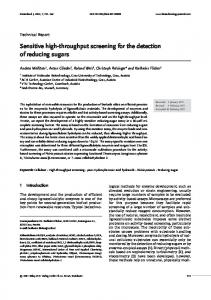
processed in MATLAB Image Acquiisition Toolboxx via CamerL Link to a PCIE E Frame Grabbber (BitFlow)). The 1 mm lens (Thorlabs) ( andd 40X oil imm mersion camera waas focused by an infinity corrrected lens syystem with a 150 objective (Nikon) ( with 0.24 mm WD D and 1.3 NA A. The microsscope was set up for invertted, epi-illumiination fluorescencce with an exccitation of 455 nm which em mits fluorescencce at 525 nm in i proflavine stained s samples. The filter cube had a dichroicc mirror with a reflective cutt-off at 475 nm m, an excitationn bandpass filter at 425 nm/225 nm, n 25 nm (Chhroma Technollogies) and an emiission bandpass filter at 515 nm/
Figure 1. Fluorescent line scan equipmentt set up exhibitiing the proposedd schematic (lefft). The full sysstem including syringe s pump (top, right). A speciffic DSLR imagee of the illuminnated microfluiddic channel susppended above thhe 40 X oil imm mersion objective (bbottom, right).
2.3 In-chaamber flow qu uantification The flow in i the microflu uidic chamber was controlledd by an automaated syringe pump (Braintree Scientific) annd the chamber dimensions. d Du ue to pressure differential at the inlet and outlet ports off the chamber, the linear flow w rate differs at the t focal planee with a changge in volumetrric pump rate. We quantifiedd this by meassuring the speeds of fluorescentt polystyrene microspheres m ( (Life Technoloogies), which fluoresce f at a wavelength w sim milar to the em mission of proflaviine. The beadss were transpoorted at increaasing volumetrric pump ratess to measure thhe linear transslation speed. Imaages were taken n with an area scan camera too measure beadd translation ovver a single fixxed area rather than a line-by-line reconstructio on of a singlee point over tiime. Images were w taken by a Point Grey Flea3 monochhrome F 2.0 (Po oint Grey) and analyzed in Im mage J (NIH). Images I were taaken at 5 millissecond exposuure and camera in FlyCap 3 decibels of gain at 60 frames per seccond. The movvement of the bead at the ceentroid was thhen calculated over a m per second. We thhen took the average a and staandard number off frames to calculate the lineear speed in millimeters
Proc. of SPIE Vol. 9320 93200Y-3 Downloaded From: http://proceedings.spiedigitallibrary.org/ on 03/31/2015 Terms of Use: http://spiedl.org/terms
2. deviations of the flow veelocities as dependent on the volumetric pum mp rates and developed d a graaph as seen in Figure F
2.4 Optim mization of line rate for imaage acquisition n A componnent of renderin ng high qualityy images at thee correct aspecct ratio with thhe line scanninng imaging sysstem is matching the t line rate to the speed of the t material thhat is being imaaged. To accom mplish a matchhing of the linne rate, we tested the t acquisition n with a fixed slide and a traanslational stagge (Thorlabs) with w an adjusttable linear speeed. A slide was fixed f of 10 µl of o fluorescent beads b suspendeed in PBS and mounted a #2 coverslip to thhe slide. A linee of oil was placedd on the coversslip so that thee objective nevver broke the refractive r indexx between objeective and covverslip; this was duue to the fact that t in this partticular setup thhe slide was moving m rather thhan the biospecimen. An ideeal rate of translatiion was determ mined to be appproximately 2.66 mm per seconnd with an inteegration and linne read time off 75 µs while binnning the pixels in i a 2 X 4 conffiguration. 2.5 Oral cell isolation an nd whole colleection Oral cells samples were taken from heaalthy volunteerrs via mouth swab. Samples were added too a prepared soolution of PBS, 0..1% (w/v) profflavine, and 500/50 glycerol in i distilled waater. The solutiion was then added a directly to the inlet tube connecting c thee syringe pumpp to the chambber to eliminatee opportunity time t for biospeecimens to setttle out of solutionn. Whole bloood samples were w taken from m healthy voluunteers by a finnger prick lanccet (ReliOn). The T first respoonse of blood to thhe tip of the fin nger was discaarded due to hiigh platelet conntent consequeence of the boddy’s natural im mmune response. 20 2 µl of blood was taken direectly from the tip of the fingeer and added too a heparinizedd tube. A 1:1 raatio of 0.2 % (w/vv) proflavine was w added to thee whole blood in the hepariniized tube. 3. RESULTS S AND DISCU USSION Linear flow w velocities weere measured at a volumetric puump rates from m 6.6 to 31.6 µl per minute att intervals of 5 µl per minute. Thhis experiment yielded an appproximation foor an ideal voluumetric pump rate r which is 21.5 2 µl per minnute to match the decided d line sccan parameters.
Figure 2. Increasing volumetric pump rates to determine thee linear flow velocity across the focal plane of the image sensor..
Proc. of SPIE Vol. 9320 93200Y-4 Downloaded From: http://proceedings.spiedigitallibrary.org/ on 03/31/2015 Terms of Use: http://spiedl.org/terms
The inform mation of the liinear flow speeeds and the inttegration time per line from the t translational stage experiiments were combbined to approx ximate the paraameters to view w 15 µm fluoreescent beads inn flow in our microfluidic m chaamber. Images off beads were used u to refinee the previous experimental approximations, so that we could then image biospecimeens in the micrrofluidic chambber. Figure 3 demonstrates d th he ability of thhe line scanninng microscopee to collect imaage data on suuspended, profflavine stained oraal cells. Each full f image preesented (left, Figure F 3) usingg current acquiisition softwaree yields an 8-bbit, 80 MB imagee. The original image is a verrtical time conncatenation of 384 ms of data compiled linne by line as thhe oral cells floweed by the focaal plane. The individual i orall cell images (insets, ( Figure 3) have been mined and coontrast enhanced directly d from th he original dataa set; these havve a max pixel intensity of upp to 55. In order too improve upo on signal to nooise limitationss of the line scanning s imagiing method, ann area scan im maging approach was w used to image leukocytess within the miicrofluidics chaamber. Leukoccytes typically demonstrate a lower fluorescentt signal which h requires greaater integrationn times, makinng the use of a conventionaal area scan camera c possible. The T flow rate th hrough the miccrofluidics channnel was sloweed to 2.5 µl perr minute to lim mit motion blur of the moving biospecimens. As A seen in Figuure 4, a neutroophil over a tiime lapse of 300 3 ms exhibitts significant rolling r action. Of note; the cell could be misttaken for monnolobar in certain projectionss, and care muust be taken foor any future autoomated classificcation algorithhm developmennt.
Figure 3. Seeries of concaten nated line scan im mages of proflavvine stained oral cells. Horizonttal scale bar is 100 µm and the vertical v scale bar is 7500 µs. The im mages of oral cellls (right) were cropped c and conntrast enhanced, demonstrating a maximum pixeel value of approxim mately 50 at the stated s integrationn times. Scale baars of inset imagges are 25 micronns.
Proc. of SPIE Vol. 9320 93200Y-5 Downloaded From: http://proceedings.spiedigitallibrary.org/ on 03/31/2015 Terms of Use: http://spiedl.org/terms
Figure 4. Im mage of a rolling g neutrophil overr a 300 ms time period from lefft to right past thhe area scan imaage sensor. Scalee bar is 15 µm.
4. CO ONCLUSION N In conclussion we have exhibited twoo imaging moddalities with unique u capabillities based onn precise conttrol of solution, containing c proflavine stainedd biospecimenns, in a microofluidic enviroonment. The liine scan imagging is efficient ass a high-throug ghput screeninng tool but has limitations in light collectioon and limited field of view. It can only reconnstruct images as a they pass thhe line of pixels at the focal plane p of the CM MOS sensor. The T area scan camera c is effectivee to view biosp pecimens over a period of tim me with a largerr field of view but is limited in speed becauuse the linear transslation must bee decreased to compensate foor motion blur.. The motivatioon for this techhnique is to coombine an efficiennt fluorescent dye and a novvel line scannning microscoppe to create a high-throughpput on-chip im maging device. Fuuture work is being b pursued to control fluid flow more precisely p by ussing a promisinng on-chip pum mping method exxploiting mag gnetohydrodynaamic transporrt.18-19 Future work will fuurther define the limitationns and effectiveneess of area scaan and line scaanning techniqques for on-chhip imaging byy developing our o understandding of linear flow w translation wiithin the microfluidic environnment for a varriety of biospeccimens. 5. RE EFERENCES S k and consequeences of chemootherapy-induceed neutropenicc complicationss in patients [1] Weyckker et al., “Risk receiving daily d filgrastim m: the importannce of duration of prophylaxiss”. BMC Healtth Services Ressearch (2014), 14:189 [2] Vehreschild, J. J., et al. a "Prophylaxiis of infectiouss complicationss with colony-sstimulating facctors in adult caancer patients unndergoing chem motherapy—evvidence-based guidelines g from m the Infectiouus Diseases Woorking Party AG GIHO of the Germ man Society fo or Haematologyy and Medical Oncology (DG GHO)."Annals of Oncology (2014): ( mdu035. [3] Weyckker, Derek, et al. "Incidence, treatment, t and consequences of chemotheraapy-induced febbrile neutropennia in the inpatiennt and outpatieent settings." Joournal of Oncoology Pharmacyy Practice 20.33 (2014): 190-1198. [4] Liu, Maoxuan, et al. "Hematopoieti " c effects and mechanisms m of< f< i> Fufang E ׳jiao Jiang > on radiotherappy and chemootherapy-induced myelosupprressed mice." Journal J of ethnopharmacologyy 152.3 (2014)): 575-584. [5] Shadfann, Basil H., et al. "A multipleexable, microflluidic platform m for the rapid quantitation q off a biomarker panel p for early ovvarian cancer detection d at thee point-of-care." Cancer Prevvention Researcch (2014). [6] Shieldss IV, Wyatt, C.., Reyes, C.D., and Lopez, G.. "Microfluidicc Cell Sorting: A Review of thhe Advances inn the Separationn of Cells from Debulking to Rare R Cell Isolaation." Lab on a Chip (2015).. [7] Canali, Chiara, et al. "Bioimpedancee monitoring of o 3D cell cultuuring—Compleementary electrrode configuraations for enhanced spatial senssitivity." Biosennsors and Bioeelectronics 63 (2015): ( 72-79. [8] Cetin, A. A E., et al. "H Handheld high-tthroughput plaasmonic biosennsor using compputational on-cchip imaging." Light: L Sciencee & Applicationns 3.1 (2014): e122. e
Proc. of SPIE Vol. 9320 93200Y-6 Downloaded From: http://proceedings.spiedigitallibrary.org/ on 03/31/2015 Terms of Use: http://spiedl.org/terms
[9] Karabacak, Nezihi Murat, et al. "Microfluidic, marker-free isolation of circulating tumor cells from blood samples." Nature protocols 9.3 (2014): 694-710. [10] Vercruysse, Dries, et al. "Three-part differential of unlabeled leukocytes with a compact lens-free imaging flow cytometer." Lab on a Chip (2015). [11] Vila, P. M., et al. "Accuracy and interrater reliability for the diagnosis of Barrett's neoplasia among users of a novel, portable high‐resolution microendoscope." Diseases of the Esophagus 27.1 (2014): 55-62. [12] Abbaci, Muriel, et al. "Confocal laser endomicroscopy for non-invasive head and neck cancer imaging: A comprehensive review." Oral Oncology (2014). [13] Muldoon, T.J., Roblyer, D., Williams, M.D. et al., “Noninvasive imaging of oral neoplasia with a highresolution fiber-optic microendoscope,” Head & Neck, 34(3), 305-312 (2012). [14] Zhang, Pengfei, Goodwin, P.M, and Werner J.H. "Fast, 3D imaging via confocal line scanning of a Bessel beam using a single galvo mirror." SPIE BiOS. International Society for Optics and Photonics, 2014. [15] Pierna, Juan Antonio Fernández, et al. "Line scan hyperspectral imaging spectroscopy for the early detection of melamine and cyanuric acid in feed." Journal of Near Infrared Spectroscopy 22.2 (2014): 103-112. [16] Adhi, Mehreen, et al. "Choroidal Analysis in Healthy Eyes Using Swept-Source Optical Coherence Tomography Compared to Spectral Domain Optical Coherence Tomography." American journal of ophthalmology 157.6 (2014): 1272-1281. [17] Heng, X., and Patt, P. "Serial-line-scan-encoded multi-color fluorescence microscopy and imaging flow cytometry." U.S. Patent Application 14/148,600. [18] Sahore, V., and Fritsch, I. "Redox-Magnetohydrodynamics, Flat Flow Profile-Guided Enzyme Assay Detection: Toward Multiple, Parallel Analyses." Analytical chemistry 86.19 (2014): 9405-9411. [19] Sahore, V., and Fritsch, I. “Flat Flow Profiles Achieved with Microfluidics Generated by RedoxMagnetohydrodynamics (MHD)” Analytical Chemistry, 85, 11809-11816 (2013).
Proc. of SPIE Vol. 9320 93200Y-7 Downloaded From: http://proceedings.spiedigitallibrary.org/ on 03/31/2015 Terms of Use: http://spiedl.org/terms