Hindawi Publishing Corporation Advances in Bioinformatics Volume 2015, Article ID 728164, 7 pages http://dx.doi.org/10.1155/2015/728164
Research Article High-Throughput Quantification of Phenotype Heterogeneity Using Statistical Features Ahmad Chaddad and Camel Tanougast Laboratory of Conception, Optimization and Modelling of Systems, University of Lorraine, 7 rue Marconie, Metz, 57070 Lorraine, France Correspondence should be addressed to Ahmad Chaddad;
[email protected] Received 24 May 2015; Revised 28 September 2015; Accepted 1 October 2015 Academic Editor: Klaus Jung Copyright © 2015 A. Chaddad and C. Tanougast. This is an open access article distributed under the Creative Commons Attribution License, which permits unrestricted use, distribution, and reproduction in any medium, provided the original work is properly cited. Statistical features are widely used in radiology for tumor heterogeneity assessment using magnetic resonance (MR) imaging technique. In this paper, feature selection based on decision tree is examined to determine the relevant subset of glioblastoma (GBM) phenotypes in the statistical domain. To discriminate between active tumor (vAT) and edema/invasion (vE) phenotype, we selected the significant features using analysis of variance (ANOVA) with p value < 0.01. Then, we implemented the decision tree to define the optimal subset features of phenotype classifier. Na¨ıve Bayes (NB), support vector machine (SVM), and decision tree (DT) classifier were considered to evaluate the performance of the feature based scheme in terms of its capability to discriminate vAT from vE. Whole nine features were statistically significant to classify the vAT from vE with p value < 0.01. Feature selection based on decision tree showed the best performance by the comparative study using full feature set. The feature selected showed that the two features Kurtosis and Skewness achieved a highest range value of 58.33–75.00% accuracy classifier and 73.88–92.50% AUC. This study demonstrated the ability of statistical features to provide a quantitative, individualized measurement of glioblastoma patient and assess the phenotype progression.
1. Introduction Glioblastoma is the most common tumor and most aggressive primary brain malignancy in adults [1]. The inability to perform complete surgical tumor resection and poor drug delivery to the brain contribute notably to the limited treatment options. Despite all efforts, the average of patient survival with GBM currently is thereabouts 14.6 months [2]. GBM consists of active tumor, peritumoral edema, and necrosis parts, as designated by the combination of T1weighted (T1-WI) and Fluid-Attenuated Inversion Recovery (FLAIR) images in MRI. The active tumor region is described as the contrast-enhancing portion in T1-WI images and peritumoral edema is defined as the hyperintense region of FLAIR images, located outside the active area. The recent improvements in MRI technology using the integration of diffusion and perfusion weighted imaging have provided deeper insights into the pathological behavior of tumors [3, 4].
Until now, radiologists have used MR imaging for relatively gross disease detection. We hypothesize that radiomics with the availability techniques in image processing applied on the raw data derived from MRI can make radiological examinations more effective. In this way, automatic data computation could foster faster and effective readings of numerous types of images and classify them as normal or cancerous [5]. Such a system must have the ability to detect and extract the abnormal areas from their surroundings by automatic segmentation techniques such as multithresholding segmentation technique with the morphological image processing [6]. In terms of tumor heterogeneity, technical research has investigated this heterogeneity by quantifying its texture using numerous functions. For instance, feature extraction based on the gray level cooccurrence matrix (GLCM) with Haralick features is a popular technique used for texture analysis [7]. Then, GLCM computes the neighborhood correlations around pixels where the GLCM is calculated by the paired pixel in specific offset (distance)
2
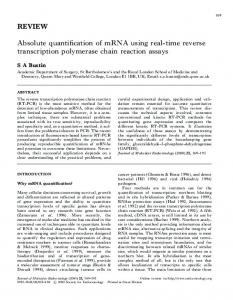
2. Materials and Methods To prove the hypothesis, we focused on the optimal subset features from the statistical features which are derived from GBM tumors using active GBM portion with high intensity pixels VAT and peritumoral V𝐸 of GBM with middle intensity pixels. Two Gaussian distributions could clearly be observed in the histogram data of GBM (Figure 1). To assist automated recognition of the GBM phenotype based heterogeneity, histogram statistical features and classifier techniques were used for discriminating active tumor parts from edema parts in FLAIR images. Decision tree was considered to recognize the dominant statistical features which represented the foremost characteristic of GBM heterogeneity [13]. The proposed approach is presented in Figure 2. 2.1. Patient Information, Data Acquisition, and Segmentation. After excluding samples with incomplete data, a set of 30 patients was randomly selected from The Cancer Imaging Archive (TCIA, http://www.cancerimagingarchive.net/) publicly available database for a preliminary study. To obtain full imaging sets, 30 other GBM patients’ data (age 50–68 years; 15 males, 15 females) were additionally chosen randomly from the TCIA database. Image pixels of the tumor regions were independently normalized on a scale from 0 to 1 (e.g., Figure 1(b) where the x-axis represents the normalized tumor pixels). The images were transformed into gray scale (using Matlab 2013 software) before further processing. Only FLAIR sequences were considered in this study. All the images were reconstructed to 512 × 512 matrices by segmenting the appropriate area of GBM by board certified radiologists, using the 3D slicer tool (Figure 3) [14]. Moreover, V𝐸 and VAT phenotypes were segmented manually slice-by-slice and organized in order to extract the statistical features. Statistical features of edema and active tumor parts were extracted then from raw FLAIR images. 2.2. Statistical Features Extraction. Features were extracted from the histogram shape, which is an area of the variable
50 100 150 200 250 300 350 400 450 500
500 400 300 200 100 50
0
100 150 200 250 300 350 400 450 500 (a)
700 Histogram (count number)
and phase (direction). Statistical (histogram) analysis has been established for the pixel intensity or the map of pixel orientations. In this context, the statistical approach used has been the texture-based approach [8–12]. Previous studies of GBM assessment have required registration of T1-WI and FLAIR for identifying the phenotypes, and each of the visible phenotypes is segmented manually by board certified radiologists. In this paper, a novel approach for analyzing GBM phenotypes using FLAIR images only is introduced. Histogram based statistical features can offer a simple way to characterize GBM heterogeneity across the phenotypes, namely, VAT and V𝐸. Reproducible quantifiable imaging features of GBM heterogeneity that explicitly examine links between the imaging findings and the underlying GBM phenotypes characteristics are identified. Introduced quantitative histogram features can discriminate phenotype heterogeneity from MRI images and thereby strengthen personalized medicine in GBM [12].
Advances in Bioinformatics
Active tumor
600 Edema
500 400 300
Necrosis
200 100 0
0
0.1
0.2 0.3 0.4 0.5 0.6 0.7 0.8 Normalized data of GBM phenotype
0.9
1
(b)
Figure 1: Histogram of the GBM tumor. (a) Raw image of FLAIR sequence; (b) two Gaussian distributions represent V𝐸 and VAT and necrosis parts which are located inside the VAT with lower intensity values.
description based on the shape, and provided the frequency of values from different ranges of the variable. These features were applied previously in cervical cancer diagnosis using histogram based analyses of diffusion-weighted MR and its relation to histological features, subtype, and grade of cervical cancer [15, 16]. We quantified the two GBM phenotypes by nine statistical functions (Table 1). All GBM patient data were plotted as histograms showing individual GBM data and their respective frequencies (Figure 1(b)). Features describing major statistical characteristics of these distributions were extracted according to Table 1 [15]. All features were extracted from histograms of GBM, according to
𝑅VAT
𝑓1,1 ⋅ ⋅ ⋅ 𝑓1,9 ] [ ] [ = [ ... d ... ] , ] [ [𝑓𝑚,1 ⋅ ⋅ ⋅ 𝑓𝑚,9 ]
(1)
where 𝑚 is the number of VAT samples, for each patient’s one feature vector included nine features:
𝑅V𝐸
𝑓1,1 ⋅ ⋅ ⋅ 𝑓1,9 ] [ ] [ = [ ... d ... ] , ] [ [𝑓𝑘,1 ⋅ ⋅ ⋅ 𝑓𝑘,9 ]
(2)
Advances in Bioinformatics
3 Segmented phenotypes from FLAIR images using 3D slicer
MRI: data acquisition preprocessing (standardization, registration)
Features extraction/ features selection
Classifier techniques decision tree, SVM, naïve Bayes
Performance evaluation
Figure 2: Block diagram of the proposed approach.
20 20
15
15 10
10
5
500
500 400 300 200 100
100
200
300
400
500 0
(a)
400
200
0
(b)
20
15 10 5 0 400
400 200
200 0
0 (c)
Figure 3: Example of phenotype segmentation. (a) Raw image of FLAIR sequence, (b) edema part V𝐸, and (c) active tumor VAT.
where 𝑘 is the number of V𝐸, for each sample, and is similar in size to the nine features. Note that the feature value represents the average of corresponding values of all slices in each patient. One matrix vector 𝑅 is organized according to (3)
2.3. Statistical Analysis. Features were normalized using 𝑍scores which convert each of the feature vectors to have zero mean and unit variance. Moreover, an ANOVA test was used to assess the statistical significance between features and phenotypes [17]. This test was used to select the feature where 𝑝 value < 0.01 was considered significant. Note that the total statistical features were found to be significant which are reported in Table 2.
For the GBM heterogeneity analysis, the aforementioned histogram features were extracted from the FLAIR MR images corresponding to the heterogeneity of VAT and V𝐸. Therefore, the length of the resulting feature vector was nine. This statistical feature vector was taken as GBM heterogeneity based on VAT and V𝐸, for the classification task at hand.
2.4. Classifier Setting and Performance Metrics. Supervised technique such as the support vector machine (SVM) [18], na¨ıve Bayes (NB) [19], and decision trees (DT) classifier [20] has become a popular learning algorithm for data mining applications, as employed to classify VAT from V𝐸. A leave-one-out cross-validation was applied to obtain closely
𝑅 = {𝑅VAT , 𝑅V𝐸 } .
4
Advances in Bioinformatics Table 1: Statistical features description.
Table 3: Metrics (%) of VAT and V𝐸 discrimination.
Symbol
Features
𝑓1
Geometric mean, indicates the central tendency
𝑓2 𝑓3
Harmonic mean, calculates the average sample Mean excluding outliers, measures the probability distribution
𝑓4
Mean (average)
𝑓5
Standard deviation (absolute deviation) 75th percentile, splits off the highest 25% of pixels from the lowest 75%
𝑓6 𝑓7
Features
𝑓9 Features vector
𝐹 = {𝑓1 , 𝑓2 , 𝑓3 , 𝑓4 , 𝑓5 , 𝑓6 , 𝑓7 , 𝑓8 , 𝑓9 }
Table 2: Mean ± standard deviation of VAT and V𝐸. Features 𝑓1 𝑓2 𝑓3 𝑓4 𝑓5 𝑓6 𝑓7 𝑓8 𝑓9
VAT 473.02 ± 345.65 466.49 ± 344.81 478.88 ± 347.18 47.50 ± 31.33 37.92 ± 25.98 327.31 ± 294.16 519.27 ± 367.27 −0.20 ± 0.29 3.58 ± 0.85
V𝐸 461.15 ± 341.98 453.57 ± 342.15 468.25 ± 342.53 53.69 ± 31.15 44.19 ± 25.18 321.74 ± 302.46 516.73 ± 359.66 −0.09 ± 0.40 2.93 ± 0.59
𝑝 value