known to be drastically influenced by the presence ofdis- pendence and the temperature dependence of the trans- solved HrO (Sabatier, 1956; Burnham, 1963; ...
American Mineralogist, Volume 79, pages I I25-I 134, 1994
Kinetics of quenchingof hydrous feldspathic melts: Quantification using synthetic fluid inclusions Crauor,l Rou^nNo, DoN.lr,o B. DrNcwnu" S. Mrcnn'nr- Srnnxnn Bayerisches Geoinstitut,Universit.iitBayreuth,95440Bayreuth,Germany ABSTnAcI A microthermometric analysisof fluid inclusions preservedduring the isobaric quenching of HrO-saturated, vesicular silicate melts provides a method for the determination of the glasstransition temperature of hydrous silicate melts at high pressure.The method is basedon the principle that the contraction ofinclusion cavities during quenching is ratelimited by the volume relaxation of the melt. Viscous relaxation of the melt ceasesduring cooling at the glass transition temperature. Bulk densities of the fluid inclusions whose volumes are frozen at the glasstransition preservea record ofthe trapping event, i.e., the glasstransition temperature. Liquid-vapor homogenization temperatures[2",.-,,] of the trapped inclusions are measured using a microscope heating-stageassembly. Bulk densities of HrO present in the are determined from literature values as ate the P-T inclusions at fH(L-v)and Po,u,u,,on trajectories of the corresponding isochores.The intersection of an isochore with the experimental pressure during the quench yields the glass transition temperature for that particular glasscomposition and quench rate. The method has been applied to sevencompositions on the join albite-orthoclase.HrOsaturatedmelts along thisjoin have been rapidly and isobarically quenchedat 2000 bars. T h e t o t a l s o l u b i l i t i e s o fH r O r a n g e f r o m 5 . l 2 t o 6 . 0 3 + 0 .1 5 w t 0 / 0 . T h e g l a s s t r a n s i t i o n temperatures of the Hro-saturated melts range from 525 to 412 "C. The compositional dependenceof the glasstransition is strongly nonlinear. Melts of intermediate composition exhibit a significantly lower glasstransition than either end-member. The deviation from additivity reachesa maximum of 70 "C at AbroOrro(molar basis). The information on { can be combined with data for the properties of the quenched glassesto obtain liquid properties at hydrothermal conditions, for example, the viscosity and the thermal expansivity of the wet melts. The quantification of trapping temperatures for fluid inclusions in silicate melts also has potential applications in the study of the kinetics of melt degassing.
some acidic volcanoes)by a factor of l0 over a mere 30 "C (Carron, 1969).This extreme temperaturedependence Perhapsthe most spectacularcaseof the composition at geologicallyrelevant temperaturesmakes quantitative dependenceof melt properties results from the addition prediction of the properties of igneous melts, which are of a few weight percentagesof HrO to acidic silicate melts being cooled rapidly during eruption, extremely difficult. (Shaw, 1963). The transport properties of such melts are The combination of the strong HrO-concentration dependenceand the temperature dependenceof the transknown to be drastically influencedby the presenceofdissolved HrO (Sabatier,1956; Burnham, 1963;Shaw, 1963; port properties of acidic silicate melts meansthat one of Watson, 1981). It is clear that the dependenceof these the outstanding challengesof the prediction of melt betransport properties on HrO content is a controlling fac- havior in the critical temperature range of crystallization tor in the physics of plutonic and subvolcanic petroge- and eruption lies in the acquisition of transport property netic processes.Another remarkable aspectof acidic sil- data for hydrous silicate melts at relatively low tempericate melts, wet or dry, is the extremely large temperature atures and high viscosities. Only through a combination dependenceof some transport properties in the temper- of high and low temperature data can a reasonableinterature range correspondingto the late stagesof petrogen- polation ofproperty data over the entire temperaturerange esis.In particular, melt viscosity, and other related prop- of petrogenesisbe made. The limiting caseof the viscous deformation of silicate erties, can vary (in the range of eruption temperaturesof rr25 / ttr2-t l 25$02.00 0003-004x/94 lqrnooucrroN
tt26
ROMANO ET AL.: KINETICS OF QUENCHING OF FELDSPATHIC MELTS
melts is a viscoelastic transition that expressesthe glass evaluate possible methods for studying the glass transitransition in silicate melts. At this transition, many con- tion in hydrous melts. figurational changesin the structure of the liquid ceaseto How is the glasstransition temperaturemeasured?Trachangewith further cooling. Thus, the lowest temperature ditional studies of determination of the glass transition directly relevant to the igneous petrogenesisof incom- temperature were, for practical reasons, restricted to a pletely crystallized igneousrocks is that of the glasstran- very narrow interval of experimental time scaleor relaxsition. This transition has important consequencesnot ation times. Historically, interest in the glass transition only for the rheology but also for the thermal expansivity was an outgrowth of processing of industrial glass. and heat capacity of melts and magmas.It is thus appar- Knowledge of the annealing behavior over a relatively ent that knowledge of glass transition temperatures for restricted range of time scaleswas all that was needed. magmasinvolved in eruptive processesis a prerequisite Thus the importance of the explicit definition of the refor the modeling of volcanic systems.Becausethe glass laxation time scale remained vague. In contrast, time transition is a kinetic phenomenon, referenceto its tem- scalesfor igneousprocesses (Speraet a1.,l98l; Dingwell perature must always be accompaniedby explicit or im- and Webb, 1989;Webb and Dingwell, 1990a,1990b)and plicit referenceto the time scaleof interest. This feature for experimental methods in mineral and melt physics is not only of theoretical importance. Quite the contrary, (Bagdassarovet al., 1993 Webb, 1992; Webb and Dingthe temperature-dependenceof the time scaleassociated well, 1990a,1990b)may spanmany ordersof magnitude. with the glasstransition scalesnearly linearly to the tem- A simple but powerful example of the latter is that of perature dependenceof the viscosity, whose great mag- ultrasonic wave propagation in sodium disilicate melt, nitude we have already noted above (Scherer, 1986; which generatesa glass transition temperature 300 "C Dingwell and Webb, 1989).The practical consequences above that obtained by conventional means(Webb, 1992) of a glass transition temperature that varies with time becauseof the shifted time scaleof the method. scale can be extreme. The brittle-ductile transition of a As noted, the traditional methods of glass transition magma during eruption might be crossedrepeatedlydur- studies span a relatively small range of time scales.The ing cooling becauseof the successivelylonger time scales most common measurementsare dilatometric determiof deformation accompanyingsuccessivelycooler defor- nation of the expansivity(Tool and Eichlin, 1931;Knoche mation events, for example, in the formation of pyro- et al.. 1992'.Webb et al.. 1992) and calorimetric deterclastic deposits. A magma that has behaved brittlely in mination of the heat capacity(Martenset al., 1987).The the volcanic vent can behaveductilely at even lower tem- application of such methods to geologicallyrelevant melt perature during ignimbrite compaction, as is the casefor compositions has been pursued in the past few years ignimbrite fiamme (Fisherand Schminke,1984). (Dingwell and Webb, 1989; Webb and Dingwell, 1990a, The chemical principles underlying the incorporation 1990b; Dingwell, 1993). The dilatometric method at I of HrO into silicatemelts, i.e., those responsiblefor the atm has even been applied to wet rhyolite glasses(Taniobserveddependenceof melt properties on HrO concen- guchi, 198l), although HrO loss is a potential problem. tration, can only be understood when the dependenceof The calorimetric method has also been applied by RoHrO solution on temperature, pressure,HrO concentra- senhaueret al. (1979) to dry melts at high pressure.Hytion, and compositionhas beenisolated.In recentyears, drous melts at high pressurehave not yet been investimuch progress in our understanding of the solution of gated. Here we present a new method for the HrO in silicate melts has been achieved (Stolper, 1982a, determination of the glass transition temperature in the 1982b;Silver and Stolper, 1985;Eckert et a1.,1987;Sil- high pressure,vesicular,hydrous glassesthat are the comver and Stolper, 1989; Kohn et al., 1989; Dingwell and mon product of hydrothermal experiments in petrology. Webb, 1990;Ihinger,l99l1'Zhangetal., 1990;Holrz et We draw attention to a number of potential pitfalls in the al., 1992,1993). This has resulted,in part, from recog- method and, having tested for flaws, apply the method nizing that the majority of the now-abundant data for the to the system albite-orthoclase-HrO at 2000 bars. speciation of H,O in silicate glasses(Stolper, 1982a, 1982b,1989;Silveret al., 1990;Ihinger,l99l) must be Mrrrroo correctedto the structural stateofthe glassproduced during the quench (i.e., correcting for the glass transition Theory temperature:Dingwell and Webb, 1990).For this we need A general outline of the principles of relaxation, the glasstransition temperaturesfor experimental quenches glass transition and their relationship to the cooling or quenching of silicate melts into the glassystate, has been of hydrous melts. From the above discussion it becomes clear that an provided in recent years (Dingwell and Webb, 1989, accurate understanding of the dependenceof the glass 1990).The use of estimatedtransition temperaturesin transition on pressure, temperature, composition, and predicting the structure and properties of silicate liquids HrO concentration could contribute greatly to the mod- from their quench glasseshas also been described(Richet eling of igneous processesand to the evaluation of ex- and Bottinga,1984;Brandrissand Stebbins,1988;Webb perimental products. Such considerationshave led us to and Dingwell,1990a,1990b;Dingwell,1990,1993;My-
tt27
ROMANO ET AL.: KINETICS OF QUENCHING OF FELDSPATHIC MELTS
TABLE1. Analyzedanhydrouscompositionsand HrO contents of glasses (wt% oxide) SiO, (a1)
AlrO3 (+0.s)
NarO (+0.7)
68.1" 68.7 69.1
19.1 19.4 19.0 19.3 19.0 19.1 18.9 18.9 18.8 18.6 18.8 18.4 18.5 18.3
11. 8 11.8 10.9 10.6 8.0 8.1 5.6 5.7 3.3 3.4 1. 2 1.1
Glass N?,oo NaeoKlo
68.s glass transition (fast and slow cooling)
NaToK3o NasoKso
66.7 Na3oKTo NaloKso
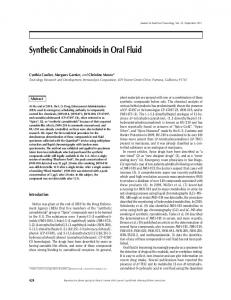
Fig. l. A schematicillustrationof the methodusedin the studyfor the determinationof the glasstransitiontemperature Seetext for discussion of this figure of hydroussilicateglasses. (redrawnfrom Dingwell, 1993). sen and Frantz, 1992). The following discussionis restricted to those aspectsofthe glasstransition relevant to the principle employed here. The experimental method currently employed for the determination of Q is illustrated schematicallyin Figure l. The P-Z trajectoriesof the HrO liquid-vapor coexistence curve from some low temperatureup to the critical point and of two representativeisochores (lines of constant H2O density) are as indicated. Initially, the experimental chargeis allowed to dwell for a time sufrcient to allow the chemicalequilibration of a HrO-saturatedsilicate melt at pressureand temperature.The melt contains bubbles becausethe viscosity of the liquid (initiaily a powder) is high enough to prevent the escapeofvesicles during the experiment. The horizontal line extending down-temperaturefrom the dwell point representsan isobaric quench path ofthe experiment.The two curveswith negative slopes represent hypothetical glass transition curves correspondingto different cooling rates. The negative slopesofthe curves is basedon the observation that the (isothermal) viscosity of HrO-saturated melts decreaseswith increasing pressure,due to increasing HrO content. Consider the fate of inclusions of HrO in the vesicles of an equilibrated, HrO-saturated silicate melt during the isobaric quenching. If one assumesthat the quench is sufficiently rapid that no significant exchangeof HrO occurs between melt and fluid, then the mechanical responseto the quench is a simple contraction of melt and bubbles, by volume relaxation, down to lower temperature. This viscous contraction continues with decreasing temperature until a temperature point where the exponentially increasingviscosity, reflectinga structural relaxation time for the melt, becomestoo high. This point is the glasstransition temperature for the cooling rate used. It is the temperature at which the structure of the equilibrium liquid most closely resemblesthe structure of the quenchedglass:it is here that the densitiesofthe ideally nonreacting fluid inclusions are frozen in.
67.8 67.5 67.6
K,oo
66.4 65.9 65.3 65.1 65.4
64.8
H,O' K"O (+0.6) (+0.15)
1.8 1.8 5.4 5.3 8.7 8.7 12.O 12.1 15.6 15.3 16.5 16.9
Total
6.03
99.00
6.03
101.00
6.00
100.20
5.81
100.80
5.52
100.s0
5.27
100.90
5.12
100.40
Note: nominalcompositionsare italicized.Na,* : NaAlSi3os(albite),K,@ : KAlSi3os(orthoclase). . Measured by Karl Fischertitration (Romano et al., in preparation). -- Compositionsdetermined by ICP analysis.
Subsequentdetermination of the bulk densitiesof fluid inclusions trapped in the quenchedglassesby measuring their liquid-vapor homogenizationtemperaturescan then be used to define isochores (Fig. l) that must intersect the isobaric quench path at Q. Our tests of the method, and the results presentedbelow, indicate that under certain conditions of experimentalquench,HrO content, and pressure,fluid inclusion analysiscan be used successfully to predict the glasstransition temperature. Synthesis The anhydrousstartingglassesusedin the presentstudy were generatedby the direct fusion of 100 g (decarbonated equivalent) batches of powder mixes of the alkali carbonates,SiOr, and AlrOr. The powder mixes were fused in air in thin-walled 75 cm3 Pt crucibles for approximately 2 h at 1650 "C. The products of the initial fusion were vesicular. To remove bubbles, to react fully, and to homogenizethe starting glasses,the melted batcheswere transferred to a second furnace equipped with a hightemperature viscometer and stirred at 50 or 100 rpm for hours to days at 1650 "C. The products ofthese second fusions were cooled in air by removing them from the furnace, and they were sampled for dilatometry and hydration experiments by drilling cores 8 and 3 mm in diameter with HrO-cooled diamond coring tools. Glasses so produced were analysed by ICP-AES. The results of the analysesare presentedin Table l Glass samples were then crushed to obtain a powder for hydrothermal experiments (grain size of the powder: 200-500 pm). One hundred mg of powder were loaded togetherwith - l0 mg of doubly distilled H,O in capsules formed from Pt tubing and sealed with an arc-welder. The amount of added HrO was chosento be about 4-5 wto/ohigher than the expectedsolubility of HrO in these melts (on the basis of data from Romano et al., in prep-
I 128
ROMANO ET AL.: KINETICS OF QUENCHING OF FELDSPATHIC MELTS
aration). This value was chosen to be high enough to producea largenumber of fluid inclusionsbut low enough to minimize possible changesin the anhydrous stoichiometry of the melt resulting from incongruentdissolution of silicatecomponentsin HrO. The capsuleswere checked for possibleleakageby testing for weight loss after drytng in an oven at 100 "C for at least I h. The capsuleswere placed in TZM vessels,pressurized to 2 kbar, and heated to I 100 'C where they were held for a time sufficient to allow the complete homogenization of H,O dissolvedin the melt by diffusion through the sample. Experiment durations ranged from 3 to 5 d. Temperature was measuredwith a Ni-NiCr thermocouple (accuracy + 15 'C), and the pressurewas measured with a strain-gaugemanometer (accuracy +20 bars). After the high pressure-high temperature dwells, the samples were quenched in the TZM vesselsby dropping the sample into the cold part of the vessel(estimatedquench rate 200'Cls). Specialcare was taken during the quench to maintain isobaric conditions by opening the vesselto the pressureline (2000110bars). Fluid inclusion analysis After quenching, the samples were crushed to millimeter-sized fragments in preparation for microthermometric investigation of the fluid inclusion, liquid-vapor, homogenization temperature. Attempts to perform heating stageanalyseson the experimentalglassesunder l-atm ofair pressurewere unsuccessful.The pressuredifference (=60 bars) between the fluid inclusions and the ambient conditionsresultedin the decrepitationofinclusions and the fragmentation of entire specimens.To eliminate this problem, small inclusion-bearingglasschips were loaded along with pure HrO in a doubly polished, fused silica tube (1-1.5 cm long, l-mm i.d., 2-mm o.d.).The vapor pressuregeneratedin the tube during the heating stage measurementswas then equal to that in the fluid inclusionsprior to homogenization.Inclusion decrepitationwas thus prevented by eliminating the differential pressures acrossthe sample. Microthermometric measurementsof phasetransitions in fluid inclusions trapped in quenchedglasseswere performed using a petrographic microscopeequipped with a slightly modified gas-flowheatingand freezingstagefrom Fluid, Inc. (Werre et al., 1979). Becauseof the unusual sample geometry required by the enclosure of the glass fragments within a 2-mm o.d. silica glass tube, special procedureswere employed to characterizeand minimize thermal gradients within the stageover the observed range of homogenizationtemperatures.The glassplate on which the sample rests under normal operating conditions was replacedby a slotted Cu plate, which held the silica tube at approximately the same vertical position. Upper and lower facetswere ground into the silica tube to facilitate visual observations.All Zn measurementswere made with the thermocouple tip resting on the approximate center of the tube; thus the maximum distanceof any measured inclusion from the thermocouple tip was < I cm. The
maximum range observed in In for inclusions from a single sample is 9 "C. A range of 4 "C is more typical. The thermal gradient presentduring the heating experiments was determined by a temperature calibration of the stage.The temperature standards used for the calibration were powders of KCIO. GCTA certified reference material 759) and KNO. (Alfa Products s-89812).The 'C temperature referenceswere a phasetransition at 299 in KCIO. and the melting of KNO, at 333 "C. This calibration leads to a temperature correction for homogenization temperaturesof 15 + 6 'C. This calibration was performed with the quartz tube at dry conditions. Convection of the HrO medium under the pressureof the liquid-vapor coexistencecurve might reduce the correction. The above correction should be viewed as a maximum estimate.It has been applied to the results reported below. Final melting temperaturesof fluid inclusions in quenched glasseswere observed without confinement in silica tubes.Associateduncertaintiesin Z- measurements are estimated at +0. I 'C and reflect the combined effects of low-temperature thermal gradients and thermocouple calibration errors. Prior to homogenization, several inclusions were selected from each sample, and their longest and shortest visible dimensions of severalinclusionswere recordedfor later volume calculations.All the inclusions examined in this study homogenizedto the liquid along the pure HrO liquid + vapor (L * V) curve. No homogenizationcaused by fading of the meniscusor disappearanceof the liquid phaseswas observed.The choice of the heating rate was critical. Inclusions that were heatedtoo quickly exhibited a hysteresisdue to kinetic factors,whereasinclusions that were heated too slowly exhibited an increasein the volume of the vapor phase,presumably causedby HrO loss or inclusion deformation (seebelow). A heating time of about 0.1 'Cls (in the temperature range of homogenization), intermediate betweenthe two extremes,was chosen and was kept identical for all the measurements. Fluid composition To estimate the glasstransition temperature using our proposed method one must be able to predict accurately the phaseequilibria and volumetric properties of the fluids trapped in the inclusions. An obvious prerequisite is that one knows the composition of the fluid. In the present experiments, we have modeled the behavior of the inclusion fluids after the properties of pure HrO. This is justified because(l) we had prior knowledgeofthe starting composition, and (2) final melting temperatures of oC,thus precludselectedfluid inclusions were 0.0 + 0. I ing the possibility of significant dissolved solids at low temperatures, and (3) the inclusion decrepitation problem was resolved by using the silica tubes to eliminate the pressuredifferential,indicating that negligibleamounts of expandablegaseswere present. The above considerations imply that the composition of the fluids trapped in the inclusions was essentiallypure HrO and that we can
tr29
ROMANO ET AL.: KINETICS OF QUENCHING OF FELDSPATHIC MELTS TABLE2.
Composition N?,oo NaeoKro NazoKso Na5oK$ Na3oKTo NaloK$ K,oo
1.0
Microthermometricdata from synthetic fluid inclusions
r" (oc)
I" ("c)
285-289' 272-277 273-275 263-267 285-290 302-305 312-321
450-458 427-436 429-432 412-419 450-459 483-489 504-525
K1@: orthoclase(KAISLOJ; subscripts /Vofe:Na,@: albite(NaAlSi3Os), refer to mole oercent. ' Rangesin refer to rangesof measuredhomogenizationtemperature 4 for a set of inclusions.
0.8
E o.o
b
.:O
0.4
t
0.2
0.0 1000 t (h)
predict the properties of these inclusions with data from the HrO system with high confidence.It is worth noting, however, that the successfulapplication of the present method does not require that the fluid be pure HrO but merely that its phaserelations and volumetric properties be known. Elastic volume corrections The glass containing the fluid inclusions continues to contract with reducing temperature down to room temperature. All contraction below the glass transition is, however, elastic or recoverableas is the case for crystal hosts(Scherer,1986).At the end ofthe isobaricquench, the glass is depressurized,at room temperature, to atmospheric pressure.The decompressionis also accompanied by an elastic volume change,an expansion,of the host glass.For an accurate calculation ofthe glass transition temperature from the measurementof the homogenization temperature, both of these elastic volume changesmust be corrected for. The relevant corrections are the expansion and compressionexpectedbetween Zn and T" and Pn and Pu, respectively.The expansivity and compressibility of hydrous glassesare not well known, but estimates for the liquid may be made, for example, from the study of Burnham and Davis (197l). We chose valuesof 3 x l0-' "C I and 50 GPa for the expansivity and bulk modulus, respectively. The thermal expansion and the compression effects counteract each other, and the combined correction for expansivity and compressibility results in a maximum temperature correction of + I "C. This correction has been applied to the results of Table 2. Next we discussthe main assumptionsand limitations involved in the fluid inclusion technique presented for the estimation of the glasstransition temperature in this study. Potential sourcesof error in these measurements include changesin the density ofthe inclusions after trapprng. Inclusion stabitity at room temperature Changein inclusion density might occur at room temperature, as a function of time. To evaluatethis possibility, we have tested the stability of our glassesat room temperature by measuringthe volume changeof the va-
1500
(b)
0.9
=. !-;,=-.-.--, -*. = = i:...',F --=--.
B o.B h a
9
rapid quench
0.7
0.6
0
200
400
600
800
1000 1200
r (h)
Fig. 2. Stabilityof fluid inclusionsquenchedinto hydrous glasses. sample(a)exhibitsfluid inclusions The slowlyquenched that are much lessstablethan thosein the rapidly quenched sample(b), which illustratesa very stablepopulationof inclusions.Seetext for discussion.Examplesshownare individual experiments. por bubble with time in fluid inclusions chosenfrom various samples and synthesizedunder varying conditions. A significant differencein behavior was observedfor similar samplessynthesizedusing several quench rates. Figure 2 illustrates two examplesof our investigation of the room-temperature stability of fluid inclusions. In general, samplesquenchedrelatively slowly by using compressed air (200'Clmin) were relatively unstable (Fig. 2a). For thesesamples,the density changeappearsto be inversely related to the inclusion volume being quite pronounced for inclusions smaller than 50 rrm and minor for inclusions having larger diameters (shaded area in Fig. 2a). Samplesquenchedby dropping the experimental capsule into the cold part of the vessel (200 "C/s), showed, in contrast, a high stability, and negligible density changes occurred as a function of time (-5 "C over I week: Fig. 2b). This relative instability of the slowly quenchedglasses is somewhat unexpected. One might anticipate that thermal stressesinduced during the quench would be larger at higher quench rates. This is the typical observation in glassstudies.Here, the relative instability of the slowly quenchedsamplesrequiresa different explanation.
l 130
ROMANO ET AL.: KINETICS OF QUENCHING OF FELDSPATHIC MELTS TABLE3. Glass transition temperature from dilatometry
'a
550
Composition
Cooling rate (€/minl
Ts ('C)
x 10 1 x 10 1 x 10 1 x x t0
978 976 971 939 931 924 865 855 850 820 822 818 814 806 814 814 814 815 815 820 824
I
;
soo
:
4so
K'oo K'oo K,oo
t. .l
Q
qa F\
400
350 KAtSirO8
mole fraction
NaAlSirO,
Fig. 3. Calculatedglasstransitiontemperatures of hydrous alkali feldsparmelts,isobaricallyquenched from HrO-saturated conditionsat I 100"C and2 kbar,determinedfrom the homogenizationtemperatures. Notethe strongdeviationfrom additivity attributedto the configurational entropyof mixing. One possibility is that significant transport of HrO from inclusions to glassoccurs during the slower quench. Such transport could generatea HrO-enriched (or depleted) rim around the inclusions, with the resulting possibility that differential thermal contraction betweenthe rim and glass bulk causesthermal stressesand subsequentfracturing. The fractures could then be the source of the observed instability. Although the cause of the quench-rate dependenceof this inclusion behavior has not been determined,it has beendemonstratedfor the rapidly quenchedsamplesthat changesin inclusiondensityat room temperatureare negligible for times of up to I week. Therefore, only rapidly quenched samples have been employed in the present study, and our fluid inclusion analyses,always performed within 2-3 d, of quenching, thus reflect true quenched densities. Stability during microthermometric analysis Several possible mechanisms exist that could lead to the instability of inclusions during heating in the microthermometric stage.These include two mechanisms alreadydiscussedin the fluid inclusion literature:(l) changes in density due to microfractures (leading in the extreme case to decrepitation, see below) and (2) loss of HrO through bulk or surfacediffusion, as well as the additional possibility of an elasticviscousdeformation of the host melt (not observed in crystals). All the above mechanisms lead to a rise in measured Zn as a function of time and overheating.Eachof thesemechanisms,if significant, can generateinclusions that yield reproducible but erroneously high values of Zn. We have defined somegeneralcriteria for excludingthe above phenomena:(l) constancyof the volume of the bubble before and after the first experiment (verified by optical measurementsof its diameter) and (2) consistency of Znresultson subsequent,repeated,microthermometric experiments.The first of thesetestsdemonstratesthat the first heating ofan inclusion does not result in significant
GoNa'o KsoNa,o KeoNa,o KzoNa30 K,oNa3o KToNae KsoNa5o KsoNaso KsoNa50 K5oNa5o K3oNaTo K3oNaTo K"oNaro KloNaso K, oNa"o K, oNd"o Nd,oo Nd,oo
I
x 10 1 x 10 1 x 10
Nofe: Na,oo: NaAlSi3Os,K,oo: KAlSi"O.; x : annealed(slow but unmeasuredcooling rate).
instability before the initial Zn determination is made. The second test shows that this is also the case for the subsequentanalyses.We have observed that the initial heating experiment on fluid inclusions has no measureable effect on inclusion density. Thus, significant inclusion instability below Zn, on the time scale of our microthermometricexperiments,can be ruled out. Significant heating ofthe inclusions beyond In does,however, result in density decrease(i.e., instability), illustrated by a drift to higher subsequentvalues of Zr. This instability can, however, be prevented by the careful avoidance of significant overheating. For inclusions that have not been heated more than 5 "C above ?"n,no drift in ?"ndeterminations is observed,i.e., the inclusionsbehavestably. As noted above, the extreme consequenceof microfracturing is decrepitation. This violent, permanent deformation of the glass around an inclusion occurs when the differential betweenthe internal pressurein an inclusion and the external confining pressure exceedssome threshold value. This value depends on the strength of the host material (the quenched glass)and the inclusion size. A number of studies of the decrepitation behavior of fluid inclusions in crystalline solids have been performed, but they are of questionable relevance in the presentinvestigation becausethe differential pressuresrequired to decrepitatethe presentsamplesare much lower than thosereported in the literature (Naumov et al., 1966; Leroy, 1978; Swanenberg,1980; Roedder, 1965).As an example, a pure HrO inclusion containing liquid and a vapor bubble has an internal pressure < I bar aI 25 "C. If this pure HrO inclusionwereto homogenizeat 280'C, the vapor pressure(at that temperature) would be -64 bars.Severalfluid inclusionsmeasuredin the presentstudy had homogenization temperatures near 280 "C when sealedtogether with HrO in silica tubes to eliminate the
1l3l
ROMANO ET AL.: KINETICS OF QUENCHING OF FELDSPATHIC MELTS
10
1000
e 9s0 li
0'
I
e,8
E 900 i
€ :
I
h
850
.26
P 8oo
Nao.rKo.rAlSi.O*
KAISi3OE
I
\
F$ 750
NaAlSirO,
od 94
700 KAlSi3O8
)2
I
&
molefraction
NaAlSi.O,
of dry alkalifeldspar Fig.4. Theglasstransitiontemperature Thedeviationfrom additivity at I atm pressure. meltsquenched entropyof mixing. is attributedto the configurational
differential pressure.However, fluid inclusions from these samples always decrepitated prior to liquid-vapor homogenization when they were heated without being encapsulated in silica tubes. Thus, we conclude that the upper limit for the threshold of differential pressurerequired for decrepitation is P,",) for a brief period at temperaturesas high as 200 "C. Returning to our hypothetical Th: 280 "C fluid inclusion, if it homogenizesat 280 "C in the liquid phase (by expansionof the liquid, eliminating the vapor phase), the density is 0.75 g/cm3.During continuousheatingabove 280 "C, the pressureincreasesrapidly, at about 12 bars/ 'C, along the p : 0.75 isochore. Hence even a small amount ofoverheating can yield high internal pressures. These are compensatedfor by the liquid HrO and steam sealedin the silica tube. As this internal pressureincreases, the inclusions may stretch or decrepitate.Decrepitated, empty inclusions are easily recognizableand hencedo not causeproblems of measurementaccuracy,but clearly decrepitation must be avoided for Zn measurement.
Rrsrnrs Microthermometric data from all the samples measured are presentedin Table 2 and Figure 3. The ranges in measured homogenization temperature are given for each sample.Glasstransition temperaturesfor the binary NaAlSi.Or-KAlSirO, system,calculatedfrom fluid-inclusion homogenization temperaturesusing volumetric data for pure HrO from Keenanet al. (1964)and Burnham et al. (1969),are also shown in Figure 3. The mean values of the glass transition temperature range from 515-416 "C. The KAlSi3O8 glasshas a significantly higher transition temperature than the albite glass.The HrO contents of these HrO saturatedglasses,taken from the solubility study of Romano et al. (in preparation) are reported in Table l, togetherwith the compositionsof the system. Here we emphasize that the compositions reported in Figure 3 are not truly binary, as the HrO content varies
3 "7
8
9
10
11
12
13
14
ls
to4tr(K) Fig. 5. A comparison ofviscosity data derived from the calculation schemeofShaw (1972) for higher temperatureand the glasstransition temperaturesof the hydrous melts quenched in this study using the methods of Dingwell and Webb (1990). The good agreementindicatesan Arrhenian temperaturedependence ofviscosity for the hydrous melts up to 10'gPa's.Thesedata are strong support for rhe validity of the present method for the determination of 7" (seetext).
from 6.0 wto/oin albite melt to 5.1 wto/oin orthoclasemelt. The higher glasstransition of orthoclasemelt is consistent with the higher viscosity of the dry melt, as well as the lower HrO content of the saturated melt. The composition dependenceof the glasstransition along this binary join shows a significant negative deviation from additivity. This deviation from additivity is a common feature of the transport properties of low-temperature, highly viscous, silicate melt binaries. Well-known examples of this effect are describedin particular for the caseof mixing of the alkalis under the term mixed-alkali effect (e.g., electrical conductivity: Isard, 1969; viscosity: Richet, l 984). Dry vs. wet melts: ?* We also measuredthe glasstransition temperaturesof the dry, starting-glasscompositions for comparison. The measurementswere performed by scanningpush-rod dilatometry using methods described previously (Knoche et al., 1992). The peak temperaturesof the expansivity curves yielded the glasstransition temperaturesthat are presentedin Table 3 and in Figure 4. Here again, both a higher glass transition temperature for the orthoclase composition as well as a negative deviation from additivity along the binary join are apparent.We can now see that the effect of HrO on the glasstransition temperature is enormous.The glasstransition temperaturesof the HrOsaturated glassesare 370-460 "C below those of the dry glassesof equivalent composition. (The observation that the effective quench rates for the dilatometric experiments were considerably lower than the rapid quench of the hydrothermal glassesactually increasesthe difference between the fs ofdry and wet glassesby perhaps 30-40 "C.) This is, at least in part, a reflection of the efrciency
rt32
ROMANO ET AL.: KINETICS OF QUENCHING OF FELDSPATHIC MELTS
TlaLE4. Densities(g/cm3)of glassesin the NaAlSi3OB-KAlSi3Os system
Dry Glass K,oo KsoNalo KToNa3o K50Na50 K3oNaTo KloNa$ Na,o
(+0.002)
Wet' (+0.002)
2.359 2.364 2.370 2.373 2.373 2.373 2.366
2.306 2.312 2.317 2.320 2.322 2.310 2.302
'Gfassessaturated at P: 2 kbarand f:
1100rc
2.40 _ _- -] -
D.y t - - - - - - - -a-
---- - -- -a- -- - - --_ .l ___ a
2.36 oo
Wet a
)a)
- _e-
--*-.-\
.-
Es
2.28 NaAlSirO,
mole fraction
KAISi3OE
of HrO in reducing the volume relaxation time of the Fig. 6. Densitiesofquenchedglasses measured usinga Bermelts and is completely consistentwith the drastic effect man balance.The deviationsfrom additivity can be attributed of HrO on the shearviscosity (and shearrelaxation time) entirelyto theeffectsofnonlinearvariationin theglasstransition Thesedataarea sourceof informationon the exof the melts (Shaw, 1963).The intrinsic effect of pressure temperature. pansivityof dry and wet melts(seetext). on the relaxation time of feldspathic melts is estimated to be minor, on the basis of the glasstransition measurements of Rosenhaueret al. (1979) and viscositv meaplify the task of predicting low-temperature melt viscossurementsof Kushiro (1978). ities in silicic melts. Viscosity The comparison of Figure 5 has one other conseThe quench rate during the preparation of hydrous quence. If some instability in the densities of our fluid glasseshas been estimated at 200 "C/s. Using the rela- inclusions had been a significant factor in determining tionship betweenquenchrate and effectiverelaxation time the glass transition temperature, then the resulting deavailable during the quench (Dingwell and Webb, 1990), creasein density would be marked by an increasein the togetherwith the Maxwell relation betweenviscosity and calculatedglasstransition temperature. All silicate melts shear relaxation time, we can calculatethe viscosity that indicate either constant or increasingactivation energyof correspondsto the glass transition temperature that we viscous flow with decreasingtemperature. For the incluhave determinedabove. For a quench rate of 1023"C/s sion data of Figure 3 to have yielded higher glass-tranwe obtained a relaxation time of l0-'? (using a shear sition temperature data becauseof instability and yet agree modulus of 25 GPa), and for such a relaxation time we with the estimatesfrom Shaw's(1972) method (as is the obtaineda viscosityof l0e Pa.s. The viscosityand tem- case)would require that the true glasstransition temperperature values can now be compared with the calculated atures at lower temperature yield a decreasingactivation viscosity-temperaturerelationship for eachmelt using the energy of viscous flow with decreasing temperaturemethodof Shaw(1972).We can seefrom the presentation something that has never been observed. Thus the glass of this comparison in Figure 5 that the viscosity-temper- transition temperaturesdetermined in this study, by virature relationship predicted from the method of Shaw tue of the Arrhenian agreement with high-temperature (1972), together with the value for viscosity provided by calculated viscosities yielded the lowest possible, and the glasstransition, can be fitted for each sample within therefore the true glasstransition, temperature. the errors associatedwith both using a linear regression. This meansthat the viscosity-temperaturerelationship of Expansivity the HrO-rich melts investigated in this study is ArrhenThe densitiesofbubble-free glassesquenchedfrom the ian, within error, over the investigatedrange.This result same conditions at the same rates have been determined is somewhat unexpected, as the usual consequenceof for the dry and wet joins. These data are presented in adding a depolymerizing agent to a polymerized com- Table 4 and Figure 6. The deviation from additivity is position is to make the viscosity-temperature relation- evident in both cases.If we assumea linear volume comship more strongly non-Arrhenian, that is more fragile in position relation for thesejoins and similar expansivities the senseof Angell (1984). It is possible,however, that for the glasses,and ignore, in the case of the wet melts, the viscosity range over which the comparison of Figure the slight composition dependenceof the HrO solubility, 5 is being made is not large enough or does not extend then we can estimate the expansivity of the melt from to low enough temperatureto observethe non-Arrhenian the deviation of density from additivity. To do this we behavior. Nevertheless,the indication from the present divide the deviation from additivity in the density by that comparison that the temperature dependenceof the vis- of the glasstransition temperature. The result yields valcosity of HrO-rich melts over this range of viscosity (up ues ofexpansivity, which are presentedin Figure 7. The to l0' Pa.s) is Arrhenian is a significantresult. If main- expansivity of the wet melts can be seento be higher than tained for other melt compositions, this will greatly sim- those estimated for the drv melts.
ROMANO ET AL.: KINETICS OF QUENCHING OF FELDSPATHIC MELTS
t
expansivity wet
x >. q
1
X
_1| KAlSi3Os
mole fraction
NaAlSirO,
Fig. 7. The calculatedexpansivitiesfor dry and wet melts on the albite-orthoclasejoin using the data from Figs. 3, 4, and 6 on the deviations from additivity of Q and density, together with the assumption of linear volume-composition relations on the albite-orthoclasejoin (seetext).
Coxcr,usroxs We wish to emphasize that the quantification of the thermal history of fluid inclusions quenchedinto silicate melts opens up many possibilities for the accuratedetermination of melt properties. The method is simple in principle, and the samplesare easily synthesized.We have illustrated the possibility of determining the viscosity and expansivity with the method. Further possibilities include the study of the temperature dependenceof melt structure by spectroscopicmeans. We are currently testing one example, the speciation of HrO (Romano et al., in preparation). Another possibility is the determination of isoviscousconditions for melts with varying HrO content but produced under similar conditions in equilibrium with a vapor phasediluted by COr. Yet another possibleapplication is the investigation of cooling rate dependenceof inclusion data to evaluate macroscopic exchangeof HrO between melt and vapor with cooling. Holtz et al. (in preparation) have demonstrated that the temperature dependenceof HrO solubility can be either positive or negative;thus the kinetics of inclusion-host melt exchangecould be complex. Further investigations of the behavior of inclusions during depressurization in the liquid state are also, in principle possible. Acxxowr-rcncMENTS We thank Hubert Schulzefor assistancewith samplepreparation and Detlef KrauBe for analytical assistance,as well as I-Ming Chou for discussions and material assistance.This work has been supported by the Deutsche Forschungsgemeinschaft Gerhard-Hess-Programm(Di 43 1/3-l).
Rrrnnnxcns crrED Angell, C.A. (1984) Strong and fragile liquids. In K.L. Ngai and G.B. Wright, Eds., Relaxation in complex systems,345 p. Office of Naval Research and Technical Information Service, Arlington, Virginia.
I 133
Bagdassarov,N.Sh., Dingwell, D.8., and Webb, S.L. (1993) Effectsof F, B and P on shear stress relaxation in haplogranitic melts. European Journal of Mineralogy, 3, 4O9-426. Brandriss, M.8., and Stebbins,J.F. (1988) Effect of temperature on the $ructure of silicate liquids: 29Si NMR results. Geochimica et Cosmochimica Acta. 52. 2659-2669. Bumham, C.W. (1963) Viscosity of a water-rich pegmatite.SpecialPaper Geological Society of America,76,26 p. Bumham, C.W., and Davis, N.F (1971) The role of water in silicate melts: I. P-Z-Irelations in the system NaAlSirOr-HrO to I Kilobar and I 100qC.American Joumal of Scienc.e,27O, 54-79. Burnham, C.W., Holloway, J.R., and Davis, N.F. (1969)Thermodynamic properties ofwater to l000qC and 10,000ban. The GeologicalSociety ofAmerica SpecialPaper, 132,96 P. Carron, J.-P. (1969) Vue d'ensemblesur Ia rh6ologiedes magmassilicat6s naturels. Bulletin de la Soci6t6 frangaise de Min6ralogie et de Cristallographie, 92, 435-446. Dingwell, D.B. (1990) Efects of structural relaxation on cationic tracer diffi-rsionin silicate melts. Chemical Geology, 182,209-216. -(1993) Experimental strategiesfor the investigation of low temperature properties in granitic and pegmatitic melts. Chemical Geology, 1 0 8 ,l 9 - 3 0 . Dingwell, D.8., and Webb, S.L. (1989) Structural relaxation in silicate melts and non-newtonian melt rheology in geologicprocesses.Physics and Chemistryof Minerals, 16, 508-516. -(1990) Relaxation in silicate melts. European Journal of Mineralogy,2, 427-449. Eckert, H., Yesinowski, J.P., Stolper,E.M., Stanton,T.R., and Holloway, J. (1987) The state of water in rhyolitic glasses:A deuterium NMR study. Journal of Non-Crystalline Solids, 93, 93-l | 4. Fisher. R.V., and Schminke, H.-U. (1984) Pyroclastic rocks, 472 p. Springer-Verlag,Berlin. Holtz, F., Behrens,H., Dingwell, D.8., and Taylor, R. (1992) Water solubility in aluminosilicate melts ofhaplogranitic composition at 2 kbar. Chemical Geology, 96, 289-302. Holtz, F., Dingwell, D.B., and Behrens,H. (1993) The effectsof fluorine, boron and phosphoruson the solubility ofwater in haplograniticmelts compared to natural melts Contributions to Mineralogy and Petrology, r13,502-s23. Ihinger, P. (199l) An experimental study ofthe interaction ofwater with granitic melt, 190 p Ph.D. thesis, California Institute ofTechnology, Pasadena,California. Isard, J.O. (1969) Mixed alkali effectin glass.Journal ofNon-Crystalline Solids.1.235-261. Keenan, J.H., Keyes, F.G., Hill, P.G., and Moore, J.G. (1964) Steam tables:Thermodynamic propertiesofwater including vapor, liquid and solid phases,156 p. Wiley Interscience,New York. Knoche, R., Dingwell, D.B., and Webb, S.L. (1992) Temperature-dependent themal expansivities of silicate melts: The system anorthite-diopside. Geochimica et Cosmochimica Acta, 56, 689-699. Kohn, S.C., Dupree, R., and Smith, M.E. (1989)A rnultinuclear magnetic resonancestudy ofthe structure ofhydrous albite glasses.Geochimica et CosmochimicaActa. 53. 2925-2935. Kushiro, I. (1978) Viscosity and structural changesofalbite (NaAlSi,O') melt at high pressures.Earth and PlanetaryScienceI-etters,41, 87-90. kroy, J. (1978) The Margnac and Fanay uranium deposits of the La Crouzille district (westem massivecentral, France):Geology and fluid inclusion studies.Economic Geology, 73, 16ll-1634. Martens, R.M., Rosenhauer,M., Biittner H., and von Gehlen, K. (1987) Heat capacity and kinetic parameters in the glass transformation interval of diopside, anorthite and albite glass.Chemical Geology, 62, 49-70. Mysen, B.O., and Frantz, J.D. (1992) Raman spectroscopyof siliqrte melts at magmatictemperatures:NarO-SiO,, K'O-SiOr and Li'O-SiO, binary compositions in the temperature runge 25-1475t Chemical Geology, 96,32r-332. Naumov, V.B., Balitskiy, V.S., and Khetchikov, L.N. (1966) Correlation of the temperaturesof formation, homogenization,and decrepitation ofgas-fluid inclusions. Akademiya Nauk SSSR Doklady, l7l,146148.
I 134
ROMANO ET AL.: KINETICS OF QUENCHING OF FELDSPATHIC MELTS
Richet, P. (1984) Viscosity and configurationalentropy of silicate melts. Geochimicaet CosmochimicaActa, 48, 47l-484. Richet, P., and Bottinga, Y. (1984) Anorthite, andesine,wollastonite, diopside,cordierite and pyrope: Thermodynamics ofmelting, glasstransitions, and properties of the amorphous phases.Earth and Planetary ScienceIrtters. 67. 415-432. Roedder, E. ( I 965) Liquid CO. inclusions in olivine-bearingnodulesand phenocrystsfrom basalts American Mineralogist, 50, 1746-1782. Rosenhauer,M., Scarfe,C.M., and Virgo, D. (1979) Pressuredependence ofthe glasstransition in glassesofdiopside, albite and sodium trisilicate composition. CarnegieInstitution of Washington Year Book, 78, 5 5 6 - s5 9 . Sabatier,G. (1956) Influence de la teneur en eau sur la viscosit6 d'une r6tinite, verres ayant la composition chimique d'un granite. Comptes Rendus. 242. 1340-1342. Scherer,G.W. (1986) Relaxation in glassand composites,331 p. Wiley, New York. Shaw, H.R. (1963) Obsidian-H,O viscosities at 1000 and 2000 bars in the temperaturerange700 to 900eC.Joumal ofGeophysical Research, 68,6337-6343. Shaw, H.R. (1972) Viscositiesof magmatic silicate liquids: An empirical method of prediction. American Journal of Science,272, 870-889. Silver, L., and Stolper, E.M. (19E5)A thermodynamic model for hydrous silicate melts. Journal of Geology, 93, | 6 | - 17E. ( I 989) Water in albitic gass. Journal of Petrology,30, 667-7 O9. Silver, L., Ihinger, P.D., and Stolper, E.M. (1990) The influence of bulk composition on the speciationofwater in silicateglasses.Contributions to Mineralogy and Petrology, lO4,142-162. Spera,F.J., Borgia,A., Strimple,J., and Feigenson,M. (1981)Rheology of melts and magmatic suspensions:I. Design and calibration of concentric cylinder viscometer with application to rhyolitic magma Journal of GeophysicalResearch,93, 10273-10294. Stolper,E.M (l 982a) The speciationof water in silicate melts. Geochimica et Cosmochimica Acta, 46,2609-2620.
-
(l 982b) Water in silicate glasses:An infrared spectroscopicstudy. Contributions to Mineralogy and Petrology, 81, l-17. -(1989) Temperature dependenceof the speciation of water in rhyolitic melts and elasses.American Mineralogist, 74, 1247-1257. Swanenberg,H.E.C (1980) Fluid inclusions in high-grademetamorphic rocks frorn S.W. Norway. Geologica ultraiectina Univ Utrecht,zs, 147 p. Taniguchi, H. (1981) Effectsofwater on the Slasstransition temperature of rhyolitic melt. Journal of the JapaneseAssociation of Mineralogy, Petrologyand Geochemistry, 76, 49-57 Tool, A.Q., and Eichlin, C.G (1931) Variations caused in the heating curves of glass by heat treatment. Journal of the American Ceramic Society,14,276-308 Watson, E.B. (1981) Diffi:sion in magmasat depth in the earth: The effects of pressureand dissolved water. Earth and Planetary ScienceIrtters, 52,29t-30t. Webb, S.L. (1992) Shear, volume, enthalpy and structural relaxation in silicate melts. Chemical Geology, 96, 449-457 . Webb, S.L., and Dingwell, D.B. (1990a)The onsetof non-newtonianrheology ofsilicate melts: A fiber elongationstudy. Physicsand Chemistry of Minerals. 17. 125-132. (1990b) Non-neMonian rheology of igneousmelts at high stresses and strain rates:Experimental resultsfor rhyolite, andesite,basalt, and nephelinite.Journal of GeophysicalResearch,95, 695-70 l. Webb, S.L., Knoche, R., and Dingwell, D.B. (1992) Determination of silicate liquid thermal expansivity using dilatometry and calorimetry. EuropeanJournal of Mineralogy, 4, 9 5-1O4. Werre,R.W, Jr, Bodnar,R.J.,Bethke,P.M., and Barton,P.B.,Jr. (1979) A novel gas-flowfluid inclusion heating/freezingstage.Geological Society of America Abstracts with Programs, I l, 539. Zhang,Y, Stolper, E.M., and Wasserburg,G.J. (1990) Diffi.rsionof water in rhyolitic glasses.Geochimica et CosmochimicaActa, 55, 441-456. Nowusen 16, 1993 Mnm-rscrrrr REcETVED MeNuscrrm ACcEPTED Jvtv 8, 1994