Supplementary Information for
High transition frequencies of dynamic functional connectivity states in the creative brain
Junchao Li1a, Delong Zhang1a, Aiying Liang2, Bishan Liang3, Zengjian Wang1, Yuxuan Cai1, Mengxia Gao1, Zhenni Gao1, Song Chang1, Bingqing Jiao1, Ruiwang Huang1*, Ming Liu1* 1 Center
for the Study of Applied Psychology, Key Laboratory of Mental Health and Cognitive Science of Guangdong Province, School of Psychology, South China Normal University, Guangzhou, China 2 Guangdong Science Center, Guangzhou, China 3 College of Education, Guangdong Polytechnic Normal University
a
These authors contributed equally to this work.
﹡Correspondence to: Ruiwang Huang, PhD Center for the Study of Applied Psychology Key Laboratory of Mental Health and Cognitive Science of Guangdong Province School of Psychology, South China Normal University, Guangzhou 510631, China, E-mail:
[email protected] (RH); or Ming Liu, PhD Center for the Study of Applied Psychology, Key Laboratory of Mental Health and Cognitive Science of Guangdong Province School of Psychology, South China Normal University, Guangzhou 510631, China, E-mail:
[email protected] (ML)
Supplementary Information
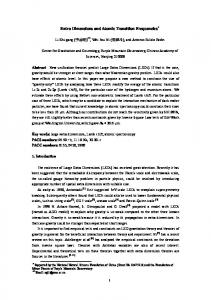
1. Torrance Test of Creative Thinking (TTCT) The creativity performance of each subject was measured using the figural version of Torrance Test of Creative Thinking (TTCT-Figural) (Torrance 1966). The TTCT-Figural measured fluency, originality, flexibility and elaboration, which were based on Guilford’s divergent-thinking factors (Guilford, 1959; Torrance, 1996). The TTCT-Figural comprises three parts: picture construction (SI Fig. 1a), picture completion (SI Fig. 1b), and repeated figures of lines (SI Fig. 1c). In picture construction task, the subjects were asked to construct a creative picture that told a story based on a circle. In picture completion part, the subjects needed to complete 10 different lines to novel and interesting pictures. In repeated figures of lines part, subjects were asked to construct novel and meaningful pictures based on 10 pairs of parallel lines. Each part should be finished in ten minus.
SI Fig. 1. Samples of the figural version of Torrance Test of Creative Thinking
The creativity scores are determined based on four measures: • Fluency: The number of relevant ideas; shows an ability to produce a number of figural images. • Originality: The number of statistically infrequent ideas; shows an ability to produce uncommon or unique responses. The scoring procedure counts the most common responses as 0 and all other legitimate responses as 1. The originality lists have been prepared for each item on the basis of normative data, which are readily memorized by scorers. • Elaboration: The number of added ideas; demonstrates the subject’s ability to develop and elaborate on ideas. • Flexibility: scored by the variety of categories of relevant responses
2. Number of dynamic FC states To validate the robust of our results, we performed exploratory analyses of k of 3 and 5. We obtained similar results that high creativity group (HCG) has more frequent transition among dynamic functional connectivity (dFC) states than low creativity group (LCG). Specifically, for k = 3, χ2(2, N=44) = 8.44, p = 0.02, post hoc analysis revealed that HCG had more frequent transition between dFC state 1 and state 2 than LCG; for k = 5, χ2(9, N=44) = 24.59, p < 0.01, post hoc analysis revealed that HCG had more frequent transition between dFC state 4 and state 5 than LCG. 3. Validation using Multiplication of Temporal Derivatives To improve the confidence of our results, we performed a confirmatory analysis using ‘Multiplication of Temporal Derivatives’. The MTD has been shown to be more sensitive than sliding window correlation methods in detecting dynamic alterations in connectivity structure and less susceptible to spurious connectivity, such as global mean signal fluctuations and head motion. The MTD estimated similar changes over time, specifically a positive value implies time series couple in the same direction (either both increasing or both decreasing), however negative value represents anticoupling (one increasing while the other is decreasing). The value of the MTD can be interpretable as a signed and weighted adjacency matrix with each temporal window. To avoid the influence of high-frequency noise, we averaged MTD over a temporal window. Briefly, the MTD for the pairwise interaction between region i and j is defined according the following equation: 1
(𝑑𝑡𝑖𝑡 ×𝑑𝑡𝑖𝑗 )
𝑀𝑇𝐷𝑖𝑗𝑡 = 𝑤 ∑𝑡+𝑤 𝑡 (𝜎
𝑑𝑡𝑖
×𝜎𝑑𝑡𝑗 )
(S1)
Where dt is the first temporal derivative of the ith or jth time series, σ is the stand deviation od the temporal derivative time series for region i or j, and w is the window length of the simple moving average. Given that we used a 0.15-Hz low-pass filter, all signals with periods of 15 seconds or shorter would be removed from the data in theory. Therefore, we used a temporal window with window length of 15 time points to calculate the moving average of the
MTD. The MTD can provide an estimation of time-varying functional connectivity. We calculated the spatial similarity of the adjacency matrix across all time points and subjects by using spatial Pearson’s correlations. We further applied the K-means cluster algorithm (k = 4) to assigned each time point of each subject a cluster index. Statistical analysis was performed to validate whether the HCG has more frequent dFC states transition.
4. Abbreviation list Brain networks AUN: auditory network CBN: cerebellar network CCN: cognitive control network SMN: somatomotor network DMN: default-mode network VSN: visual network SCN: subcortical network STG: superior temporal gyrus MTG: middle temporal gyrus Crus: cerebral crus Cereb: cerebral IFG: inferior frontal gyrus PHG: hippocampus gyrus MCC: middle cingulate cortex PCC: posterior cingulate cortex ACC: anterior cingulate cortex AG: angular gyrus aInsula: anterior insular cortex pInsula: posterior insular cortex MiFG: middle frontal gyrus PreCG: precentral gyrus ProCG: postcentral gyrus SMG: supra-marginal gyrus SMA: supplementary motor area IOC: inferior occipital cortex MOG: middle occipital cortex FFG: fusiform gyrus Lingual: lingual gyrus
Other dFC: dynamic functional connectivity TTCT: Torrance Tests of Creative Thinking R-fMRI : resting-state fMRI HCG: high creativity group LCG: low creativity group ICG: independent component analysis FC: functional connectivity fMRI: functional magnetic resonance imaging PCA: principal component analysis ICN: intrinsic connectivity
5. Supplementary table
Supplementary Table 1. Peak Coordinates of ICNs Peak ICN regions
BA
tmax
x
y
z
R superior temporal gyrus
41
22.26
48
-27
115
L superior temporal gyrus
41
18.32
-48
-33
15
21
15.99
-60
-54
18
20.43
-33
-81
-36
18
14.77
15
-81
-15
19
16.24
21
-84
-18
21.03
9
-54
-39
16.52
-15
-27
-21
Auditory networks STG(18)
MTG(45) L middle temporal gyrus Cerebellar networks Crus2(70) L cerebelum crus2 Cereb6(23) R cerebelum 6 Crus1(24) R cerebelum crus1 Cereb9(36) R cerebelum 9 Cereb4_5(7) L cerebelum 4/5 Cognitive control networks STG+IFG(21) R middle temporal gyrus
22
22.78
63
-42
9
R inferior frontal gyrus
47
11.74
48
33
-3
35
18.56
-24
-12
-15
23
23.81
0
-30
30
L rolandic oper
48
16.37
-57
3
6
R rolandic oper
48
12.38
60
3
6
L anterior insula
47
19.91
-30
24
-3
R anterior insula
47
19.91
36
21
-3
L inferior frontal gyrus
38
21.07
-45
21
-12
R inferior frontal gyrus
45
13.09
54
27
3
PHG(29) L hippocampus gyrus MCC(21) R middle cingulum gyrus Rolandic(55)
aInsula(52)
IFG(62)
(Supplementary Table 2 continued)
Peak ICN regions
BA
tmax
x
y
z
24
21.03
-3
18
39
R inferior parietal gyrus
40
22.68
54
-36
51
L inferior patietal gyrus
40
17.19
-51
-42
54
R middle frontal gyrus
46
18.77
30
54
24
L middle frontal gyrus
46
14.97
-30
48
27
13
-42
3
-3
R precentral gyrus
43
20.21
57
-6
27
L precentral gyrus
44
21.47
-45
12
33
3
19.85
42
-30
54
R supraMarginal
48
18.38
63
-27
23
L supraMarginal
40
13.68
-63
-33
30
R postcentral gyrus
3
19.77
51
-24
42
L supraMarginal
1
17.58
-60
-27
39
L precentral gyrus
6
12.12
-54
6
30
6
21.59
-3
-9
51
6
20.9
3
-18
57
R superior parietal gyrus
7
22.27
21
-69
54
L superior parietal gyrus
7
15.01
-18
-69
48
6
20.58
3
-30
63
3
19
-42
-33
54
SFG(78) superior frontal gyrus IPG(96)
MiFG(13)
pInsula(11) posterior insula Somatomotor networks PreCG(1)
R ProCG(4) R postcentral gyrus SupraMariginal(65)
PoCG(71)
L SMA(92) L supplementary motor area R SMA(93) R supplementary motor area SPL(47)
ParaCL(27) R paracentral lobule L ProCG(8) L postcentral gyrus
Peak ICN regions
BA
tmax
x
y
z
L posterior cingulum
26
27.94
-3
-45
27
L medial frontal gyrus
11
16.42
-3
51
-9
23.77
-6
-57
57
11
22.15
-6
39
-3
R angular
19
21.2
42
-72
39
L middle occipital gyrus
19
19.73
-42
-78
33
L angular
39
23.63
-48
-66
30
L middle cingulum
23
11.78
-3
-42
39
R middle frontal gyrus
8
17.53
27
27
48
L middle frontal gyrus
8
20.79
-21
30
51
R middle cingulum gyrus
31
7.72
3
-33
39
7
23.81
3
-54
42
17
24.09
6
-81
6
17
24.9
-15
-63
9
19
20.07
6
-84
33
L inferior occipital cortex
18
16.5
-21
-90
-9
R inferior occipital cortex
18
16.28
24
-93
-3
L middle occipital gyrus
18
17.25
-24
-93
12
R middle occipital gyrus
18
18.76
30
-84
21
18
17.72
15
-69
-9
R fusiform
37
14
39
-60
-15
L inferior occipital fyrus
19
16.03
-45
-72
-18
24.77
-24
6
3
20.58
6
-21
3
Default mode networks PCC(50)
L Precuneus(51) ACC(20) L anterior cingulum R AG(32)
L AG(40)
MiFG+Cingulum(54)
R Precuneus(95) R precuneus Visual networks R Calcarine(10) R calcarine L Calcarine(12) L calcarine Cuneus(14) R cuneus IOC(39)
MOG(49)
Lingual(68) R lingual FFG(74)
Subcortical networks Putamen(19) L putamen Thalamus(42) R thalamus