152
IEEE TRANSACTIONS ON BIOMEDICAL ENGINEERING, VOL. 49, NO. 2, FEBRUARY 2002
Higher Order Statistics and Neural Network for Tremor Recognition Jacek Jakubowski, Krzystof Kwiatos, Augustyn Chwaleba, and Stanislaw Osowski
Abstract—This paper is concerned with the tremor characterization for the purpose of recognition. Three different types of tremor are considered in this paper: the parkinsonian, essential, and physiological. It has been proven that standard second-order statistical description of tremor is not sufficient to distinguish between these three types. Higher order polyspectra based on third- and fourth-order cumulants have been proposed as the additional characterization of the tremor time series. The set of 30 quantities based on the polyspectra has been proposed and investigated as the features for the recognition of tremor. The neural network of the multilayer perceptron structure has been used as a classifier. The results of numerical experiments have proven high efficiency of the proposed approach. The average error of recognition of three types of tremor did not exceed 3%. Index Terms—Higher order statistics, neural networks, tremor recognition.
I. INTRODUCTION
T
REMOR is a phenomenon observable at either healthy population or at the people of pathological changes. Tremor time series belong to the stochastic signals. This is motivated by the idea, that the mechanism of generating them is so complex and exposed to so many uncontrollable influences, that mathematical equations describing them ought to contain random quantities [1], [2]. Although the recorded time series of the tremor (the particular realization of the stochastic process) look different, random variables are not completely arbitrary but are characterized by a distribution of the characteristic features determining the kind of external influence. Three main classes of tremor are the most important: the physiological, essential, and parkinsonian [1]–[3]. It was found that the time series from person with physiological tremor could be often recognized as the realization of the linear stochastic process. On the other hand the time series of parkinsonian patients can be identified as signals of nonlinear chaotic nature. The essential tremor occupies the position in the middle between the two extremes, the physiological and parkinsonian tremor [3]. Discovering the character of the tremor of the patient in very early stage is an important task, since it enables the proper medical treatment of him. Unfortunately, up to now there is a lack of Manuscript received February 1, 2001; revised October 9, 2001. Asterisk indicates corresponding author. J. Jakubowski, K. Kwiatos and A. Chwaleba are with the Institute of Fundamental Electronics, Military University of Technology, 00-661 Warsaw, Poland. *S. Osowski is with the Institute of the Theory of Electrical Engineering and Electrical Measurements, Warsaw University of Technology and with the Institute of Fundamental Electronics, Military University of Technology, 00-661 Warsaw, Poland (e-mail:
[email protected]). Publisher Item Identifier S 0018-9294(02)00644-4.
the objective automatic methods for the recognition and classification of different types of tremor. This is due to the similarity of their symptoms and great difficulties to find proper discriminative characterizations of the tremor time series. This paper will describe the method of the recognition of tremor time series. It is based on the higher order statistics and neural networks. It will be shown that the features of the process, based on the application of cumulants and polyspectra, represent different types of tremor very well and may stand as the basis for the recognition among them. The results of numerical experiments will be presented and discussed. II. TREMOR TIME SERIES ACQUISITION PROCESSING
AND INITIAL
The tremor time series measurement has been performed using the accelerometers of Bruel&Kjaer, fixed to the fingers of the patients. The accelerometer is the sensor, whose output signal is proportional to the acceleration value (the derivative of the speed) and reacts to the changes of the speed of the patient’s finger movement. The exact model of such device can be found in many textbooks, for example in [4]. The signals registered by the accelerometers are amplified, filtered and then converted to the digital form in the analog-to-digital (A/D) converter with a sampling frequency of 100 Hz [5]. One registered record covers 8192 samples corresponding to 80s of observation. All records are sent to the computer and then subject to further processing. Short time Fourier transform (STFT) applied to the tremor signals of parkinsonian patients reveals the nonstationarity in the long period observation. The tremor has irregular amplitude and frequency changing with time. It may disappear abruptly and appear again. To get more stable information on the nature of the signals the shorter observation periods of 10 s have been selected on the basis of the results of STFT. The selected periods should be characterized by the small variance of the power spectral density, so these signals might be regarded as stationary in the wide sense. In practice, the selection of such segments has been done by analyzing the succeeding 10s periods and choosing those satisfying the condition of small variance of power spectral density. However, the recognition of the type of the tremor on the basis of the results of the Fourier analysis is inefficient, since the power spectral density characterization is changing in a wide range. The peak value of the power spectral density as well as the frequency of its occurrence, although important in recognition process, in some cases cover similar ranges of values for parkinsonian, essential, and physiological tremor. Additionally, they depend on the level of advancement of the neurological
0018–9294/02$17.00 © 2002 IEEE
JAKUBOWSKI et al.: HIGHER ORDER STATISTICS AND NEURAL NETWORK FOR TREMOR RECOGNITION
153
illness. Hence, they may be treated as the important but not sufficient description of the process. It will be shown that the main reason for the inefficiency of the second-order representation of tremor is the fact, that the parkinsonian and essential tremor distributions are generally non-Gaussian. It means that the second-order information is not sufficient to describe them. Higher order measures are needed to represent their character. The cumulants of the order up to four and appropriate polyspectra have been applied to get better characterization of the tremor. (4) III. HIGHER ORDER STATISTICS FOR DESCRIPTION OF TREMOR A. Basic Definitions and Properties Dealing with non-Gaussian random processes, the notions of higher order moments, cumulants, and their polyspectra called higher order statistics are of paramount importance in statistical signal processing. Apart from many other advantages higher order statistics improve signal-to-noise ratio when dealing with Gaussian additive noise and, thanks to this, enable to define more representative features of the statistical process. be a real, discrete time and th-order stationary Let and random process. Moreover, let . Then the th-order mo, is defined as the coeffiment of cient in the Taylor expansion of the moment generating function
With zero-mean assumption, the second- and third-order cumulants are the same as the second- and third-order moments respectively. Thus, for the simplification of estimates, if the process has nonzero mean, the mean should be subtracted from it first. However, to generate the fourth-order cumulant we need knowledge of the fourth-order and second-order moments. In practice, because of unique linear property of the second characteristic function working with cumulants instead of moments is more common and preferable in the case of stochastic signals. Thus, the higher order spectra are usually defined in terms of th-order cumulants as their ( 1)-dimensional Fourier transforms
(1) In practice, the th-order moment can be equivalently calculated 1) by taking an expectation over the process multiplied by ( lagged versions of itself [6]–[8]
(5) Nevertheless, again in practice they can be equivalently estimated by statistical averaging of the Fourier amplitudes whose sum frequency vanishes [9], [10]. For example third-order spectrum can be expressed as (6)
(2) Similarly, the coefficients in the Taylor expansion of the cumulant generating function, also known as the second characteristic function (3) cumulants of , denoted by . Combining (1) and (3) it is obvious that cumulants can be expressed in terms of moments and vice versa. Thanks to that one can easily calculate cumulants as certain nonlinear combinations of moments. The second-, third- and fourth-order cumuare [8] lants of
are
th-order
Observe that higher order spectra can be expressed through the lower order terms, especially second-order ones. This is the nonlinear relation of the polynomial type. Inclusion of such description into the set of features enhances the information of the process. Thanks to this at the same input data we have better understanding of the process and easier recognition among different types of signals. 2), bispecThe special cases of (5) are power spectrum ( 3) and trispectrum ( 4). We will denote them trum ( , and , respecpower spectral density (PSD), tively. Only PSD is real, the others are complex. Besides, one of the most useful functions used for the detection and characterization of nonlinearity in time series is the coherence function. Here, we limit ourselves only to the third-order bicoherence function, defined as follows: (7) The bicoherence function may be regarded as the normalized polyspectrum of third-order and is also the complex function.
154
IEEE TRANSACTIONS ON BIOMEDICAL ENGINEERING, VOL. 49, NO. 2, FEBRUARY 2002
The general motivation behind the use of cumulants and higher order spectra in this paper is twofold. First, the goal is to suppress certain kinds of noise processes be they colored or 2 equal zero for Gaussian white. All the statistics of order signals, additionally third-order ones equal zero for signals with symmetric probability density functions [8]. Second, it is often required to identify magnitude and phase of a linear system operating under random non-Gaussian input. The second-order statistics are “phase-blind” whereas higher order statistic measures preserve true phase information [11]. In spite of the mentioned above properties of higher order statistics, in this paper we will rely directly only on the magnitude characteristics. After close examinations of the phase changes as possible features for tremor recognition, we have come to the conclusion, that phase characteristics of higher order statistics are not representative for such task, since it does not possess the discriminative properties for different types of tremor. Nevertheless, the magnitude characteristics are still formed by phase couplings in data [7]–[10].
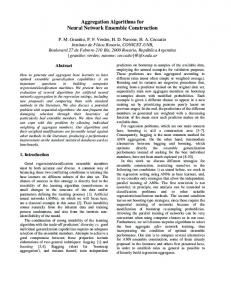
Fig. 1. Empirical cumulative PFA distributions of the test for gaussianity from Hinich of parkinsonian (thick line), essential (dotted line), and physiological (thin line) tremor.
B. Higher Order Statistics for Tremor Characterization One of the most important problems of tremor characterization is the decision whether the process is Gaussian and linear. Gaussianity means that the second-order description would be sufficient. Linearity may simplify the representation of the signals, since the linear process can be described by , where is assumed to be independent identically distributed (i.i.d.). Hinich test for checking the nonskewness and linearity of the process has been applied [12]. The basic idea behind the test is that if the third-order cumulant of the process is zero, then the bispectrum and its bicoherence are also zero. If the bispectrum is not zero then the process is non-Gaussian. In the case of a non-Gaussian and linear process, the bicoherence is a nonzero constant. In practice the so-called “probability of false alarm” (PFA), that is the probability that we will be wrong in assuming that the data have a nonzero bispectrum has been implemented to test the Gaussianity. If this probability is small, reject the assumption of zero bispectrum and reject also the assumption of the Gaussianity of the process. Fig. 1 presents the distribution of the empirical estimation of PFA for parkinsonian, essential, and physiological tremors, registered for all patients belonging to these three groups. 5 we find that 98% of the parkinsonian proAt cesses are non-Gaussian. At the same time, 70% of the essential and 60% of the physiological tremor are also non-Gaussian. The results confirm that the majority of tremor processes are non-Gaussian, thus limiting their descriptions to only secondorder characteristics is not sufficient. Higher order statistics are needed to describe them more accurately and distinctively. In the case of non-Gaussian data, the linearity test, checking and whether the squared bicoherence is constant for all will reveal the eventual linearity of the process. In practice the optimal bicoherence is not flat. The estimation of the constant value can be obtained by computing the mean value of the bicoherence over the points in the nonredundant region. The squared bicoherence is chi-squared distributed
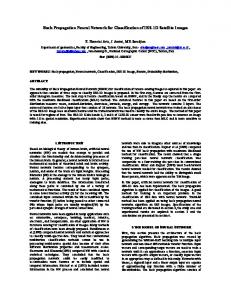
Fig. 2. The percentage of empirical data recognized as the nonlinear statistical process versus quantity a (thick line—parkinsonian, dotted line—essential, and thin line—physiological tremor).
with two degrees of freedom and noncentrality parameter . The sample interquartile range of the squared bicoherence is estimated and compared with the theoretical interquartile range of chi-squared distribution. If the estimated interquartile range is much larger or much smaller than the theoretical value, the linearity hypothesis should be rejected. Testing for linearity of the non-Gaussian processes, we have introduced the coefficient as the ratio of the empirical to theoretical sample interquartile ranges. Fig. 2 presents the perand 1 versus quantity centage of data, for which . 1.5, i.e., when the criterion 2 3 and At the level of 3 2 is satisfied, the percentage of the nonlinear processes is, respectively, 80% (parkinsonian), 70% (essential), and 55% 2, i.e., 2 and 0.5, (physiological). However, at only 35% of all cases is nonlinear, practically irrespective of the type of tremor. As it is seen from these results the linearity test is evidently not explicit. Therefore there were no reasons to apply any method specific only for the nonlinear process. Thus, we have limited ourselves to the ordinary higher order statistics description of the times series. The cumulants of the third- and fourth-order as well as their polyspectra have been generated
JAKUBOWSKI et al.: HIGHER ORDER STATISTICS AND NEURAL NETWORK FOR TREMOR RECOGNITION
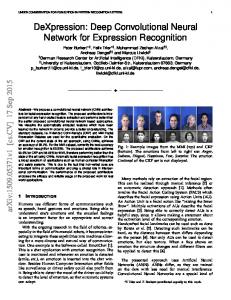
Fig. 3. The distribution of the module of the bispectrum for (a) parkinsonian, (b) essential, and (c) physiological tremor for one subject representative for each group.
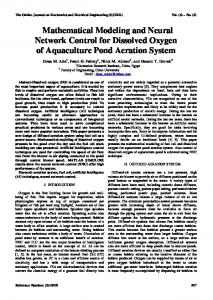
and studied. They have brought new insight at the features of the process of tremor generation [13]. Fig. 3 presents the exemplary distribution of the absolute values of the bispectrum versus and for the parkinsonian [Fig. 3(a)], essential [Fig. 3(b)], and physiological [Fig. 3(c)] types of tremor for one chosen patient of each group. The subjects from each group have been selected by neurologists as the most representative cases from the medical point of view. The differences between characteristics are well visible. In the case of parkinsonian we see very sharp peaks on the background of the noise of very low (invisible) level. The essential and physiological tremors are of smaller magnitudes and their frequency distributions of the bispectrum seem to be noisy. To have better view on the frequency feedback between and in the bispectrum we have developed the next description in the form of the diagonal of the absolute values of the bis. Fig. 4 presents this relationship versus frepectrum , for parkinsonian [Fig. 4(a)], essential quency , [Fig. 4(b)], and physiological [Fig. 4(c)] tremors, corresponding to Fig. 3. In the case of parkinsonian, we observe very sharp peaks of the energy concentrated in one narrow range of frequencies. The essential and physiological tremors are characterized by much smaller energy distributed in the wider range of frequencies. Similar character of the relationships can be observed for the trispectrum. Fig. 5 presents the graph of the absolute value of versus frequency , the diagonal part of trispectrum for parkinsonian [Fig. 5(a)], essential where [Fig. 5(b)], and physiological [Fig. 5(c)] tremors, once again for one representative subject of each group. We see important differences of the heights and frequencies of the peaks among the characteristics for different types of tremor. The above one-diagonal measures underlie the information concerning the phase couplings of harmonics at integer multiplies of the fundamental one. Such information is based indeed on classical Fourier transforms, however, requires non-
155
Fig. 4. The distribution of the module of the diagonal of the bispectrum for (a) parkinsonian, (b) essential, and (c) physiological tremor for one subject representative for each group.
Fig. 5. The distribution of the module of the diagonal of the trispectrum for (a) parkinsonian, (b) essential, and (c) physiological tremor for one subject representative for each group.
linear combination of them, creating a useful higher order statistics measure. IV. FEATURE EXTRACTION The higher order statistics description of tremor delivers new features for the characterization of it and the recognition of its type. After careful examination of the different statistical characteristics, the following features have been considered as the most important and distinctive for tremor recognition. . 1) Peak frequency of the PSD, 2) Peak values of the PSD, diagonal bispectrum and diagonal trispectrum. 3) The spectral moments defined on the basis of the normalized in such a way that polyspectra
156
IEEE TRANSACTIONS ON BIOMEDICAL ENGINEERING, VOL. 49, NO. 2, FEBRUARY 2002
The following spectral moments have been considered as the features:
TABLE I THE SET OF COEFFICIENTS FOR 30 SELECTED FEATURES OF PARKINSONIAN, ESSENTIAL AND PHYSIOLOGICAL TREMORS
4) The number of samples of the normalized spectrum
whose values are higher than some percentage of the . We denote this feature as . 5) The sum of values of all samples of the polyspectrum
6) The normalized sum of values of all samples of the polyspectrum defined as
If the features are associated with two-dimensional functions for them have been taken here as the sucthen the values ceeding entries of the corresponding matrices. The presented set of possible features is very rich since any higher order polyspectrum can be regarded as the potential variable for . To find the most representative set of the features of each class the following measure for the ability to discriminate among them has been defined as (8) and are the mean values of the feature where in the class and , respectively, while and represent the appropriate standard deviations of both classes. corresponds to large difference in High value of and mean values of the feature realizations in class and small variances inside both of them. This enables high discrimination ability of the feature . At the assumption that all realizations of the feature are in the range ( ) and ( ) the condition 1 means perfect separation of the class from class by the feature . In the tremor recognition we have considered three classes: the parkinsonian, essential, and physiological, so we can define
three different sets of for recognition between parkinfor parkinsonian and essensonian and physiological, for essential and physiological tremors. Table I tial, and for 30 selected presents the values of features, generated on the basis of various-order polyspectra for the whole population of subjects, taking part in experiments. The PSD alone has been estimated by classical approach ) as well as by based on Welch periodogram method ( taking into account the diagonal slice of the fourth-order ) [7], [8]. As it is seen from cumulant of the process ( these results it has provided 13 features of different ability to discriminate between two given classes. The most representative for the tremor seems to be the feature No 6, defined . All three coefficients for this feature as , and are much higher than 1, which means that this feature is a good basis for recognition among all classes. On the other hand the feature No 22 has very high and but rather low value for , values for hence it would be inefficient for the recognition between
JAKUBOWSKI et al.: HIGHER ORDER STATISTICS AND NEURAL NETWORK FOR TREMOR RECOGNITION
physiological and essential tremors. However, it was included into the set of features to support the recognition between parkinsonian—physiological and parkinsonian—essential tremors. V. NEURAL CLASSIFIER The multilayer feedforward network, often called also multilayer perceptron (MLP) [14] has been used as the neural classifier of the signals. The network is composed of many neurons arranged in layers. The number of hidden layers may be different, but in most cases only one hidden layer is sufficient. The synaptic connections in the network exist only among neurons of two succeeding layers and the flow of the signals is feedforward. All neurons in hidden and output layers are characterized by the sigmoidal activation functions
The net signal of th neuron in the network is the weighted sum of the signals incoming to this neuron
where the weights are associated with the links connecting are actuthe nodes and (from to ). Since the weights ally internal parameters forming vector , associated with the neurons, changing these weights will alter the activity of this neuron and in turn of the whole MLP network. It was found that MLP network is capable to approximate any multidimensional data with arbitrary accuracy [15]. To achieve this we have to adapt the weights in such a way that the error measure for all training input-output pairs is minimized output neurons and training pairs ( , (learning phase). At ), where is the input vector, —the destination vector and —the vector of actual output signals, the error function under minimization is usually defined using the Euclidean norm as follows: (9) where the index is referred to the th training pattern. The training procedures of the MLP applying gradient methods use so called backpropagation of the error and optimization methods to minimize the error function [13]–[15]. After finishing training, the weights are frozen and ready for use in the retrieval mode, in which the vector put to the input of the MLP network generates the vector composed of the activities of neurons in the output layer, pointing to the membership of the input feature vector to the appropriate class. The most important feature of the MLP is its generalization ability. As has been proved in [14] and [15], to acquire this ability, the network should possess as low number of weights as needed to reduce the error function to the appropriate low level and at the same time the number of learning samples should
157
be as high as possible. Such organization of learning will result in statistical processing of the signals and force the network to learn the statistical characteristics of the data rather than the individual learning patterns. This is the key idea of generalization. The MLP network used as a classifier should generate only two kinds of signals: one signal of unity value indicating the membership of the data to the particular class and the other signals equal or close to zero. Thus, the destination vector used in learning contains only one element of unity value indicating the appropriate class and the rest of zeros. VI. THE RESULTS OF NUMERICAL EXPERIMENTS The set of features generated at the realizations of the parkinsonian, essential, and physiological tremor processes at many different patients has been used as the input vector to the neural network classifier of the MLP structure. The initial dimension of the input vector is equal to the number of generated features. The number of output neurons was set to three, i.e., the number of classes under recognition. Each class is represented by the unity value signal of the output neuron. The parkinsonian 100, tremor was associated with the destination vector 0 1 0 , and the essential one the physiological tremor with [0 0 1]. One hidden layer of sigmoidal neurons has with been applied in the network. The number of hidden neurons has been adjusted experimentally to obtain the best generalization ability, that is the highest efficiency of recognition in the retrieval mode. Too high number of hidden neurons results in bad generalization of the network, while too low number makes the learning process inefficient and terminates it on too high level of error. We have adjusted this number experimentally by learning different networks and choosing the smallest number of hidden neurons, sufficient to reduce error function to the satisfactorily small level. All data characterizing the parkinsonian, essential, and physiological tremors have been split into learning and testing parts. 409 experimental patterns obtained at the investigation of the patients of the neurological center have been used in training and further 174 patterns only in testing mode. Among these 409 cases, there were 239 physiological, 70 essential, and 100 parkinsonian. Due to the limited availability of parkinsonian and essential cases the number of patterns of different types of tremor were not equal. Splitting the original data set into learning and testing subsets we tried to keep the appropriate proportions among them. So for the testing task we have used 100 physiological, 35 essential, and 39 parkinsonian cases. To find the most representative features for the recognition of tremor, four different sets of features have been checked: containing only two first features 1) the first input vector estimated with mentioned in Table I, describing the the use of Welch’s method (the maximum value of PSD and its frequency); containing all features based 2) the second input vector description (features from 1 to 9 in only on the Table I); containing only the higher order 3) the third input vector (the features from 10 to 30 of statistics, excluding Table I);
158
IEEE TRANSACTIONS ON BIOMEDICAL ENGINEERING, VOL. 49, NO. 2, FEBRUARY 2002
TABLE II THE OVERALL RELATIVE ERRORS OF RECOGNITION OF PARKINSONIAN, ESSENTIAL AND PHYSIOLOGICAL TREMOR OBTAINED BY THE NEURAL CLASSIFIER AT DIFFERENT INPUT VECTORS
THE
Fig. 6. The classification errors of the MLP classifier at different number of hidden neurons for 4 sets of features.
4) the fourth input vector containing all 30 features of Table I. It should be observed that the set 3, containing the features corresponding to higher order statistics relies also, although not directly, on the second-order terms. This is evident from the relationships between the higher order and lower order spectra [for example, (6)]. The MLP networks of different number of input nodes corresponding to these four feature vectors have been trained using second-order Broyden–Fletcher–Goldfarb–Shanno variable metric procedure [16] and backpropagation for generation of gradient vector. To find out the best network structure different numbers of hidden neurons have been used in training. All trained networks have been tested on the testing data, not taking part in training. The network of the smallest possible number of hidden neurons, providing the smallest value of the testing error has been selected as the optimal one. Fig. 6 presents the obtained results of such testing. It is visible, that the smallest number of hidden neurons, sufficient to get the minimum of the testing error is four and this number has been taken as the optimal one in further experiments. Table II presents the overall relative errors of tremor recognition obtained by the neural classifier for the testing data not taking part in learning, at different input vectors 1 2 3 4 applied in the solution. It is evident, that the common characterizations of tremor signals by peak value of the PSD and the frequency of its occurrence are not sufficient for obtaining good recognition rate. On the other hand, the higher order polyspectra alone are also not optimal. The best results have been obtained by combining the information of the PSD and higher order polyspectra (vector ). The next effort has been directed to reduce the dimension of the input vector by eliminating the components of high correlation. The reduction of the number of inputs means the simplification of the MLP structure and the increase of its generalization ability [14]. To find the correlated components of the input
TABLE III RESULTS OF TESTING THE NEURAL CLASSIFIER OF REDUCED DIMENSIONALITY OF THE OPTIMAL INPUT VECTOR x
vector the correlation coefficient of two components of this vector has been defined as follows:
and
(12) is the number of patterns belonging to each class of where vectors. On the basis of the numerical results of correlation, the input vector of 30 features has been reduced to 20-element vector by eliminating the features of Table I numbered as 3, 4, 5, 9, 11, 15, 18, 23, 24, and 30. As it is seen, some of the eliminated features (for example 3, 15, 24) have belonged to the group of the best ones, at least for discriminating two different classes. However, it has occurred, that features of very good individual discriminative ability are not necessarily best in the set together with other features. The resulting neural network of reduced complexity has been once again trained and tested. The reduction of dimensionality of the input vector has resulted in the improvement of the generalization ability of the trained network. The following results (Table III) have been obtained at the testing mode using only the data not applied in learning. As it is seen the overall error is below 3%. The observed higher error value of the essential tremor recognition is partly due to its fuzzy character, as it can be placed somewhere between the parkinsonian and physiological [3] and partly due to the relatively small number of patterns of this type available in the experiments. VII. CONCLUSION The paper has presented the method of higher order statistics characterization of the tremor signals measured by the accelerometric method. The polyspectra of the second-, third- and fourth-order have provided the set of features, well suited for the recognition task. The set of 30 different features based on these polyspectra has been defined to represent the parkinsonian, essential, and physiological tremors. They have formed the input vectors to the neural MLP classifier, responsible for the final classification. Application of polyspectra has enhanced the characterization of the tremor and enabled the determination of the additional discriminative criteria between different types
JAKUBOWSKI et al.: HIGHER ORDER STATISTICS AND NEURAL NETWORK FOR TREMOR RECOGNITION
of tremor. Thanks to this, the PSD description has been supported by more robust set of features, leading to the significant improvements of the classification results. Our method exhibits better recognition rate when compared with the approaches cited in the literature on tremor [1]–[3], [20]. The numerical experiments performed on the real patients data, belonging to the parkinsonian, essential, and physiological types have proved good recognition rate of the proposed combination of higher order statistics and neural network. The average relative error of recognition on the testing data not taking part in the learning process was below 3% and seems to be satisfactory from the practical point of view. The best results of work carried out by Timmer et al. [20] have shown poorer discrimination ratio as far as three types of tremor, mentioned above, were concerned. Their solution is mainly focused on the time domain features, such as features deduced from Keenan, Tsay, or Subba Rao tests, features of the pure distribution of the time series, time reversal invariance, and asymmetric decay of the autocorrelation function. Using those methods, the physiological and pathological tremors could be separated with an error rate below 20% while the essential and parkinsonian tremor with an error rate below 10%. It should be observed, that they used merely one-dimensional linear classifier based on maximal distance of the cumulative distributions of the features of different kinds of tremor. Additional methods [17]–[19] may be applied, which might (possibly) decrease further the recognition error. However, at the same time it should be stressed that quite objective comparison of the efficiency of each method is very difficult, since different subjects of incomparable advancement of illness have been processed in each case. REFERENCES [1] D. Buckwell and M. A. Gresty, “Analysis of tremor waveforms,” in Handbook of Tremor Disorders, L. J. Findley and W. C. Koller, Eds. New York: Marcel Dekker, 1995, pp. 313–318. [2] G. Deuschl, R. Zimmermann, H. Genger, and C. H. Lucking, “Physiological classification of essential tremor,” in Handbook of Tremor Disorders, L. J. Findley and W. C. Koller, Eds. New York: Marcel Dekker, 1995, pp. 195–208. [3] C. Gantert, J. Honerkamp, and J. Timmer, “Analyzing the dynamics of hand tremor time series,” Biological Cybern., vol. 66, pp. 479–484, 1992. [4] M. Serridge and T. R. SLicht, Piezoelectric Accelerometer and Vibration Preamplifier Handbook. Nærum, Denmark: Brüel&Kjaer, 1987. [5] K. Kwiatos, “Measurements and analysis of human tremor,” Ph.D. dissertation (in Polish), Military Univ. Technol., Warsaw, Poland, 2000. [6] A. Papoulis, Probability, Random Variables and Stochastic Processes. New York: McGraw Hill, 1984. [7] A. Swami, J. M. Mendel, and C. L. Nikias, Higher-Order Spectral Analysis Toolbox for Use With Matlab. Natick, MA: The Mathworks Inc., 1995. [8] L. Nikias and A. P. Petropulu, Higher-order spectral analysis—A nonlinear signal processing framework. Englewood Cliffs, NJ: PrenticeHall, 1993. [9] Y. C. Kim and E. J. Powers, “Digital bispectral analysis and its applications to nonlinear wave interactions,” IEEE Trans. Plasma Sci., vol. PS-7, pp. 120–131, Feb. 1979. [10] J. W. A. Fackrell and S. McLaughlin, “Non-linearity detection for condition monitoring using higher order statistics,” in Proc. COMADEM’96, pp. 519–528. [11] A. Swami and J. M. Mendel, “ARMA parameter estimation using only output cumulants,” IEEE Trans. ASSP, vol. 38, no. 7, pp. 1257–1264, 1990. [12] M. J. Hinich, “Testing for gaussianity and linearity of a stationary time series,” J. Time Series Anal., vol. 3, no. 3, pp. 169–176, 1982.
159
[13] J. Jakubowski, “Application of Higher order statistics for characterization of the human tremor,” Ph.D. dissertation (in Polish), Military Univ. Technol., Warsaw, Poland, 2000. [14] S. Haykin, Neural Networks, a Comprehensive Approach. New York: Macmillan, 1994. [15] K. Hornik, M. Stinchcombe, and H. White, “Multilayer feedforward networks are universal approximators,” Neural Networks, vol. 2, pp. 359–366, 1989. [16] S. Osowski, P. Bojarczak, and M. Stodolski, “Fast second order learning algorithm for feedforward multilayer neural networks and its applications,” Neural Networks, vol. 9, pp. 1583–1596, 1996. [17] P. H. Sydenham, Handbook of Measurement Science Vol. 1. Sydney, Australia: Wiley-Intersci., 1982. [18] L. Kanal, “Patterns in pattern recognition,” IEEE Trans. Inform. Theory, vol. IT-20, pp. 697–722, June 1974. [19] P. Narendra and K. Fukunaga, “A branch and bound alghorithm for feature subset selection,” IEEE Trans. Comput., vol. COMM-26, pp. 917–922, 1977. [20] J. Timmer, C. Gantert, G. Deuschl, and J. Honerkamp, “Characteristics of hand tremor time series,” Biol. Cybern., vol. 70, pp. 75–80, 1993. Jacek Jakubowski was born in Poland in 1968. He received the M.Sc. degree in optical electronics and the Ph.D. degree in digital signal processing from the Faculty of Electronics of Military University of Technology (MUT), Warsaw, Poland, in 1993 and 2000, respectively. Since 1994, he has worked as a Teaching and Research Assistant at MUT. His experience includes teaching courses in electronic measurement, digital measuring devices, and measuring systems. His current research interests include the areas of digital signal processing and time-series analysis. Krzysztof Kwiatos was born in 1961 in Poland. He received the M.Sc. degree in telecommunications and the Ph.D. degree in metrology from Military University of Technology (MUT), Warsaw, Poland, in 1986 and 2000, respectively. From 1986 until 1990, he worked in the Institute of Measurement and Automation Systems. Currently, he is working as an Assistant Professor in Institute of Fundamental Electronics at MUT. His current research lies in digital signal processing, time-series analysis, stochastic processes, and neural networks. Augustyn Chwaleba was born in Poland in 1937. He received the M.Sc., Ph.D., and Dr. Sc. degrees in electrical metrology from the Electrical Faculty of Warsaw University of Technology in Poland, in 1960, 1967, and 1980, respectively. In 1986, he received Professor degree. His experience included teaching courses in electrical engineering at Warsaw University of Technology from 1960s to 1990s. Since 1994, he has been Professor and Director of the Institute of Fundamental Electronics at Military University of Technology, Warsaw. He teaches courses in electrical metrology, measuring systems, and measuring transducers. He has published many technical papers and is author and co-author of several monographs. His general interests lie in the area of methods and systems of measuring information processing. Stanislaw Osowski was born in Poland in 1948. He received the M.Sc., Ph.D., and Dr. Sc. degrees from the Warsaw University of Technology, Warsaw, Poland, in 1972, 1975, and 1981, respectively, all in electrical engineering. Currently, he is a Professor of Electrical Engineering at the Institute of the Theory of Electrical Engineering and Electrical Measurements, Warsaw University of Technology. His research and teaching interest are in the areas of neural networks, optimization techniques, and computer-aided circuit analysis and design. He is an author or co-author of more than 200 scientific papers and ten books.