HIGHLY SENSITIVE MICRO CORIOLIS MASS FLOW SENSOR J. Haneveld, T.S.J. Lammerink, M. Dijkstra, H. Droogendijk, M.J. de Boer and R.J. Wiegerink. MESA+ Institute for Nanotechnology, University of Twente, The Netherlands. E-mail:
[email protected] ABSTRACT We have realized a micromachined micro Coriolis mass flow sensor consisting of a silicon nitride resonant tube of 40 µm diameter and 1.2 µm wall thickness. Actuation of the sensor in resonance mode is achieved by Lorentz forces. First measurements with both gas and liquid flow have demonstrated a resolution in the order of 10 milligram per hour. The sensor can simultaneously be used as a density sensor.
Where L is the length of the rectangular tube (see Figure 1). The Coriolis force induces a “flapping mode” vibration with an amplitude proportional to the mass flow.
1. INTRODUCTION
Integrated microfluidic systems have gained interest in recent years for many applications including (bio)chemical, medical, automotive, and industrial devices. A major reason is the need for accurate, reliable, and cost-effective liquid and gas handling systems with increasing complexity and reduced size. In these systems, flow sensors are generally one of the key components. Most MEMS flow sensors are based on a thermal measurement principle. It has been demonstrated [1,2] that such sensors are capable of measuring liquid flow down to a few nl/min. These sensors require accurate measurement of very small flow-induced temperature changes. An important problem of thermal flow sensors is that the measurement is highly dependent on temperature and fluid properties like density and specific heat. The sensor presented in this paper is based on the Coriolis force which acts on a fluid flow in a vibrating channel. The main advantage is that the Coriolis force is directly proportional to mass flow and independent of temperature, pressure, flow profile and fluid properties. Mostly, Coriolis-flow meters [3,4] are used for large flow rates, since the relatively weak Coriolis forces are correspondingly harder to detect for small flows. In general, the signal-error ratio is very sensitive to fabrication and construction errors, as well as external influences of temperature and mechanical nature. A Coriolis type flow sensor consists of a vibrating tube. Now consider a moving mass inside the tube. This mass is forced to change its velocity due to the externally imposed vibration. This results in Coriolis forces that can be detected. Figure 1 shows a schematic drawing of a Coriolis sensor based on a rectangular tube shape. The tube is actuated in a “torsion mode” indicated by ω. A mass flow Φ m inside the tube results in a Coriolis force Fc that can be expressed by: →
→
→
Fc = −2 L ω× Φ m
978-1-4244-1793-3/08/$25.00 ©2008 IEEE
(1)
Figure 1: Rectangle-shaped Coriolis flow sensor (ω is the torsion mode actuation vector, Fc indicates the Coriolis force due to mass flow).
2. SENSOR DESIGN
Earlier attempts to realize micromachined Coriolis flow sensors [5,6] were aimed at using silicon as the material for the tube. Enoksson et al. [5] use a combination of wet anisotropic etching of silicon and wafer bonding. This has the disadvantage that there is no complete freedom in the choice of the sensor tube shape, and the tubes have a rather thick wall (in the order of 100 µm). In this paper we propose to use silicon nitride, which results in a thinner tube wall so that the mass of the tube can be smaller compared to the mass of the moving fluid. In addition, channels completely made of silicon nitride ensure inertness of the sensor tube to virtually all chemicals. A sensor design was made for fluid flow rates up to 1 g/hr, with a maximum pressure drop over the sensor in the order of 1 bar (using water). In that case the optimal dimensions for the tube outline shape are 2.5x4 mm, with an inner diameter of the tube of approximately 40 µm. Figure 2 shows a photograph of the realized sensor chip. The sensor is actuated by Lorentz forces using a constant external magnetic field in combination with an alternating current (~2 mA, dissipated power ~1 mW) through a platinum track on top of the channel.
3. FABRICATION
The sensor structures were fabricated using the surfacechannel technology described in [7,8] and outlined in figure 3.
920
MEMS 2008, Tucson, AZ, USA, January 13-17, 2008
Authorized licensed use limited to: UNIVERSITEIT TWENTE. Downloaded on November 25, 2008 at 07:49 from IEEE Xplore. Restrictions apply.
using lift-off lithography (figure 3c) to create the metal track which will facilitate Lorentz force actuation of the structure. Finally, release windows and fluidic access holes to the tube are etched using RIE etching on the front and the backside of the wafer after which the structure is released (figure 3d) by KOH wafer-through etching (525 minutes using 25% KOH at 75°C). Figure 4 shows a close-up of the nitride tube and figure 5 shows an overview of the silicon nitride sensing structure after release.
Figure 2: Photograph of the sensor chip (size 15x15 mm). The free-hanging rectangular sensing tube is clearly visible in the centre of the chip.
Figure 4: Left: SEM photograph (view from the bottom of the chip) of the sensor tube entering the silicon support. The scallops are a result of the series of holes which are used to etch the channel.
Figure 3: Outline of the fabrication process. Left column: cross-section perpendicular to the sensor tube. Right column: cross-section along the length of the tube. First a 500 nm thick low stress LPCVD silicon-rich nitride (SixNy) layer is deposited on a p-type silicon wafer. After a thickness measurement using a Plasmos ellipsometer, a 50 nm layer of chromium is sputtered on the substrate. This chromium layer is subsequently patterned using a mask containing arrays of 6x2 µm holes, spaced 2 µm apart. The pattern is then transferred to the nitride layer by means of reactive ion etching (RIE). Then an isotropic plasma etch step is performed in an ADIXEN AMS 100 SE apparatus (figure 3a): this defines the channel shape. After resist stripping, the chromium mask is removed and another SixNy layer is grown with a thickness of 1.4 µm; this forms the channel wall and seals the etch holes in the first nitride layer in one single step (figure 3b). Subsequently a 10/100 nm layer of chromium/platinum is sputtered and patterned
Figure 5: SEM photograph of the complete sensor loop (the lighter areas are the platinum electrodes for actuation of the structure). To be able to perform flow measurements on the chips, a chip holder was designed and fabricated, allowing fluidic and electrical connections to be made to the chip (figure 6). Permanent bar magnets can be inserted in the chip holder to provide the magnetic field needed for the actuation of the structures. Because of the symmetrical lay-out of the chip, as 921
Authorized licensed use limited to: UNIVERSITEIT TWENTE. Downloaded on November 25, 2008 at 07:49 from IEEE Xplore. Restrictions apply.
well as the chip holder, it is possible to actuate the structure both in “flapping” and in “torsion” mode, depending on the orientation of the chip in the chip holder.
A syringe pump (CMA Microdialysis CAD system) was used to create water and ethanol volume flows between 0 and 1.2 cm3/hr through the chip. During the measurement the sensor output signal is recorded, together with the pressure of the liquid, which is related to the mass flow rate.
Figure 6: Chip mounted in holder with fluidic and electrical connections and bar magnets for Lorentz force actuation.
4. MEASUREMENTS Mass flow measurements were done using water, ethanol and argon. A PolyTec laser vibrometer (MSA400) was used to measure the out-of-plane local displacements of the tube. Figure 7 shows an image of the resulting torsional vibration mode. The torsional resonance frequency of the empty tube is approximately 3 kHz; this value decreases to 2 kHz when filled with water. The vibration amplitude is linearly dependent on the actuation current. During the measurements the tube is operated at an amplitude in the order of 10 µm (at the corners of the rectangular structure) with an ambient pressure of 1 bar. For mass flow measurements the point P (see figure 7) is monitored. At zero flow this point shows no out of plane motion, as it is on the rotational axis of the torsion mode. Any out of plane velocity component which is measured is therefore a direct result of Coriolis force.
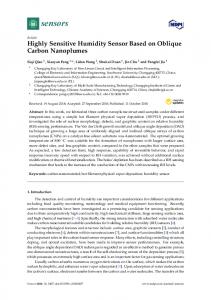
Figure 8: Measured output signal as a function of volume flow for water and ethanol. The curves coincide when plotted as a function of mass flow. Figure 8 shows the displacement amplitude as a function of volume flow for both water and ethanol (the values for ethanol have been compensated for the small difference in ω compared to the water measurements). The difference in the slope of the two lines is exactly equal to the relative density of ethanol compared to water, indicating that the device directly measures mass flow. The zero-stability of the sensor is better than 1% of the full-scale of 1 gram/hour.
Figure 9: Argon gas mass flow measurement.
P Figure 7: Measured torsion mode using a PolyTec laser vibrometer setup.
Figure 9 shows a mass flow measurement using argon gas. A mass flow sensor was introduced behind the Coriolis chip, to measure the mass flow of the gas. The difference in slope of the output signal as compared to the water measurement in figure 8, is due to different reasons. Firstly, a 922
Authorized licensed use limited to: UNIVERSITEIT TWENTE. Downloaded on November 25, 2008 at 07:49 from IEEE Xplore. Restrictions apply.
different chip has been used for the measurements with argon. Furthermore, the value of ω changes when changing media (both the resonance frequency as well as the amplitude change). In addition, the actuation voltage has been decreased from 1.0 V to 0.5 V for the gas measurement, leading also to a decrease in Coriolis force with a factor of 2. Considering the above, the response of the sensor when measuring argon mass flow corresponds to the water measurements. The offset which can be seen in the velocity/flow rate graphs is due to non-perfect alignment of the sensor to the external magnetic field. This causes a small flapping mode in addition to the desired torsion mode actuation. The Coriolis (flapping) movement would then be superimposed on this “misalignment movement”. A measurement was done to confirm this hypothesis. Rotating the external B-field over ±10° and measuring the response of the sensor to mass flow resulted in the graph shown in figure 10. It can be concluded that non-perfect alignment results in an offset in the sensor output signal at zero-flow, but that the effects on sensitivity are negligible. The reason for the initial decrease of the signal is that the recorded sensor output value is a RMS value: so it is always positive.
Fig. 10: Effect of non-perfect alignment of the magnetic field to the sensor structure. The Coriolis sensor also functions as a density sensor: figure 11 shows the measured torsional resonance frequencies for water, ethanol, a 1:1 mixture of water and ethanol, and nitrogen. Very good 1/f2 dependency is observed.
5. CONCLUSIONS
We have successfully fabricated and tested a micro Coriolis mass flow sensor. The experiments show excellent linear behavior of the sensor, combined with good resolution in the order of 0.01 g/hour. Sensor output signal offset was observed and shown to be a result of non-perfect alignment of the sensor to the actuation magnetic field.
Figure 11: Measured resonance frequency as a function of the density of the medium.
REFERENCES [1] Y. Mizuno, M. Liger, Y-C. Tai, “Nanofluidic Flowmeter Using Carbon Sensing Element”, Proc. MEMS 2004, Maastricht, The Netherlands, January 22-25, 2004, p. 322325. [2] M. Dijkstra, M.J. de Boer, J.W. Berenschot, T.S.J. Lammerink, R.J. Wiegerink, M. Elwenspoek, “Miniaturized Flow Sensor with Planar Integrated Sensor Structures on Semicircular Surface Channels," Proc. MEMS 2007, Kobe, Japan, January 21-25, 2007, pp. 123126. [3] R.C. Baker, “Coriolis Flowmeters: Industrial Practice and Published Information”, Flow. Meas. Instrum., Vol. 5, No. 4, pp. 229-246, 1994. [4] M. Anklin, W. Drahm, A. Rieder, “Coriolis Mass Flowmeters: Overview of the Current State of the Art and Latest Research”, Flow. Meas. Instrum., Vol. 17, pp. 317323, 2006. [5] P. Enoksson, G. Stemme, E. Stemme, “A Silicon Resonant Sensor Structure for Coriolis Mass-flow Measurements”, J. Microelectromech. Syst., Vol. 6, pp. 119-125, (1997). [6] D. Sparks, R. Smith, J. Cripe, R. Schneider, N. Najafi, “A Portable MEMS Coriolis Mass Flow Sensor”, Proc. IEEE Sensors 2003 Conference, Toronto, Canada, October 2224, 2003, pp. 90-92. [7] M. Dijkstra, M.J. de Boer, J.W. Berenschot, T.S.J. Lammerink, R.J. Wiegerink, M. Elwenspoek, “A Versatile Surface Channel Concept for Microfluidic Applications”, J. Micromech. Microeng., Vol. 17, pp. 1971-1977, 2007. [8] M.J. de Boer, R.W. Tjerkstra, J.W. Berenschot, H.V. Jansen, G.J. Burger, J.G.E. Gardeniers, M. Elwenspoek, A. van den Berg, “Micromachining of Buried Micro Channels in Silicon”, J. Microelectromech. Syst., Vol. 9, No. 1, pp. 94-103, 2000.
923
Authorized licensed use limited to: UNIVERSITEIT TWENTE. Downloaded on November 25, 2008 at 07:49 from IEEE Xplore. Restrictions apply.