quickly dissected free of connective tissue and immersed in tissue culture medium for ..... the tips of invading marrow tunnels in PZ, shows the outline of cross-sectional ..... Seo GS, Aoki J, Moriya H, Karakida O, Sone S, Hidaka H,. Katsuyama T ...
JOURNAL OF BONE AND MINERAL RESEARCH Volume 16, Number 6, 2001 © 2001 American Society for Bone and Mineral Research
Histomorphometry of the Embryonic Avian Growth Plate by Proton Nuclear Magnetic Resonance Microscopy* KIMBERLEE POTTER,1 WILLIAM J. LANDIS,2 and RICHARD G.S. SPENCER3
ABSTRACT Quantitative nuclear magnetic resonance (NMR) microscopy was used to characterize the biochemical and morphological properties of the different zones within the growth plate of an embryonic chick femur. For precalcified tissue, water proton transverse relaxation times (T2) and magnetization transfer values (MT) were directly and inversely dependent, respectively, on tissue cellularity, defined as the intracellular area per unit area on histological sections. T2 values extrapolated for intra- and extracellular water were 96 ms and 46 ms, respectively. The extracellular T2 was comparable with that measured for mature cartilage. The MT values extrapolated for intra- and extracellular compartments were 0.32 and 0.85, respectively. These values were comparable with those values reported in the literature for cell pellets and for mature cartilage tissue. Thus, cellularity dominated the NMR properties of this immature cartilage tissue. Mineral deposits within calcified cartilage and periosteal bone invoked NMR relaxation processes that were dependent on the inorganic mineral phase. Additionally, collagen molecules present in mineralized zones gave rise to a significant MT effect. These results show the utility of water proton NMR microscopy for assessing both the organic and inorganic phases within mineralized tissues. (J Bone Miner Res 2001;16:1092–1100) Key words:
nuclear magnetic resonance microscopy, cartilage, growth plate, mineral deposits
INTRODUCTION the mechanisms that control the emergence of spatial patterns during the development of a biological tissue, it is necessary to detect both biochemical and ultrastructural changes that occur during morphological differentiation. Ideally, an animal model to be analyzed for this purpose would exhibit relatively clearly defined regions for which compositional and morphological data could be correlated with each maturation stage. In this context, the embryonic avian long bone presents a tissue that is composed of cartilage cells grouped into distinct zones repre-
T
O UNDERSTAND
*Published abstract appears in Proc Int Soc Magn Reson Med 1999;7:1048.
senting sequential stages of morphological differentiation and accompanied by progressively calcifying extracellular matrix.(1,2) In this article, proton nuclear magnetic resonance (NMR) microscopy was used to characterize aspects of the morphology and biochemistry of the developing chick embryo growth plate, including both its precalcified and mineralizing regions. Analytical studies of calcifying biological tissues, including growth plate cartilage, by conventional techniques such as radiographic or histochemical methods have been limited because sample preparation may introduce specimen changes or results may be restricted to selected constituents such as the mineral alone. NMR microscopy offers the possibility of investigating such tissues without destructive preparative techniques while unique changes in tissue mor-
1 Section on Tissue Biophysics and Biomimetics, National Institute of Child Health and Human Development, Bethesda, Maryland, USA. 2 Department of Biochemistry and Molecular Pathology, Northeastern Ohio Universities College of Medicine, Rootstown, Ohio, USA. 3 Nuclear Magnetic Resonance Unit, National Institute on Aging, Baltimore, Maryland, USA.
1092
NMR MICROSCOPY OF GROWTH PLATE CARTILAGE
phology and composition can be detected with high specificity. With this imaging modality, the true 3D organization of the tissue can be visualized readily. The avian growth plate used in this work was selected for investigation because cartilage resorption is slower than its expansion by proliferation. Hence, avian growth zones are separated to a greater extent than in mammals.(3) The embryonic growth plate was chosen as a model to avoid any additional structural and chemical complexity introduced by a developing secondary center of ossification after hatching. NMR imaging is well suited to the delineation of soft tissues.(4) Previous studies show the exceptional anatomical detail of cartilaginous structures obtained by NMR.(5–9) The zonal appearance of mature articular cartilage in NMR images has been ascribed to differences in water content,(10,11) proteoglycan (PG) content,(8) collagen orientational effects,(12,13) and truncation artifact.(14) However, in immature epiphyseal cartilage (EC) the contrast observed on longitudinal relaxation time (T1)– and transverse relaxation time (T2)–weighted NMR images has been attributed to underlying tissue morphology.(15,16) The dependence of tissue NMR properties on morphology also was reported for images of human fetal nasal septa.(17) In this article, evidence is presented to show that, in the developing growth plate, cellularity dominates tissue NMR properties. Using histological sections as guides, the different cartilage zones within the growth plate were identified and assigned spatially determined NMR values. This approach can be used to study the organization of the growth plate and the endochondral ossification process. Importantly, the technique can be applied to the intact growth plate without destructive sectioning, tissue biopsy specimens, or the introduction of histological stains or molecular probes. The approach also can provide additional information about the normal or pathological mineralization of a range of connective tissues.
MATERIALS AND METHODS Growth plate cartilage The femurs from normal 20-day-old chick embryos (Truslow Farms, Inc., Chestertown, MD, USA) were quickly dissected free of connective tissue and immersed in tissue culture medium for the duration of the NMR experiments. Images of the distal end of intact femurs were acquired with proton NMR microscopy. Tissue culture medium was prepared by adding 50 ml of heat-inactivated fetal bovine serum (Biofluids, Rockville, MD, USA), 5 ml of 200 mM L-glutamine (Biofluids), 0.5 ml of 250 g/ml fungizone (Biofluids), and 0.5 ml of 10 mg/ml gentamicin reagent solution (Gibco, Gaithersburg, MD, USA) to 500 ml of Dulbecco’s modified Eagle’s Medium (Biofluids).
Proton NMR microscopy All NMR microimaging experiments were performed on a Bruker DMX spectrometer (Bruker, Billerica, MA, USA) coupled to a superwide-bore magnet (104.7-mm bore diam-
1093
eter) operating at 9.4 T (400.1 MHz for 1H). Proton NMR microimaging of an individual chick femur was performed in a Bruker self-shielded microimaging gradient set with a 15-mm-diameter resonator coil. During data acquisition, the femur was maintained at 37°C with its long axis oriented parallel to the magnetic field direction unless otherwise specified. The NMR properties of the different growth zones were extracted from two-dimensional coronal images of the distal growth plate. Images typically had a 15-mm field-of-view, a slice thickness of 1 mm, a 256 ⫻ 256 matrix size, and a nominal in-plane resolution of 60 m. T1 maps were obtained by fitting the signal intensity of 10 progressive saturation images with acquisition repetition times (TR) ⫽ 0.2–15 s with a fixed echo time (TE) ⫽ 12.7 ms. T2 maps were obtained from the fit of 16 images, acquired with a multiecho sequence with TE ⫽ 14 –224 ms with a fixed TR ⫽ 15 s. The magnetization transfer (MT) value was calculated from the equation MT ⫽ [1 ⫺ Mso/ Mo], where Mso/Mo gives the ratio of image intensities acquired with and without the application of a 5-s, 12 T saturation pulse applied 6000 Hz off-resonance before a standard spin-echo imaging sequence. The MT rate km between bound and free water was calculated according to km ⫽ MT/T1sat, where T1sat is the longitudinal relaxation time of the free protons in the presence of an off-resonance saturation pulse. Local T1sat values were calculated from a series of eight images with varying saturation times (tp ⫽ 0.1–5 s) using the expression Ms(tp) ⫺ Mso ⫽ (Mo ⫺ Mso) exp(⫺tp/T1sat), where Ms(tp) is the observed intensity after the application of a saturation pulse of length tp.(18) The water diffusion maps were calculated from a series of eight images acquired with the pulse-gradient-spin-echo (PGSE) sequence with a repeat time of TR ⫽ 5 s.(19) Typical values for the diffusion (⌬) and gradient duration (␦) times were 10 ms and 5 ms, respectively, with diffusion gradients applied in the read gradient direction, parallel to the longitudinal growth axis of the femur. Gradient calibrations were achieved by measuring a phantom of known dimensions in the field-of-view and verified by using the PGSE sequence to measure the diffusion coefficient of water at room temperature.(20) Diffusion coefficients were calculated using a modified diffusion equation with cross terms for the read gradient.(21) 3D images were acquired using a rapid acquisition with relaxation enhancement (RARE) sequence in which image contrast is dominated by the transverse relaxation time (T2).(22) Contrast between cartilage and bone was achieved with TR ⫽ 2 s, TE ⫽ 6.3 ms, and a RARE factor of 16. The read gradient was parallel to the long axis of the femur. The field-of-view was 24 ⫻ 6 ⫻ 6 mm and the matrix size was 256 ⫻ 64 ⫻ 64 mm. Image resolution was 94 m isotropic. The number of averages was 8 and the total acquisition time was 70 minutes. NMR data for the various growth zones within the growth plate are reported as the mean ⫾ pixel SD. Owing to the large number of pixels used for these determinations, all quoted differences were found to be statistically significant (p ⬍ 0.05).
1094
POTTER ET AL.
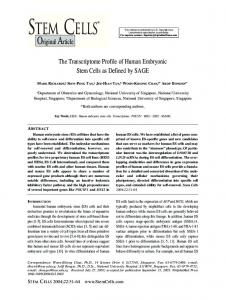
FIG. 1. Coronal 5-m sections through the femur of a normal 20-day-old chick embryo showing the developing growth plate before endochondral ossification. (A) The dark (black) regions in a von Kossa–stained section show the presence of mineral in the PB and calcified cartilage (CZ) near marrow tunnels (M) in the upper HZ. Note that this section is not through the tissue midline, but corresponds to the significantly thicker NMR slice images in Fig. 2. (B) An equivalent tissue section shows Alcian blue–stained sulfated PGs of cartilage. The histological zones indicated are EC, RZ, PZ, and HZ. (C) The tissue within the box seen in panel B is shown at a higher magnification.
Histology After NMR imaging, chick femurs were fixed in neutral buffered formalin (Sigma, St. Louis, MO, USA) for 2 days at 4°C. The tissues were embedded in paraffin and sectioned (⬃5 m) parallel to their longitudinal axis. Alcian blue and von Kossa staining were applied to alternate tissue sections for detection of sulfated PG (blue color) and phosphate as an indicator of mineral deposition (black), respectively.(23)
Morphometric analysis Representative Alcian blue–stained 5 m sections of the different histological zones within the distal growth plate of a femur, particularly the EC, proliferating zone (PZ), and hypertrophic zone (HZ), were recorded using a digital camera interfaced to a light microscope (Arcturus Engineering, Mountain View, CA, USA). Images were saved as TIFF files and processed using the public domain National Institutes of Health (NIH) Image software program (NIH, Bethesda, MD, USA). Images used for cell area measurements, defined by the region of each observable chondrocyte lacuna, were calibrated with a graticule captured with the same objective magnification. Areas of 15–20 cells were determined and a mean area and its SD were calculated. Measurements of cellularity, defined as the intracellular area per unit area on histological sections, were performed on gray-scale histological images. An appropriate threshold, determined from an image intensity histogram, was used to segment the image. White pixels were assigned to intracellular space and black pixels to the extracellular space. Tissue cellularity was calculated from a ratio of intracellular pixels to total number of pixels in a given region of interest over the section examined and reported as percentage.
RESULTS Growth plate morphology Histological sections of 5-m thickness, through the growth plate of a typical developing chick femur, are shown
in Fig. 1 to define the general morphology of the tissue. At this stage of development, much of the femoral tissue is composed of cartilage with the exception of the periosteal bone (PB) of the diaphysis and hematopoietic cells of the developing marrow. The black regions observed on von Kossa-stained sections, such as the one shown in Fig. 1A, are mineral phosphate deposits. The central calcified zone (CZ) in the upper HZ on this section arises from peripheral mineral phosphate deposits around marrow tunnels extending toward the epiphysis. The appearance of a central CZ is caused by the fact that an off-center slice is shown. An off-center slice was selected to form the appropriate correspondence between histology and NMR images; the NMR images have a much greater section thickness (1 mm vs. 5 m) and hence include peripheral CZ (Fig. 2). A similar section to Fig. 1A was stained with Alcian blue to identify the cartilaginous tissue of the distal growth plate. Figure 1B shows the general appearance of the growth plate while its distinct histological zones, observed at higher magnification, are presented in Fig. 1C. After the nomenclature and description of the avian growth plate given by Hunziker,(24) a zone of metachromatic tissue interspersed with small round chondrocytes beneath the articular surface defines the EC. Distal to this zone is a region consisting of lightly stained tissue with less differentiated chondrocytes and referred to as the resting zone (RZ). The PZ, in which the chondrocytes assume a flattened appearance, lies beneath the RZ and displays an intensely metachromatic matrix. As cells in the PZ mature, they assume a more rounded appearance with a well-defined territorial matrix directly surrounding the cell, forming a mature or prehypertrophic cartilage region. The HZ, which occurs just below the prehypertrophic region, is composed of very large cells, each again with a well-defined territorial matrix but now with very little matrix within the interterritorial region between adjacent cells separating their respective lacunae. Analysis of well-defined zones in histological sections by morphometry shows that tissue cellularity increases from 11% in the EC to 20% in the PZ. This change can be
NMR MICROSCOPY OF GROWTH PLATE CARTILAGE
1095
FIG. 2. (A–D) Quantitative proton NMR maps of T2, T1, D, and MT in panels A–D, respectively, of the avian femur immersed in tissue culture medium at 37°C. The in-plane resolution of these images was 60 m and the slice thickness was 1 mm. The longitudinal axis of the femur was oriented parallel to the magnetic field direction. The histological zones indicated are EC, PZ, HZ, and CZ.
TABLE 1. NMR PARAMETERS Zone EC PZ CZ HZ
OF
DIFFERENT ZONES
IN
GROWTH PLATE CARTILAGEa
T1 (s)
T2 (ms)
MT
km (s⫺1)
D ⫻ 105 (cm2/s)
2.6 (0.3)1 2.6 (0.3)2 2.6 (0.4)3 3.5 (0.5)1,2,3
52 (5)1,2,3 56 (5)1,4,5 41 (7)2,4,6 70 (5)3,5,6
0.79 (0.07)1,2,3 0.74 (0.03)1,4,5 0.78 (0.05)2,4,6 0.60 (0.04)3,5,6
1.6 (0.4)1,2,3 1.2 (0.2)1,4,5 1.4 (0.3)2,4,6 0.5 (0.1)3,5,6
1.6 (0.3)1,2,3 1.1 (0.3)1,4 1.1 (0.3)2,5 1.8 (0.3)3,4,5
Values represent the mean ⫾ SD. Like numbers in this grouping for each column of Table 1 indicate pair-wise comparisons that had significant differences in their means at p ⫽ 0.05. a
1,2,3,4,5,6
attributed to the greater cell number in PZ as compared with EC, because cell areas for these two different zones are comparable by morphometry (EC ⫽ 35 ⫾ 6 m2; PZ ⫽ 39 ⫾ 8 m2; p ⫽ 0.14). Such data are consistent with the presumed function of the PZ, where cells are known to proliferate. In HZ, tissue cellularity increased to 47% because of the marked increase in cell area (237 ⫾ 72 m2; p ⬍ 0.001) compared with that of either EC or PZ.
Quantitative NMR imaging Histological zones identified in Fig. 1 were readily observed by quantitative NMR imaging. Figure 2 presents
quantitative maps of the following NMR parameters: (A) water proton transverse (T2) and (B) longitudinal relaxation (T1) times, (C) water diffusion coefficient, and (D) MT value, for the distal end of the developing chick femur immersed in tissue culture medium at 37°C. The NMR values for the different histological zones are summarized in Table 1. The source of contrast derived from the respective imaging modalities is incompletely understood, but comparisons between histological sections and the NMR images provide information that suggests possible correlations between biological parameters of the tissue and NMR measurable parameters. In the T2 map of the tissue (Fig. 2A) the PB of
1096
POTTER ET AL.
FIG. 3. (A–D) Average T2, T1, D, and MT values in panels A–D, respectively, are plotted against the cellularity of different cartilage zones (EC ⫽ 11%; PZ ⫽ 20%; HZ ⫽ 47%) of the avian growth plate. NMR values for pixels in each zone were averaged together and plotted as a mean ⫾ pixel SD.
the diaphysis and the mineral deposits, especially around marrow tunnels(25) penetrating the upper HZ, had the lowest T2 values. For calcified cartilage, T2 was 41 ⫾ 7 ms. EC had a lower T2 value (52 ⫾ 5 ms) than the adjacent PZ (56 ⫾ 5 ms), and the T2 value measured in the deep HZ (70 ⫾ 5 ms) was the highest for this sample. When T2 was plotted against tissue cellularity for all cartilage zones, as shown in Fig. 3A, a linear relation (p ⫽ 0.02) was found. Extrapolation of this linear relation gave the T2 of the intracellular chondrocyte compartment (100% cellularity) as 96 ⫾ 1 ms and that of the extracellular compartment (0% cellularity) as 46 ⫾ 1 ms. The contrast observed in the T1 map of the femur was different from that of the T2 map. Within the femur, the PB consistently had the lowest T1, as was the case for T2. However, the water proton T1 values for calcified cartilage were comparable with the T1 values for uncalcified cartilage, which is in contrast to its T2 results. In CZ, T1 values were typically 2.6 ⫾ 0.4 s, lower than those from HZ (3.5 ⫾ 0.5 s) but comparable with the T1 of the proliferating and EC zones (2.6 ⫾ 0.3 s). As shown in Fig. 3B, the correlation between water proton T1 values and tissue cellularity did not reach statistical significance (p ⫽ 0.15). Water diffusion coefficients were consistently low in regions of the femur having the lowest T2 values, particularly for PB and calcified cartilage zones (CZ, 1.1 ⫾ 0.3 ⫻ 10⫺5 cm2/s). For the cartilaginous growth plate, water diffusion values were significantly lower in the PZ (1.1 ⫾ 0.3 ⫻ 10⫺5 cm2/s) compared with adjacent hypertrophic (1.8 ⫾ 0.3 ⫻ 10⫺5 cm2/s) or epiphyseal zones (1.6 ⫾ 0.3 ⫻ 10⫺5 cm2/s) and were not correlated with tissue cellularity (Fig. 3C).
The highest values in the MT map shown in Fig. 2D occurred in those regions with the lowest T2 values, that is, the PB and CZ (0.78 ⫾ 0.05). For growth plate cartilage, HZ had the lowest MT value (0.60 ⫾ 0.04) and EC had the highest (0.79 ⫾ 0.07). The MT value for the PZ was 0.74 ⫾ 0.03. These results yield an inverse relationship (p ⫽ 0.009) between MT and cellularity, as shown in Fig. 3D. The MT values of cells and matrix, extrapolated from the established linear relation, were 0.32 ⫾ 0.01 and 0.85 ⫾ 0.01, respectively. The MT rate constant (km), reported in Table 1, reveals larger differences between distinct histological zones. In the cartilaginous growth plate, HZ had the lowest (0.5 ⫾ 0.1 s⫺1) and EC had the highest (1.6 ⫾ 0.4 s⫺1) rate constants. Despite the presence of mineral deposits in CZ, which tend to reduce the recorded MT signal, the km value for CZ (1.4 ⫾ 0.3 s⫺1) fell between that for PZ (1.2 ⫾ 0.2 s⫺1) and EC. Identical experiments performed on the same femur samples oriented with the longitudinal growth axis perpendicular to the magnetic field direction produced the same linear dependence of NMR properties (T2 and MT) on tissue cellularity.
Qualitative mineral maps To study the spatial distribution of mineral in the growth plate, a 3D RARE image of the intact femur was acquired. This approach exploits the T2 differences between the cartilage and mineral phases of the tissue to discriminate between cartilage and bone. Examples of two slices extracted from a 3D data set are shown in Figs. 4A and 4B with comparative histological sections (Figs. 4C and 4D) obtained from approximately the same locations in the femur.
NMR MICROSCOPY OF GROWTH PLATE CARTILAGE
1097
FIG. 4. (A and B) Two coronal images extracted from a 3D data set acquired for a normal 20-day-old chick femur. The data set was acquired with a 3D RARE sequence (TR/TE/ RARE ⫽ 2000/6.3/16). The in-plane resolution was 94 m. (C and D) The von Kossa–stained sections of the same femur show the location of mineral deposits (dark stippling) in the NMR slices shown. The tissue at locations a– d in panel B are shown as transverse slices in Figs. 5A–5D.
Mineral deposits correspond to regions with the lowest intensity in the slice images and are the dark regions in the von Kossa–stained sections. In the slice images shown in Figs. 4A and 4B, the highest concentration of mineral was found in the diaphyseal bone shaft and in the subjacent regions within the hypertrophic cartilage core. Calcification around marrow tunnels in the upper HZ resembled dark vertical striations in the coronal images. The loss of signal observed in the medullary space in the middiaphyseal zone was most likely attributable to hematopoietic cells present in the marrow cavity. Relatively bright zones in these images corresponded to regions of the femur that were principally of cartilaginous composition. Zonal variations in signal intensity were readily visualized, affirming the known spatial differences in tissue properties of the femur. The foregoing results reveal a close correspondence between NMR images and von Kossa–stained sections. Figure 5 shows transverse sections of the same femur extracted from the same 3D data set as described previously. These images clearly reveal a spatial progression of mineralization at four successive locations along the length of the femur, indicated by the white arrows in the coronal image shown in Fig. 4B. The initial transverse slice (Fig. 5A), near the tips of invading marrow tunnels in PZ, shows the outline of cross-sectional bone where little mineral is deposited. At a later stage in femur development, corresponding to a more
distal position from the growth plate, a meshlike pattern composed of a number of regularly spaced near-circular shapes appears in Figs. 5B and 5C, describing the crosssectional profile of the bone shaft at these locations. These circular shapes represent the cross-sectional view of the previously mentioned marrow tunnels. In Fig. 5D the crosssectional area of the bone shaft was somewhat reduced compared with that in Figs. 5B and 5C, while the bone collar was thicker than that in Figs. 5B and 5C. The meshlike pattern was still apparent but not as distinctive as that observed in Figs. 5B and 5C.
DISCUSSION This study used the embryonic avian growth plate with its distinct histological zones as a model to relate NMR measurable parameters to well-defined tissue parameters. A number of insights were deduced based on comparisons between histological sections of the growth plate and quantitative NMR images. For uncalcified cartilage, certain NMR properties could be correlated with tissue cellularity, defined as the ratio of intracellular area to total area on histological sections. This result was independent of the tissue orientation with respect to the magnetic field direction, indicating that the overall observed NMR contrast was independent of the orientation of constituent collagen fibers.
1098
POTTER ET AL.
FIG. 5. Four transverse images extracted from a 3D data set of the 20-day-old chick femur presented in Fig. 4. Slices a– d are indicated by white arrows on the coronal image in Fig. 4B. The in-plane resolution was 94 m. Mineral present in these images is indicated by lowintensity pixels. Note the meshlike pattern in panels B–D.
Water proton T2 relaxation times were found to be directly dependent on tissue cellularity, indicating that T2 might be used to monitor changes in tissue cellularity with chondrocyte maturation. The direct relationship between T2 and cellularity suggests that changes in extracellular matrix composition with maturation do not produce significant changes in the T2 values of extracellular water protons. If the change in the T2 of extracellular water protons is attributed to changes in the PG content of the matrix, as previously reported,(26) it is evident that for the different growth zones the PG content does not change significantly. This result is consistent with the reportedly minimal changes in PG content for the different zones of the chick growth plate.(27) The fact that the T2 value derived for the extracellular matrix (46 ms) was comparable with mature articular cartilage suggests that the PG content of the extracellular matrix of the growth plate is comparable with that of mature cartilage. With the appearance of small calcifications, the dependence of T2 on cellularity was no longer valid. Rather, T2 was uniformly reduced. This was attributed to spin dephasing caused by susceptibility gradients induced by mineral inclusions. Thus, T2 maps might serve as an NMR “stain” for mineral. In contrast to the data obtained from T2, water proton T1 values generally were unaffected by the presence of mineral deposits in the tissue except in regions of woven bone in the middiaphysis of the femur. Here, the T1 value of water was a minimum. The observation that mineral deposits leave most T1 values unchanged is consistent with the reported
result that small calcifications do little to influence the T1 relaxation of water unless there is enough mineral to alter the mobility of the surrounding water molecules.(28) This observation also is consistent with phantom studies of different calcium salts.(29,30) Water proton T1 values were not strongly dependent on tissue cellularity. This result suggests that the T1 values of intra- and extracellular water are similar. Alternatively, changes due to cellularity may be masked by underlying changes in the T1 of the extracellular water because of changes in matrix composition. Although water diffusion maps provide some insight into mineral localization, the correspondence between local diffusion and mineralization is confounded by other factors. In particular, the hematopoietic cells of the marrow and the packing density and geometry of chondrocytes residing in the PZ both result in low water diffusion values, which cannot be differentiated from the low values measured in mineralized regions. Thus, additional NMR measurements of a given tissue sample are required to unambiguously identify the different zones within the growth plate. A number of studies in the literature relate the measured MT value of cartilage to its collagen content.(26,31–33) Thus, the MT value for each histological zone in the growth plate will be directly dependent on the amount of collagencontaining matrix or inversely dependent on tissue cellularity. The inverse dependence of MT on tissue cellularity is confirmed in the present results. Furthermore, the MT values extrapolated here for the intracellular and extracellular compartments are comparable with those reported in the literature for cells(34) and for mature cartilage tissue.(31,32)
NMR MICROSCOPY OF GROWTH PLATE CARTILAGE
Thus, MT might be used as an NMR “stain” for collagen and to monitor cartilage maturational changes during endochondral ossification or other biological processes. The fact that cellularity correlates with the MT effect is an important consideration when studying highly cellular models such as newly developing tissues. In this study, a greater MT effect was found in regions of mineralized PB compared with that in neighboring cartilage regions. This result may be attributed to the fact that bone has a lower water content and higher collagen content relative to articular cartilage (20% vs. 65% and 35% vs. 25%, respectively).(35–37) Alternatively, type I collagen of bone may produce a greater MT effect than type II collagen found in cartilage. Qualitative mineral maps of the chick femur extracted from 3D data sets provided a means of assessing the sequence of events that occur as the growth plate mineralizes. As seen in transverse images at different locations along the length of the femur, marrow tunnels invaded the cartilage and became encapsulated by mineral, producing a meshlike pattern in NMR slice images. The mineral mesh was gradually remodeled to allow progressive growth of the bone. This sequence was consistent with the known progression of bone development in chick limbs.(25,38,39) In applications such as this, NMR imaging might provide additional valuable information about the bone formation processes as well as the impact of therapeutic interventions. This study has examined the correlations between histology and NMR data for a single skeletal site of one species at a specific developmental stage. To show directly that this method is of truly widespread applicability, additional sites, additional species, and different developmental stages would need to be assessed. Further, it would be of particular interest to apply the methods to pathophysiological states. However, we note that the embryonic avian growth plate exhibits features representative of other species and sites, and hence this work may be readily extended to other settings. In conclusion, NMR microscopy has been used successfully to examine embryonic avian long bones and their cartilaginous growth plates. Distinct tissue zones were identified, and their unique NMR parameters were correlated with features observed in histological sections. With these methods of qualitative and quantitative assessment by NMR microscopy, a wide variety of processes in normal and pathological mineralizing connective tissue, including cartilage maturation and endochondral ossification in the postembryonic growth plate, can be studied noninvasively.
ACKNOWLEDGMENTS This work was supported in part by the NIH grant AR 41452 awarded to W.J.L.
REFERENCES 1. Howlett CR 1979 The fine structure of the proximal growth plate of the avian tibia. J Anat 128:377–399.
1099
2. Stocum DL, Davis RM, Leger M, Conrad HE 1979 Development of the tibiotarsus in the chick embryo: Biosynthetic activities of histologically distinct regions. J Embryol Exp Morphol 54:155–170. 3. Roach HI 1997 New aspects of endochondral ossification in the chick: Chondrocyte apoptosis, bone formation by former chondrocytes, and acid phosphatase activity in the endochondral bone matrix. J Bone Miner Res 12:795– 805. 4. Johnson GA, Benveniste H, Black RD, Hedlund LW, Maronpot RR, Smith BR 1993 Histology by magnetic resonance microscopy. Magn Reson Q 9:1–30. 5. Hodgson RJ, Carpenter TA, Hall LD 1992 Magnetic resonance imaging of osteoarthritis. In: Kuettner K (ed.) Articular Cartilage and Osteoarthritis. Raven Press Ltd., New York, NY, USA, pp. 629 – 641. 6. Lewis AR, Nolan MJ, Hodgson RJ, Benjamin M, Ralphs JR, Archer CW, Tyler JA, Hall LD 1996 High resolution magnetic resonance imaging of the proximal interphalangeal joints. Correlation with histology and production of a three-dimensional data set. J Hand Surg [Br] 21:488 – 495. 7. Munasinghe JP, Tyler JA, Hodgson RJ, Barry MA, Gresham GA, Evans R, Hall LD 1996 Magnetic resonance imaging, histology, and x-ray of three stages of damage to the knees of STR/ORT mice. Invest Radiol 31:630 – 638. 8. Dardzinski BJ, Mosher TJ, Li S, Van Slyke MA, Smith MB 1997 Spatial variation of T2 in human articular cartilage. Radiology 205:546 –550. 9. Eckstein F, Sittek H, Milz S, Putz R, Reiser M 1994 The morphology of articular cartilage assessed by magnetic resonance imaging (MRI). Reproducibility and anatomical correlation. Surg Radiol Anat 16:429 – 438. 10. Xia Y, Farquhar T, Burton-Wurster N, Ray E, Jelinski LW 1994 Diffusion and relaxation mapping of cartilage-bone plugs and excised disks using microscopic magnetic resonance imaging. Magn Reson Med 31:273–282. 11. Lu¨sse S, Knauss R, Werner A, Grunder W, Arnold K 1995 Action of compression and cations on the proton and deuterium relaxation in cartilage. Magn Reson Med 33:483– 489. 12. Rubenstein JD, Kim JK, Morova-Protzner I, Stanchev PL, Henkelman RM 1993 Effects of collagen orientation on MR imaging characteristics of bovine articular cartilage. Radiology 188:219 –226. 13. Mlynarik V, Degrassi A, Toffanin R, Vittur F, Cova M, Pozzi-Mucelli RS 1996 Investigation of laminar appearance of articular cartilage by means of magnetic resonance microscopy. Mag Reson Imaging 14:435– 442. 14. Erickson SJ, Waldschmidt JG, Czervionke LF, Prost RW 1996 Hyaline cartilage: Truncation artifact as a cause of trilaminar appearance with fat-suppressed three-dimensional spoiled gradient-recalled sequences. Radiology 201:260 –264. 15. Jaramillo D, Connolly SA, Mulkern RV, Shapiro F 1998 Developing epiphysis: MR imaging characteristics and histologic correlation in the newborn lamb. Radiology 207:637– 645. 16. Jaramillo D, Hoffer FA 1992 Cartilaginous epiphysis and growth plate: Normal and abnormal MR imaging findings. Am J Roentgenol 158:1105–1110. 17. Allegrini PR, van Velzen D, van Loosen J, Bullock GR 1990 Differentiation of proliferating from resting cartilage in human fetal nasal septum by magnetic resonance imaging. Magn Reson Med 14:369 –376. 18. Hajnal JV, Baudouin CJ, Oatridge A, Young IR, Bydder GM 1992 Design and implementation of magnetization transfer pulse sequences for clinical use. J Comput Assist Tomogr 16:7–18. 19. Stejskal EO, Tanner JE 1965 Spin diffusion measurements: Spin echoes in the presence of a time-dependent field gradient. J Chem Phys 42:288 –292.
1100 20. Mills R 1973 Self-diffusion in normal and heavy water in the range 1– 45. J Phys Chem 77:685– 688. 21. Neeman M, Freyer JP, Sillerud LO 1990 Pulsed-gradient spinecho diffusion studies in NMR imaging. Effects of the imaging gradients on the determination of diffusion coefficients. J Magn Reson 90:303–312. 22. Hennig J, Nauerth A, Friedburg H 1986 RARE imaging: A fast imaging method for clinical MR. Magn Reson Med 3:823– 833. 23. Prophet EB, Mills B, Arrington JA, Sobin LH 1992 Laboratory Methods in Histotechnology. American Registry of Pathology, Washington DC, USA. 24. Hunziker EB 1994 Mechanism of longitudinal bone growth and its regulation by growth plate chondrocytes. Microsc Res Tech 28:505–519. 25. Roach HI, Shearer JR 1989 Cartilage resorption and endochondral bone formation during the development of long bones in chick embryos. Bone Miner 6:289 –309. 26. Potter K, Butler J, Horton WE, Spencer RGS 2000 Response of engineered cartilage tissue to biochemical agents as studied by proton MRI microscopy. Arthritis Rheum 43:1580 –1590. 27. Vittur F, Chiara Pugliarello M, Rovis L, De Bernard B 1972 Chick embryo development: Chemical variations of cartilage. J Exp Zool 179:325–330. 28. Tenner MS, Spiller M, Koenig SH, Valsamis MP, Childress S, Brown RD III, Kasoff SS 1995 Calcification can shorten T2, but not T1, at magnetic resonance imaging fields. Results of a relaxometry study of calcified human meningiomas. Invest Radiol 30:345–353. 29. Davis CA, Genant HK, Dunham JS 1986 The effects of bone on proton NMR relaxation times of surrounding liquids. Invest Radiol 21:472– 477. 30. Henkelman RM, Watts JF, Kucharczyk W 1991 High signal intensity in MR images of calcified brain tissue. Radiology 179:199 –206. 31. Kim DK, Ceckler TL, Hascall VC, Calabro A, Balaban RS 1993 Analysis of water-macromolecule proton magnetization transfer in articular cartilage. Magn Reson Med 29:211–215.
POTTER ET AL. 32. Gray ML, Burstein D, Lesperance LM, Gehrke L 1995 Magnetization transfer in cartilage and its constituent macromolecules. Mag Reson Med 34:319 –325. 33. Potter K, Butler JJ, Adams C, Fishbein KW, McFarland EW, Horton WE, Spencer RG 1998 Cartilage formation in a hollow fiber bioreactor studied by proton magnetic resonance microscopy. Matrix Biol 17:513–523. 34. Seo GS, Aoki J, Moriya H, Karakida O, Sone S, Hidaka H, Katsuyama T 1996 Hyaline cartilage: In vivo and in vitro assessment with magnetization transfer imaging. Radiology 201:525–530. 35. Carter DR, Spengler DM 1978 Mechanical properties and composition of cortical bone. Clin Orthop 135:192–217. 36. Poole AR 1993 Cartilage in health and disease. In: McCarthy D, Koopman W (eds.) Arthritis and Allied Conditions: A Textbook of Rheumatology, 12 ed., vol. 1. Lea & Febieger, Philadelphia, PA, USA, pp. 279 –333. 37. Wuthier RE 1969 A zonal analysis of inorganic and organic constituents of the epiphysis during endochondral calcification. Calcif Tissue Res 4:20 –38. 38. Pechak DG, Kujawa MJ, Caplan AI 1986 Morphology of bone development and bone remodeling in embryonic chick limbs. Bone 7:459 – 472. 39. Gaytan F, Ranz FB, Aceitero J 1987 Morphometric study of cartilage dynamics in the chick embryo tibia. I. Methodology and tissue compartments in normal embryos. J Anat 154:63–71.
Address reprint requests to: Richard G.S. Spencer, M.D., Ph.D. Chief, Nuclear Magnetic Resonance Unit NIH/National Institute on Aging Intramural Research Program GRC 4D-08 5600 Nathan Shock Drive Baltimore, MD 21224, USA Received in original form August 14, 2000; in revised form December 27, 2000; accepted January 8, 2001.