Journal of Computer Science & Systems Biology - Open Access www.omicsonline.com
Research Article OPEN ACCESS Freely available online doi:10.4172/jcsb.1000052
JCSB/Vol.3 Issue 2
Homeomorphic Matlab Model of Myopia Development Hung GK1*, Fiedler AJ1, and Ciuffreda KJ2 1 2
Dept. of Biomedical Engineering, Rutgers University, 599 Taylor Road, Piscataway, NJ 08854 Dept. of Vision Sciences, State University of New York, State College of Optometry, 33 W. 42nd St., New York, NY 10036
Abstract A homeomorphic biomechanical model of the eye based on the Incremental Retinal-Defocus Theory (IRDT) was developed to simulate myopic and hyperopic growth under different optical defocus conditions. The IRDT states that the time-integrated reduction in retinal-image defocus magnitude decreases the rate of retinal neuromodulator release, which in turn decreases the rate of proteoglycan synthesis and reduces scleral structural integrity, thus resulting in axial elongation and myopia development. A homeomorphic biomechanical model of the eye was constructed to test the IRDT based only on optical defocus and its resultant contribution to mechanical forces acting on the components of the eye. The Matlab simulation results showed a more flattened oblate shape for myopic defocus, and a more elongated prolate shape with hyperopic defocus. Thus, the homeomorphic biomechanical model of the eye was able to simulate the emmetropization mechanism using only the forces acting on the masses at the nodes. In addition, neurochemicals injected at local retinal regions modified the spring constants to result in predicted changes in ocular deformation. The findings have clinical implications with respect to basic theories of myopia development, as well as future therapeutic use of direct ocular drug delivery to control human myopia.
Biomechanics; Retinal defocus; Drug delivery; Neurochemicals
Introduction As one of our primary sensory modalities, clear vision is a crucial prerequisite for our ability to observe and interact with the environment. In the United States, 42% of the adult population is myopic (Vitale et al., 2009) and up to 75% of the adult population in Taiwan is similarly affected (Lin et al., 1996). While one’s refractive error can be corrected by lenses or surgery, both have drawbacks (Javitt and Chiang, 1994). Surgery is expensive and may lead to long-term physiological side effects such as dry eyes, while spectacles can limit vocational pursuits such as being a pilot or policeman (Grosvenor and Goss, 1999). For decades, scientists have been attempting to understand the biological basis for the development of refractive error. It has long been postulated that excessive nearwork, such as reading or computer viewing, is a significant contributory factor to refractive error development (Goldschmidt, 1968; Ong and Ciuffreda, 1997). In addition, there is a genetic contribution (Pacella et al., 1999) that compounds the influence of nearwork. Because of the observed relationship between nearwork and the development of myopia, the scientific community has devoted significant resources towards understanding and explaining this link (Goldschmidt, 1968; Ong and Ciuffreda, 1997). With a better understanding of the underlying mechanisms involved, it is hoped that a means can be developed to mitigate the effects of nearwork in our technology and information-driven society, and thus improve ocular health. As a step towards an integrated understanding of myopia development, a new homeomorphic, biomechanically-based Matlab model was development based on a theory developed by two of the authors (Hung and Ciuffreda, 2001a; Hung and Ciuffreda, 2001c). The new model has served as a unifying platform for testing and incorporating the various experimental findings, and furthermore to provide a common dialogue among various discipline towards achieving the goal of a deeper and broader understanding of the underlying mechanisms of myopia development.
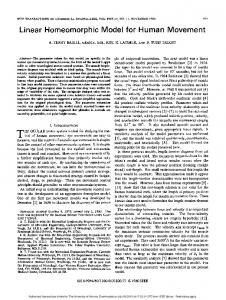
Basic anatomy of the eye The tunic of the eye is formed by three principle layers: the cornea and sclera (which forms an interconnected outer tunic), the choroid, and the retina (Figure 1). The sclera is a collagenous layer with elastic fibers and proteoglycans that provides the structural integrity of the eye (Rada et al., 1997; Moses et al., 1978). Experimental studies have shown that the composition and biomechanical properties of the sclera depend greatly on the visual environment (Rada et al., 2000; McBrien et al., 2009). For example, there is a decrease in the level of proteoglycans
Iris
Retina
Lens Fovea Pupil
Macula
C0rnea Optic Nerve Iris Vitreous gel Figure 1: Basic anatomy of the eye. Adapted from public archives of the National Eye Institute.
*Corresponding authors: Hung GK, Dept. of Biomedical Engineering, Rutgers University, 599 Taylor Road, Piscataway, NJ 08854 , Tel: 732-445-4500, Ext. 6306; Fax: 732-445-3753; E-mail:
[email protected] Received February 17, 2010; Accepted April 07, 2010; Published April 07, 2010 Citation: Hung GK, Fiedler AJ, Ciuffreda KJ (2010) Homeomorphic Matlab Model of Myopia Development. J Comput Sci Syst Biol 3: 030-039. doi:10.4172/ jcsb.1000052 Copyright: © 2010 Hung GK, et al. This is an open-access article distributed under the terms of the Creative Commons Attribution License,which permits unrestricted use, distribution, and reproduction in any medium, provided the original author and source are credited.
Volume 3(2): 030-039 (2010) - 030
lishing Pub Gr CS
p ou
J Comput Sci Syst Biol ISSN:0974-7230 JCSB, an open access journal
Background
OM I
Keywords: Myopia model; Scleral matrix; Spring constant;
Citation: Hung GK, Fiedler AJ, Ciuffreda KJ (2010) Homeomorphic Matlab Model of Myopia Development. J Comput Sci Syst Biol 3: 030-039. doi:10.4172/jcsb.1000052
Beneath the sclera lies the pigmented choroid. The choroid has extensive vascularization and provides nourishment to the retina. Although it consists primarily of blood vessels, there are non-vascular layers at its junction with the retina. The choroid also plays a role in the maintenance of intraocular pressure and temperature regulation (Kiilgaard and Jensen, 2006). Beneath the choroid lies the inner-most layer of the eye, the light-sensitive retina. It is comprised of three layers of nerve cells: the photoreceptor, bipolar cell, and ganglion cell layers. Interposed between the photoreceptor and the bipolar cell layers are the horizontal cells, and interposed between the bipolar and ganglion cell layers are the amacrine cells. The photoreceptors respond to light input and transmit signals to the bipolar cells, which then relay the signal to the ganglion cells. The ganglion cells produce action potentials, which are sent to higher visual centers via the optic nerve. The horizontal and amacrine cells modulate the signal through a center-surround mechanism to process contrast levels and their variations. These signals provide information directly related to retinal defocus that is critical to the regulation of ocular growth (Normann and Guillory, 2002). Light rays entering the eye pass through the two primary refractive regions, the cornea and crystalline lens, to reach the retina. If the light rays are focused beyond on the retina, the eye of a young animal or human is able to adjust the power of the optical system through the accommodative reflex by changing the shape of the crystalline lens. It accomplishes this by contracting the ciliary muscles, which reduces the tension on the zonular fibers attached to the lens. This causes the lens to assume a more spherical shape, thus increasing the optical power of the eye to focus on the nearby object. However, a persistent difference between the focal distance and the axial length, due to either genetics or environmental experience, may cause more permanent changes in the shape of the eyeball that result in permanent myopia.
The development of refractive error There are two main types of refractive error: hyperopia and myopia (Borish, 1970). Hyperopia, or farsightedness, occurs when the overall optical power of the eye in its most relaxed state is less than that required to match the axial length of eye, so that the light rays entering the eye are divergent. Consequently, the image is focused beyond the retina. Conversely, myopia, or nearsightedness, occurs when the overall optical power of the eye exceeds that required for the axial length of the eye. Light rays entering the eye are over-convergent, and the retinal image is focused in front of the retina. During normal ocular development in children and young adults, the axial length of eye must closely match its optical power to ensure that the retinal image is properly focused (Bennett and Rabbetts, 1989; Grosvenor and Goss, 1998). If the eye grows too rapidly, the image will be focused in front of the retina, and the subsequent eye growth will tend to be slower. If the eye grows too slowly, however, the retinal image will be focused behind the retina, and the subsequent eye
Many different theories have been proposed to explain the emmetropization process. An early notion was that higher cortical brain centers in the visual system were responsible for controlling emmetropization, but experimental results showed that the process is peripheral and localized to the eye (Wilsoet and Pettigrew, 1988; Wallman, 1997; Smith et al., 2009). Thus, since emmetropization is a local process, the challenge for biomedical modelers in the past has been to understand how the growth rates of different regions across the retina can synchronize eye growth and shape. Modelers have long believed that the size of the blur circle on any given point in the retina provides the necessary information to determine ocular growth. This is based on research demonstrating that changing the amount of retinal-image contrast, for example, with diffuse occluders or defocusing lenses at a local retinal area, affects the growth of the eye only in that region (Wildsoet and Pettigrew, 1988; Smith et al., 2009). However, the size of the blur circle alone does not provide sufficient information on directionality of the refractive error (i.e., both an over- and under-focused image could have the same blur circle size), as it is an evenerror signal (Stark, 1968). Additionally, because no higher-level cortical process is involved, there must be a mechanism that detects both magnitude and directionality of retinal defocus to control eye growth and refractive development.
The incremental retinal-defocus theory While experimentalists have published numerous studies on the range of visual stimuli that may induce refractive error development (Troilo et al., 1987; Smith and Hung, 1999; Crewther, 2000; Smith and Hung, 2000; Wildsoet and Collins, 2000), theorists have long sought to develop a unifying theory that explains the laboratory findings. One such theory is the Incremental Retinal-Defocus Theory (IRDT) developed by (Hung and Ciuffreda, 2000a; Hung and Ciuffreda, 2000b; Hung and Ciuffreda, 2000c). The IRDT is based on two key insights. First, local retinal-defocus magnitude is critical in the development of environmentally-induced refractive error. Second, development of refractive error occurs primarily during the growth and maturation period up to age 15-18 years (Goss and Winkler, 1983). These two insights led to the main thrust of the IRDT, namely, that during the genetically-preprogrammed growth period, this naturally-occurring change in axial length provides the information to distinguish between hyperopic and myopic defocus, and in turn provides the directionality control necessary for emmetropization to occur. A factor common to both natural eye growth and environmentally-induced eye growth is the neuromodulator (Dowling, 1996). It is a neurochemical, such as dopamine, serotonin, and neuropeptides, that acts over long periods of time Volume 3(2): 030-039 (2010) - 031
lishing Pub Gr CS
p ou
J Comput Sci Syst Biol ISSN:0974-7230 JCSB, an open access journal
growth will tend to be faster. This continuous biological process that attempts to balance optical power and axial growth of the eye is called emmetropization (Yackle and Fitzgerald, 1999). Under repeated exposure to severe optical situations, such as excessive near-work, form deprivation, or optical defocus, the axial growth rate may exceed the capability of the system to attain an emmetropized state (Gottlieb et al., 1987; Wilson et al., 1987; Bradley et al., 1995; Hung et al., 1995; Napper et al., 1995; Kee et al., 2007). This will result in the development of a refractive error.
OM I
in the sclera after either optically-induced myopia (Rada et al., 2000) or form-deprived vision (Troilo et al., 1987), which structurally weakens the sclera and results in vitreous chamber elongation.
Journal of Computer Science & Systems Biology - Open Access
Research Article OPEN ACCESS Freely available online doi:10.4172/jcsb.1000052
www.omicsonline.com
JCSB/Vol.3 Issue 2
to modulate cellular processes. In the retina, neuromodulators are continually being released from specific retinal cells to serve as the baseline control of scleral matrix formation. Environmental factors such a change in retinal defocus provides a signal for modulation of neuromodulator release, with the direction of change in retinal-defocus magnitude modulating neuromodulator release rate. Research has also demonstrated that changes in neuromodulator release cause predicted alterations in the structure of the sclera via modulation of proteoglycan synthesis (Troilo et al., 2006). An increase in proteoglycan synthesis results in greater structural integrity of the sclera. This reduces the sclera’s growth rate in that region, since greater structural integrity is able to resist the outward forces of the internal ocular pressure. Implementation of the IRDT can be illustrated by the following schematic example. Under normal growth rate conditions, there is no change in retinal-defocus magnitude, and hence no change in neuromodulator release rate, no change in proteoglycan synthesis rate, and no change in scleral structural integrity. This results in normal axial growth (Figure 2a). However, if a high-powered minus (or concave) lens is imposed in front of the eye during an increment of genetically-predetermined growth, there is a decrease in retinal-defocus magnitude, and hence a decrease in neuromodulator release rate, a decrease in proteoglycan synthesis rate, and a decrease in scleral structural integrity. This results in a relative increase in axial growth rate (Figure 2b). And, if a high-powered plus (or convex) lens is imposed in front of the eye during an increment of geneticallypredetermined growth, there is now an increase in retinaldefocus magnitude, and hence an increase in neuromodulator release rate, an increase in proteoglycan synthesis rate, and an increase in scleral structural integrity. This results in a relative
0 Lens
__________ ___ ___ _ _ _ _ _ _ _ _ _ ___
___
Material and Methods A homeomorphic biomechanical Matlab model of the Incremental Retinal-Defocus Theory In an attempt to analyze further the implications and feasibility of the Incremental Retinal Defocus Theory, we have developed a homeomorphic, biomechanical model of the mechanics involved in the growth of the eye using MATLAB. The motivation behind this model is to understand how the IRDT-proposed local properties of the retina affect the gross morphology of the eye throughout its development. While other models of refractive error development have focused on the broad, ocular system-wide interactions, in this model we focus on the fundamental fibers of the scleral matrix and consider how changes in retinal defocus levels can alter their local properties. By focusing on these local properties of the scleral matrix that affect growth, we sought to eliminate the presumption of any “top-down” control over the emmetropization process from higher neural processes, as dictated by the IRDT. We also have demonstrated in this model that both the magnitude and directionality of the retinal defocus can be determined through local processes occurring within the retina itself. Additionally, we have demonstrated how local properties acting in concert produced growth patterns like those observed in experimental situations.
Basic assumptions and simplifications The scleral matrix is a deformable, elastic structure that is supported by the outward force of the eye’s intraocular pressure. The matrix provides surface tension by the adhesion of interlocking filaments, thereby counterbalancing the pressure force acting outwards with an elastic, resistive force acting
Normal rate of neuromodulators; Normal growth rate. Dashed lines represent distant light rays. Dotted curves represent growth increments.
Large - Lens
____
__
.... . .
Large + lens __________
____ _ ___ _ _ _ _
. . . . . . . ..
............
__________ ____
. . . . .. ... . . .. . ____ ____
....
__________ ____
(c)
___ __ ___
... ..
(b)
___
___
.. .
(a)
decrease in axial growth rate (Figure 2c).
. . ..
. .. . . . . . . . . . . .. . .
. ..
.. . . . .
_________
Decrease in local blur magnitude; Decrease in rate of neurotransmitters; Decrease in rate of proteoglycan synthesis Increase in axial growth rate relative to normal.
Increase in local blur magnitude; Increase in rate of neuromodulators; Increase in rate of proteoglycan synthesis; Decrease in axial growth rate relative to normal.
. . . ..
Volume 3(2): 030-039 (2010) - 032
lishing Pub Gr CS
p ou
J Comput Sci Syst Biol ISSN:0974-7230 JCSB, an open access journal
OM I
Figure 2: Effect of imposed lenses on axial growth rate. Reprined from Hung and Ciuffreda, (2000c), with permission of Bull. Math. Biol.
Citation: Hung GK, Fiedler AJ, Ciuffreda KJ (2010) Homeomorphic Matlab Model of Myopia Development. J Comput Sci Syst Biol 3: 030-039. doi:10.4172/jcsb.1000052
inwards. Histological studies of the eye have revealed that the sclera is comprised of a dense layer of fibers, primarily parallel to the surface and crossing relatively randomly with respect to direction. In the posterior pole of the eye, these fibers are woven more loosely than those in the anterior (Curtin, 1969) and thus can expand more readily with increased intraocular pressure (Wolff, 1968; Gilmartin et al., 2000; Siegwart and Norton, 1999). In support of this, the regional stress-strain relationships of the sclera show that the posterior pole is only about 60% as stiff as the anterior sclera (Friberg and Lace, 1988).
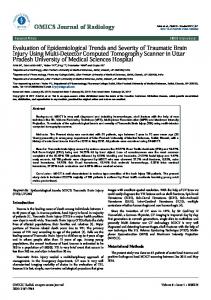
of the model eyeball is determined by displacing the individual nodes based on the sum of forces acting on each node. Each node has the following forces as shown in Figure 3:
To model this system, we represent the scleral matrix as a ring of springs in two dimensions. Each spring has an internal spring force proportional to its length that acts on its two neighboring springs. This corresponds to the scleral matrix of the eye where filaments produce a tensile force as they are stretched by the internal pressure forces in the eye. The internal pressure force is modeled as a force vector acting normal to and outwards from the ring of springs. We add this force vector into the modeling at each spring-to-spring connection, which we call a “node” (see Figure 3).
The net force acting on the node is determined by summing all of these forces. This net force vector changes the direction and magnitude of the node’s acceleration, and in turn the location of the node in the next time period. We used a simple, two-step Euler’ integration algorithm to predict the subsequent positions of the nodes based on its previous position and speed. For each dimension (x and y), there are two integration steps to determine the next position. Using the x-dimension as an example, the total force in the x-direction is calculated. Then, we use this force with an assumed node mass of m = 1 to find the node’s acceleration at time t, xt , as shown in Eq. 2. Using the acceleration and the node’s previous velocity in the x-direction, we approximate the new velocity by Eq. 3, where Δt =tn – tn-1 is a small increment in time.
Fundamental equations and constraints This is a long-term time-course model, where we use the internal forces in the system along with the previous locations of the components to calculate the location and shape of the system in the subsequent time periods. The motion and shape y Fs1,x Fs1,y Fs1
Fp
Fs2
Fs2,y Fs2,x
Linked spring model of the scleral matrix
x
Free body diagram of an individual node
Figure 3: Linked-spring model of the scleral matrix. The left image shows the ring of linked springs we use to model the scleral matrix. Sixteen springs are shown, but 30 nodes are used in actual modeling. The selection of 30 nodes is arbitrary, but this provides sufficient resolution of local contours, while avoiding excessive amounts of computational complexity. The right image shows a free body diagram of one node in the linked spring model. Each node has forces Fs,1 and Fs,2 from it’s two attached springs as well as Fp, an internal ocular pressure force which acts normally to the surface.
å Fx = Fp - Fs1 ,x - Fs2 ,x
xt =
1
m
(1)
å Fx ,t
(2)
x t = x t-1 + xt Dt
(3)
The next integration step uses the newly calculated node velocity (i.e., the movement of the node’s corresponding mass), x , with the previous node position to determine the new position. While in realty, the time course of ocular growth is relatively long and the instantaneous movement of any given point on the sclera matrix is minute, the node’s velocity here can be thought of as the current baseline rate of axial elongation or flattening. Thus, this baseline rate of axial growth multiplied by an increment of time gives a change in position of a point on the sclera, as shown in Eq. 4:
x t = x t-1 + x t Dt
(4)
In addition to the integration method above, we also subject the nodes to constraints in their motion, so that the system remains well-formed. As the nodes move, we check to insure that they remain in their relative positions, and furthermore that none of the springs intersect. Also, we constrain the motion of the nodes so that they do not create indentations (i.e., deflect backwards towards the center of the eyeball). This can occur if, for example, the surface is nearly flat in some portion of the scleral matrix. Both of these constraints were needed to maintain the consistency within the model, so as not to introduce errors that would propagate through the subsequent steps of the numerical integration.
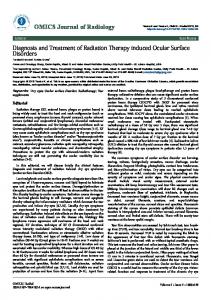
Model control panel The model control panel (Figure 4) allows for change in the various simulation parameters. These include: the angle of light relative to the horizontal (i.e., viewing straight ahead while seated upright), the type of defocus, the angular range of the deformable region, the intraocular pressure, the nominal spring stiffness for the deformable and non-deformable regions, and
Volume 3(2): 030-039 (2010) - 033
lishing Pub Gr CS
p ou
J Comput Sci Syst Biol ISSN:0974-7230 JCSB, an open access journal
In the x-direction, the sum of forces on a node (see Figure 3) can be written as Eq. 1.
OM I
We have, however, neglected visco-elastic properties of the actual scleral matrix, as the time course of ocular growth is very long (i.e., months to years), with changes in the axial length of the viterious chamber possible, even into adulthood (McBrien and Adams, 1997). Additionally, in ocular growth, there are typically no rapid dynamics. This would leave us to believe that the viscoelasticity of the scleral matrix plays a relatively small role in long-term ocular growth. We have also made the simplification of configuring in two dimensions to reduce the complexity in the model simulation and for ease of visualization, while in actuality there are complex threedimensional mechanics at work which may be an area of future research and modeling.
1. The force from each adjacent spring, with the net spring force acting inward 2. The intraocular pressure force acting outward
Journal of Computer Science & Systems Biology - Open Access www.omicsonline.com
JCSB/Vol.3 Issue 2
IRDT Sim ulator Simulation Options Light Angle
Plotting Options
0 degrees
Consolidate Lenses Dot Nodes
Deformable Region +/- 80 degrees Type of Defocus Pressure
C(Normal Growth)
dk1
0 0
Make Movie
Draw retina bounds Notch Focal Point
Nominal
dk2
Research Article OPEN ACCESS Freely available online doi:10.4172/jcsb.1000052
Dra w X Axis Dra w Curve of Deformation Draw Comparative Curve
Movie Name
Loop Oral Intake or Local Injection
90
Select Drug 45
Oral
0
or Local
Dosage
-45
Because infants are born hyperopic, we set the focal length of the overall optical power so that light entering the eye is focused beyond the posterior sclera of the eyeball, which is represented by the connected springs. The normal, genetically preset growth pattern for the eyeball is to increase in axial length as the child matures (from approximately 16 to 25 mm; Sorsby et al., 1961). We model this as an initial intraocular pressure force acting outwards that is greater than the spring forces (scleral tension) acting inwards. As the axial length of the eye increases due to the large outward force of the intraocular pressure, individual nodes will move outwards, reducing the initial hyperopia as they approach the focal plane. This will create a decreasing level of retinal defocus, which is measured as the size of the blur circle where the light cone crosses the retina, as shown in Figure 5. We can also adjust the model by artificially decreasing the focal length of the eye’s total optical power, so that the incoming light is focused in front of the nodes in the retinal region of interest. In this case, an increment in outward movement of the nodes (caused by the relatively high Light Angle: The angle of the incoming light rays relative to the eye’s straightahead direction
Select Dosage -90 Description of Terms
Deformable Region: Region of the eye that is deformed due to either refractive er neurochemical
Light Angle: The angle of the incomign light rays relative to the horizontal
Chase Ratio: A sequence of light rays during simulation that induces myopic or hyperopic defocus
Deformable Region: Region of the eye thet is deformed due to r efractive errors or r
Pressure: Intraocular pressure within the eye
Chase Ratin: A chese sequence of light rays during simulation that induces myopic
dk1: Percent change in k1 for deformable nodes (normal value of dk1 = 10)
Pressure: intraoccular pre ssure within the eye
dk2: Percent change in k1 for non-deformable nodes (normal value of dk2 = 10)
dk1: Percent chenge in k1 for deformable nodes (nominal value of k1 = 10)
Plotting Options: Consolidate Lenses: Consolidates lenses acting on the individual nodes into a single lens
Simulate Pause
Dot Nodes: Plots the nodes to better visualize the nodes-springs model Draw Retina Boundaries: Draws the bounds of the retina undergoing deformation
Stop Simulation
Notch Focal Points: Draw a vertical line segment at the focal point
Figure 4: Model control panel.
the type of neurochemical or drug and its dosage. For injection of a virtual neurochemical, each of nine posterior regional locations spanning +/- 90 deg can be selected for injection with a virtual neurochemical, while a selection of “oral”, or systemic intake, is represented by the selection of all nine posterior locations simultaneously. Also included are plotting options, an option to make a video of the simulation sequence, and an option to display the simulation in a repeated loop. In addition, there is a “Description of Terms” section (Table 1).
Draw X Axis: Draws the X axis through the plot Draw Curve of Deformation: Draws a function that fits the deformed region Draw Comparative Curve: Draws a function that fits an undeformed region
Table 1: Description of Terms (in Model Control Panel). (1) Strongly anti-myopigenic:
dopamine
(Stone et al., 1989)
7-methylxanthine (Trier et al., 2008) (2) Moderately anti-myopigenic: retinoic acid
(McFadden and Wallman, 2006)
The neurochemicals or drugs and their potential myopigenic or antimyopigenic effects are presented in Table 2.
atropine
(Schmid and Wildsoet, 2004)
apomorphine
(Schmid and Wildsoet, 2004)
Modeling the optical interactions
pirenzepine
(Siatkowski et al., 2008)
(3) Weakly anti-myopigenic:
glucagons
(Vessey et al., 2005)
(4) Slightly myopigenic
timolol
(Vasudevan et al., 2009)
(5) Moderately myopigenic:
TGF-
(Jobling et al., 2008)
(6) Strongly myopigenic:
insulin
(Feldkaemper et al., 2009)
Volume 3(2): 030-039 (2010) - 034
lishing Pub Gr CS
p ou
J Comput Sci Syst Biol ISSN:0974-7230 JCSB, an open access journal
Table 2: Selectable neurochemicals or drugs.
OM I
To simplify the model, the optical power of the corneacrystalline lens combination is replaced by a lens having a single optical power. The externally imposed lens power can be varied, so that the total optical power (cornea-crystalline lens plus imposed external lens) varies over a range of minus to plus dioptric values depending on either the selection of hyperopic or myopic defocus, respectively.
Citation: Hung GK, Fiedler AJ, Ciuffreda KJ (2010) Homeomorphic Matlab Model of Myopia Development. J Comput Sci Syst Biol 3: 030-039. doi:10.4172/jcsb.1000052
Results
Rear view of blur circle
Hyperopic Defocus
Rear view of blur circle
Original Boundary Boundary after an increment in growth Figure 5: Change in blur circle size following an increment in axial growth. The solid eye ball boundary indicates the original boundary of the sclera, the dashed boundary indicates the boundary after an increment in ocular growth. Dots on the boundaries indicate the positions of nodes in the retinal region of interest. For myopic defocus (focal plane located in front of the retina), incremental changes in growth result in increased blur circle size at nodes in the retinal region. For hyperopic defocus (focal plane located behind the retina), incremental changes in growth result in increased blur circle size. Based on the principles of the IRDT, hyperopic defocus will cause myopia due to excessive axial growth, while myopic defocus will cause relative hyperopia due to relatively reduced growth.
intraocular pressure forces) will result in an increase in the size of the blur circle, as shown in Figure 5. To modulate the strength of the scleral matrix, the simulation program monitors the change in blur circle size produced by incremental movements of the nodes. The biological analog to this process is the baseline level of neurotransmitters released by the amacrine cells of the retina. This baseline is determined by the retinal-image contrast at a specific region. As the contrast level changes, the neurotransmitter release rate is modulated relative to its baseline level. This change in neurotransmitter levels alters the stiffness of the scleral matrix either by increasing or decreasing the proteoglycan synthesis rate. In our model, a change in blur circle size at an individual node causes a proportional change in the spring constants of the two springs attached to that node. This, in turn, affects the spring forces acting on the node, thereby resulting in a net increase in spring force for an increase in blur circle size or a net decrease in spring force for a decrease in blur circle size. In effect, the change in blur circle size during an increment of genetically pre-programmed growth is providing information on the directionality of retinal defocus. An increase in blur circle size will occur if the focal point lies in front of the retina, thus signaling that the light cone is diverging and that axial length of the eye ball is too long for accurate focus. The local retinal response to this is an increase in proteoglycan synthesis, which leads to a stiffening of the retina and relatively reduced axial growth. Conversely, a decrease in blur circle size signals an excessively short axial length, and results in the opposite local retinal response causing a relative increase in the axial growth.
For these simulations, all other variables remained constant. A few simplifications were made for plotting clarity, including the use of dashed lines to indicate relative weakening and thickened lines to indicate relative strengthening of the sclera. Also, the boundaries of the overall light-cone are plotted to help visualize the blur circle and location of the focal points. Figure 6 shows the freeze-frame simulation results taken during the growth of the eye. For hyperopic growth (left), light entering the eye is focused in front of the retina, with increments in growth producing an increase in blur circle size, and in turn a relative strengthening of the posterior sclera. The stiffer posterior sclera creates a stronger force offsetting the internal ocular pressure, thus resulting in relatively reduced axial elongation and a more oblate spheroid shape (Singh et al., 2006). In the case of myopic
Time course simulation of refractive error development
A
B
C
Hyperopia Development Indicates relative strengthening
Myopia Development - - - Indicates relative weakening
Figure 6: Simulated hyperopic and myopic development (corresponding to myopic and hyperopic defocus, respectively), exported from the Matlab simulations. Frames A, B, and C show time course simulation of eye growth. For hyperopic growth (left), light entering the eye is focused in front of the retina, with increments in growth causing an increase in blur circle size and in turn a relative strengthening of the posterior sclera. The stiffer poster sclera creates a stronger force offsetting the internal ocular pressure, thus resulting in relatively reduced axial growth. In the case of myopic growth (right), the situation is reversed, where light entering the eye is focused far behind the retina, with increments of growth causing a decrease in blur circle size. This, in turn, weakens the poster sclera, resulting in less resistance to internal ocular pressure and a relative increase in axial length.
Volume 3(2): 030-039 (2010) - 035
lishing Pub Gr CS
p ou
J Comput Sci Syst Biol ISSN:0974-7230 JCSB, an open access journal
Eye growth was simulated for three cases of retinal defocus: normal growth, where the image is focused on the retina; myopic (or excessive) growth, where the image is focused behind the retina; and hyperopic (or reduced) growth, where the image is focused in front of the retina. Here the distinction must be made between hyperopic growth and hyperopic defocus (and likewise myopic growth versus myopic defocus). Hyperopic defocus refers to the optical condition in which the image is focused behind the retina, thus producing axial elongation and myopia. Myopic defocus refers to the optical condition in which the image is focused in front of the retina, thus producing reduced axial growth and hyperopia. By adjusting the level of retinal defocus, the model responds with different growth patterns similar to those observed in laboratory experiments.
OM I
Myopic Defocus
Journal of Computer Science & Systems Biology - Open Access
Research Article OPEN ACCESS Freely available online doi:10.4172/jcsb.1000052
www.omicsonline.com
JCSB/Vol.3 Issue 2 consistent with previous experimental results (Smith and Hung, 1999).
growth (right), the situation is reversed, where light entering the eye is focused far behind the retina, with increments in growth producing a decrease in blur circle size. This, in turn, weakens the posterior sclera, thereby resulting in less resistance to internal ocular pressure and an increase in axial length, and thus a more prolate spheroid shape (Singh et al., 2006). This is
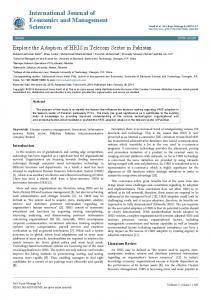
An additional set of simulations was performed, where a virtual neurochemical was injected locally to counteract the effect of the retinal defocus. For example, if dopamine, a IRDT Simulator
ure 2 Edit View Insert Tools Desktop
Window Help
Simulation Options Light Angle
Plotting Options
0 degrees
Consolidate Lenses Dot Nodes
Deformable Region +/- 80 degrees Type of Defocus
20
Pressure
60
Dr aw retina bounds
F(hyperopic defo ...
Notch Focal Point
Nominal
Draw X Axis
0
dk1 dk2
Draw Curve of Deformation
0
15 Make Movie
Draw Comparative Curve
Movie Name
Loop
50
10
Oral Intake or Local Injection DOPAMINE
90
Strongly anti-myopigenic... 45
5
40 Oral
Dosage
0 30
0
or Local
-45
Large -90 Description of Terms
-5
Light Angle: The angle of the incomign light rays relative to the horizontal
20 -10
Deformable Region: Region of the eye that is deformed due to refractive errors or r Chase Ratio: A chase sequence of light rays during simulation that induces myopic Pressure: intraoccular pressure within the eye dk1: Percent chenge in k1 for deformable nodes (nominal value of k1 = 10)
10
-15 Frame 135 -20 -20
Simulate Pause
-15
-10
-5
0
5
10
15
20 Stop Simulation
Figure 7a: Simulation for dopamine (strongly anti-myopigenic) injected at the upper right quadrant with concurrent optical hyperopic defocus across the posterior globe (myopigenic). Color coded for spring constant: blue (large), red (intermediate), and yellow (small).
IRDT Simulator
ure 3 Edit View Insert Tools Desktop
Window Help
Simulation Options Light Angle
Plotting Options Consolidate Lenses
0 degrees
Dot Nodes
Deformable Region +/- 80 degrees Type of Defocus
20
Dr aw retina bounds
B(myopic defo cu...
Notch Focal Point
Pressure
60
dk1 dk2
Nominal Draw X Axis
0
Draw Curve of Deformation
0
15
Draw Comparative Curve Make Movie
Movie Name
Loop
50
10
Oral Intake or Local Injection
90 45
5
40 Oral
Dosage
0 30
0
or Local
-45
Medium -90 Description of Terms
-5
Light Angle: The angle of the incomign light rays relative to the horizontal
20
Deformable Region: Region of the eye that is deformed due to refractive errors or r Chase Ratio: A chese sequence of light rays during simulation that induces myopic
-10
Pressure: intraoccular pressure within the eye dk1: Percent change in k1 for deformable nodes (nominal value of k1 = 10)
10
-15 Frame 58
-20 -20
-15
Simulate
-10
-5
0
5
10
15
20
Pause Stop Simulation
Volume 3(2): 030-039 (2010) - 036
lishing Pub Gr CS
p ou
J Comput Sci Syst Biol ISSN:0974-7230 JCSB, an open access journal
OM I
Figure 7b: Simulation for insulin (strongly myopigenic) is injected at the upper right quadrant with concurrent optical myopic defocus across the posterior globe (antimyopigenic). Same color code as in 7a above.
Citation: Hung GK, Fiedler AJ, Ciuffreda KJ (2010) Homeomorphic Matlab Model of Myopia Development. J Comput Sci Syst Biol 3: 030-039. doi:10.4172/jcsb.1000052
Discussion The Matlab Model of Myopia Development simulation results support the fundamental concepts underlying the IRDT. The model configuration of interconnected springs only required information related to the change in retinal defocus at the local nodes to modify the stiffness of the attached springs, and in turn the local deformations of the globe. No higher brain center signals were involved. Moreover, the model simulations were free running (i.e., without investigator intervention), depending only on retinal defocus information and the simulated intraocular pressure to drive the resulting shape of the globe. The resulting changes in ocular deformation are consistent with the previous experimental finding (Gottlieb et al., 1987). The local injection of neurochemicals provides additional signals modulating ocular growth. These neurochemicals have been shown experimentally to affect ocular growth in very specific ways. In the model simulations, this provides a means to either reduce or accentuate the rate of ocular growth at different points of the globe, which can be done quite precisely. Thus, the advantage of the model is to be able to perform rapid simulations to test hypotheses dealing with retinal defocus and ocular growth effects without the use of animals. It should be noted that there is still much that is not known about the precise mechanisms by which the neurochemicals eventually lead to the change in ocular growth. It may involve cascades of neuro-chemical actions, or even parallel or local feedback processes. Nevertheless, what is common among them is their eventual effects on scleral stiffness. Thus, the model bypasses the details of the neuro-chemical processes, and makes a direct link from the introduction of the neurochemical to the change in scleral stiffness, which corresponds to the stiffness of the springs in the model. In future versions of the model, the effects of these neurochemical processes can be incorporated as intermediate steps linking the injection to its final effect on scleral stiffness. Over the past several decades, there have been numerous clinical approaches to the treatment of myopia (Ong and Ciuffreda, 1997; Rosenfield and Gilmartin, 1998). These have included eye drops to reduce axial elongation by direction biochemical action in the scleral matrix (e.g., with atropine or pirenzepine), corneal refractive surgery and corneal molding with contact lenses to alter the overall power of the eye to match it more closely to its axial length, ergonomically-applied nearwork modifications such as more frequent rest periods combined with far gaze to prevent the occurrence of nearworkinduced transient myopia (NITM) which has been linked to
The present MATLAB model allows one to “perform” a range of experiments incorporating a full array of options without having to spend months or even years studying either animals or humans in the laboratory to assess the effect of either retinal defocus, a key myopigenic factor, or anti-myopic drug agents, with both being critical to the present and future treatment of human myopia. Based on these model findings, drug treatment for human myopia could be initiated. Such novel clinical treatment notions date back at least 25 years (see Ong and Ciuffreda, 1997, for a review), and only now begin to approach reality. While either direct injections into the posterior sclera of the eye would have obvious problems especially in young children, such as causing pain and fright, the use of a nightly applied topical agent in the form of an eye drop or cream, or a more diffuse oral dosage, would be more acceptable, assuming it can reach the targeted scleral region without too much diffusion. This would be accompanied with frequent vision examinations, which would include A-scan ultrasound to assess axial length of the eye, objective measurement of refractive error and accommodative responsivity, and perhaps even a blood sample to quantify the level of the treatment drug and the biochemical status of the marker collagen in the body and sclera.
Summary Over the past two decades, researchers have developed a more comprehensive and detailed understanding of the importance of retinal defocus in the emmetropization process (Hung et al., 1995; Smith and Hung, 2000), as well as its localized nature (Wilsoet and Pettigrew, 1988). Expanded research into the biomechanical properties and constituency of the sclera, including modulators of proteoglycan synthesis (Rada et al., 2000) will lead to further improvements in theories and models of ocular growth. Emmetropization now appears to be governed by a relatively simple mechanism, which has been described by our newly proposed Incremental Retinal-Defocus Theory (Hung and Ciuffreda, 2000a; Hung and Ciuffreda, 2000b; Hung and Ciuffreda, 2000c). Thus, this unifying theory provides an understanding of the basic underlying retinal mechanism for detecting blur magnitude, and furthermore explains how the neurochemical signal is processed to modulate the rate of eye growth, and in turn the resultant development of axial myopia. A homeomorphic biomechanical Matlab model was developed to simulate these processes. The simulation results show a more oblate shape for myopic defocus, and a more prolate shape with hyperopic defocus, which is consistent with human laboratory imaging findings (Singh et al., 2006). In addition, the intoduction of specific neurochemicals could be demonstrated to modulate the genetically-driven aspect of ocular growth. This has far reaching clinical implications in human myopia control. Volume 3(2): 030-039 (2010) - 037
lishing Pub Gr CS
p ou
J Comput Sci Syst Biol ISSN:0974-7230 JCSB, an open access journal
permanent myopia via the mechanism of chronic retinal defocus, and vision therapy (Ciuffreda, 2002) and/or nearpoint spectacle lenses (Jiang et al., 2008) to improve accommodative accuracy to again reduce the amount of chronic retinal defocus which is believed to be myopigenic. Although all of these approaches have appeared to work to some extent, there still remains a desire to understand the process of myopia development more fully and eventually to fine the ‘panacea’, a lofty goal.
OM I
strongly anti-myopigenic neurochemical (Stone et al., 1989), is injected at the upper right quadrant of the eye, it will oppose the myopigenic effect of the hyperopic defocus (Figure 7a). This will result in relatively reduced axial growth in that region. Similarly, if retinoic acid, a strongly myopigenic neurochemical (McFadden and Wallman, 2006), is injected at the upper right quadrant of the eye, it will oppose the anti-myopigenic effect of myopic defocus (Figure 7b). This will result in relatively increased axial growth in that region. Thus, both simulation responses showed the expected distorted shapes based on the effects of change in retinal defocus and neurochemicals on the spring constant of the springs near the affected nodes.
Journal of Computer Science & Systems Biology - Open Access www.omicsonline.com
JCSB/Vol.3 Issue 2
Thus, the model is able to provide responses to a variety of stimulus conditions, some of which have not yet been performed experimentally. This provides a basis for experimental tests to verify and further refine the model. Overall, this Matlab model can serve as a unified foundation for continued exploration into the underlying mechanism of human myopia development. References 1. Bennett AG, Rabbetts RB (1989) Clinical Visual Optics, ButterworthHeinemann. Woburn, MA 75. » CrossRef » PubMed » Google Scholar 2. Borish IM (1970) Clinical Refraction. Professional Press IL.
Research Article OPEN ACCESS Freely available online doi:10.4172/jcsb.1000052
» CrossRef » PubMed
» Google Scholar
3. Bradley DV, Fernandes A, Tigges M, Boothe RG (1996) Diffuser contact lenses retard axial elongation in infant Rhesus monkey. Vis Res 36: 509-514. » CrossRef » PubMed » Google Scholar
4. Ciuffreda KJ (2002) The scientific basis for and efficacy of optometric vision therapy in non-strabismic accommodative and vergence disorders. Optometry 73: 735-762. » CrossRef » PubMed » Google Scholar 5. Crewther DP (2000) The role of photoreceptors in the control of refractive state. Prog Retinal Eye Res 19: 421-457. » CrossRef » PubMed » Google Scholar
23. Kee CS, Hung LF, Qiao-Grider Y, Ramamirtham R, Winawer J, et al. (2007) Temporal constraints on experimental emmetropization in infant monkeys. Invest Ophthal Vis Sci 48: 957-962. » CrossRef » PubMed » Google Scholar 24. Kiilgaard JF, Jensen PK (2006) The choroid and optic nerve head. Advances in Organ Biology 10: 273-290. » CrossRef » PubMed » Google Scholar 25. Lin LLK, Shih YF, Hung PT, Hou PK (1996) Changes in ocular refraction and its components among medial students-a 5- Year longitudinal study. Optom Vis Sci 73: 495-498. » CrossRef » PubMed » Google Scholar 26. McBrien NA, Adams DW (1997) A longitudinal investigation of adult-onset and adult-progression of myopia in an occupational group: Refractive and biometric findings. Invest Ophthal Vis Sci 38: 321-333. » CrossRef » PubMed » Google Scholar 27. McBrien NA, Jobling AI, Gentle A (2009) Biomechanics of the sclera in myopia: extracellular and cellular factors. Optom Vis Sci 86: E23-E30. » CrossRef » PubMed » Google Scholar
28. McFadden SA, Howlett MH, Mertz JR, Wallman J (2006) Acute effects of dietary retinoic acid on ocular components in the growing chick. Exp Eye Res 83: 949-961. » CrossRef » PubMed » Google Scholar 29. Moses RA, Grodzki WJ, Starcherd BC, Galione MJ (1978) Elastic content of the scleral spur, trabecular meshwork, and sclera. Invest Ophthalmol Vis Sci 17: 817-818. » CrossRef » PubMed » Google Scholar
6. Curtin BJ (1969) Physiopathologic aspects of scleral stress-strain. Trans Am Ophthalmol Soc 67: 417-461. » CrossRef » PubMed » Google Scholar
30. Napper GA, Brennan NA, Barrington M, Squires MA, Vessey GA, et al. (1995) The duration of normal visual exposure necessary to prevent form deprivation myopia in chicks. Vis Res 35: 1337-1344. » CrossRef » PubMed » Google Scholar
7. Dowling JE (1996) Retinal processing of vision, in Comprehensive Human Physiology: From Cellular Mechanisms to Integration. Springer-Verlag 1: 773778. » CrossRef » PubMed » Google Scholar
31. Normann RA, Guillery KS (2002) Anatomy and physiology of the retina, in: G.K. Hung and K.J. Ciuffreda (Eds.), Models of the Visual System. Kluwer Academic/Plenum Publishers 109-145. » CrossRef » PubMed » Google Scholar
8. Feldkaemper MP, Neacsu I, Schaeffel F (2009) Insulin acts as a powerful stimulator of axial myopia in chicks. Invest Ophthal Vis Sci 50: 13-23. » CrossRef
32. Ong E, Ciuffreda KJ (1997) Accommodation, Nearwork, and Myopia. Optometric Extension Program Foundation Santa Ana, CA 76-96, 177-201. » CrossRef » PubMed
» PubMed » Google Scholar
9. Friberg TR, Lace JW (1988) A comparison of the elastic properties of human choroids and sclera. Exp Eye Res 47: 429-436. » CrossRef » PubMed » Google Scholar 10. Gilmartin B, Logan NS, Singh KD (2008) In vivo comparison of anterior and posterior ocular volume in human ametropia. Invest Ophthal Vis Sci Suppl 49: 3582. » CrossRef » PubMed » Google Scholar 11. Goldschmidt E (1968) On the etiology of myopia – an epidemiological study. Acta Ophthalmol 98: 1-72. » CrossRef » PubMed » Google Scholar
» Google Scholar
33. Pacella R, McLellan J, Grice K, Del Bono EA, Wiggs JL, et al. (1999) Role of genetic factors in the etiology of juvenile-onset myopia based on a longitudinal study of refractive error. Optom Vis Sci 76: 381-386. » CrossRef » PubMed » Google Scholar
34. Rada JA, Achen VR, Perry CA, Fox PW (1997) Proteoglycans in the human sclera: evidence for the presence of aggrecan. Invest Ophthalmol Vis Sci 38: 1740-1751. » CrossRef » PubMed » Google Scholar
12. Goss DA, Winkler RL (1983) Progression of myopia in youth: age of cessation. Am J Physiol Opt 60: 651-658. » CrossRef » PubMed » Google Scholar
35. Rada JA, Nickla DL, Troilo D (2000) Decreased proteoglycan synthesis associated with form deprivation myopia in mature primate eyes. Invest Ophthalmol Vis Sci 41: 2050-2058. » CrossRef » PubMed » Google Scholar
13. Gottlieb MD, Fugate-Wentzek L, Wallman J (1987) Different visual deprivations produce different ametropias and different eye shapes. Invest Ophthalmol Vis Sci 28: 1225-1235. » CrossRef » PubMed » Google Scholar
36. Rosenfield M, Gilmartin B (1998) Myopia and Nearwork. ButterworthHeinemann, Boston, MA. » CrossRef » PubMed » Google Scholar
14. Grosvenor T, Goss DA (1998) Role of the cornea in emmetropia and myopia. Optom Vis Sci 75: 132-145. » CrossRef » PubMed » Google Scholar 15. Grosvenor T, Goss DA (1999) Clinical Management of Myopia, ButterworthHeinemann. Boston MA 49-62. » CrossRef » PubMed » Google Scholar
37. Siatkowski RM, Cotter SA, Crokett RS, Miller JM, Novack GD, et al. (2008) Two-year multicenter, randomized, double-masked, placebo-controlled, parallel safety and efficacy study of 2 % pirenzepine ophthalmic gel in children with myopia. J Am Assoc Pediatric Ophthalmol Strabismus 12: 332-339. » CrossRef » PubMed » Google Scholar
16. Hung GK, Ciuffreda KJ (2000a) Differential retinal-defocus magnitude during eye growth provides the appropriate direction signal. Med Sci Monitor 6: 791795. » CrossRef » PubMed » Google Scholar
38. Siegwart JT Jr, Norton TT (1999) Regulation of the mechanical properties of tree shrew sclera by the visual environment. Vis Res 39: 387-407. » CrossRef
17. Hung GK, Ciuffreda KJ (2000b) Quantitative analysis of the effect of near lens addition on accommodation and myopigenesis. Cur Eye Res 20: 293-312.
39. Schmid KL, Wildsoet CF (2004) Inhibitory effects of apomorphine and atropine and their combination on myopia in chicks. Optom Vis Sci 81: 137-147. » CrossRef
18. Hung GK, Ciuffreda KJ (2000c) A unifying theory of refractive error development. Bull Math Biol 62: 1087-1108. » CrossRef » PubMed » Google Scholar 19. Hung LF, Crawford JLJ, Smith E (1995) Spectacle lenses alter eye growth and the refractive status of young monkeys. Nature Med 1: 761-765. » CrossRef » PubMed » Google Scholar
20. Javitt JC, Chiang YP (1994) The socioeconomic aspects of laser refractive surgery. Arch Ophthalmol 112: 1526-1530. » CrossRef » PubMed » Google Scholar 21. Jiang BC, Bussa S, Tea YC, Seger K (2008) Optimal dioptric value of near addition lenses intended to slow myopic progression. Optom Vis Sci 85: 11001105. » CrossRef » PubMed » Google Scholar 22. Jobling AI, Wan R, Gentle A, Bui BV, McBrien NA (2008) Retinal and choroidal TGF-β in the tree shrew model of myopia: Isoform expression, activation and effects on function. Expt Eye Res 88: 458-466. » CrossRef » PubMed » Google Scholar
41. Smith EL, Huang J, Hung LF, Blasdel TL, Humbird TL, et al. (2009) Hemiretinal form deprivation: evidence for local control of eye growth and refractive development in infant monkeys. Invest Ophthalmol Vis Sci 50: 5057-5069. » CrossRef » PubMed » Google Scholar
42. Smith EL, Hung LF (1999) The role of optical defocus in regulating refractive development in infant monkeys. Vis Res 39: 1415-1435. » CrossRef » PubMed » Google Scholar
43. Smith EL, Hung LF (2000) Form-deprivation in monkeys is a graded phenomenon. Vis Res 40: 372-381. » CrossRef » PubMed » Google Scholar 44. Sorsby A, Benjamin B, Sheridan M (1961) Refraction and Its Components
Volume 3(2): 030-039 (2010) - 038
CS
lishing Pub G
r p ou
J Comput Sci Syst Biol ISSN:0974-7230 JCSB, an open access journal
» PubMed » Google Scholar
40. Singh KD, Logan NS, Gilmartin B (2006) Three-dimensional modeling of the human eye based on magnetic resonance imaging. Invest Ophthal Vis Sci 47: 2272-2279. » CrossRef » PubMed » Google Scholar
OM I
» CrossRef » PubMed » Google Scholar
» PubMed » Google Scholar
Citation: Hung GK, Fiedler AJ, Ciuffreda KJ (2010) Homeomorphic Matlab Model of Myopia Development. J Comput Sci Syst Biol 3: 030-039. doi:10.4172/jcsb.1000052
45. Stark L (1968) Neurological Control Systems, Studies in Bioengineering. Plenum Press 205-219. » CrossRef » PubMed » Google Scholar 46. Stone RA, Lin T, Laties AM, Iuvone PM (1989) Retinal dopamine and formdeprivation myopia. Proceedings of National Academy of Sciences 86: 704706. » CrossRef » PubMed » Google Scholar 47. Trier K, Ribel-Madsen SM, Cui D, Christensen SB (2008) Systemic 7-methylxanthine in retarding axial eye growth and myopia progression: a 36-month pilot study. J Ocular Biol Disease and Informatics 1: 85-93. » CrossRef » PubMed » Google Scholar
48. Troilo D, Gottlieb MD, Wallman J (1987) Visual Deprivation causes myopia in chicks with optic nerve section. Cur Eye Res 6: 993-999. » CrossRef » PubMed » Google Scholar
49. Troilo D, Nickla DL, Mertz JR, Rada JA (2006) Change in the synthesis rates of ocular retinoic acid and scleral glycosaminoglycan during experimentally altered eye growth in Marmoset. Invest Ophthalmol Vis Sci 47: 1768-1777. » CrossRef » PubMed » Google Scholar
50. Vasudevan V, Ciuffreda KJ, Gilmartin B (2009) Sympathetic Inhibition of Accommodation after Sustained Nearwork in Subjects with Myopia and Emmetropia. Invest Ophthal Vis Sci 50: 114-120. » CrossRef » PubMed » Google Scholar
» CrossRef » PubMed » Google Scholar
52. Vitale S, Sperduto RD, Ferris FC 3rd (2009) Increased prevalence of myopia in the U.S. between 1971-1972 and 1999-2004. Arch Ophthalmol 127: 16321639. » CrossRef » PubMed » Google Scholar 53. Wallman J (1997) Can myopia be prevented? 14th Biennial Research to Prevent Blindness Science Writers Seminar in Ophthalmology. Research to Prevent Blindness 50-52. 54. Wildsoet CF, Collins MJ (2000) Competing defocus stimuli of opposing sign produce opposite effects in eyes with intact and sectioned optic nerves in the chick. Invest Ophthalmol Vis Sci 41: S738. » CrossRef » PubMed » Google Scholar 55. Wildsoet CF, Pettigrew JD (1988) Experimental myopia and anomalous eye growth patterns unaffected by optic nerve section in chickens: Evidence for local control of eye growth. Clin Vis Sci 3: 99-107. » CrossRef » PubMed » Google Scholar 56. Wilson JR, Fernandes A, Chandler CV, Tigges M, Boothe RG, et al. (1987) Abnormal Development of the axial length of aphakic monkey eyes. Invest Ophthalmol Vis Sci 28: 2096-2099. » CrossRef » PubMed » Google Scholar 57. Wolff E (1968) Anatomy of the Eye and Orbit, W. B. Saunders & Co., Philadelphia, PA 49-67. » CrossRef » PubMed » Google Scholar 58. Yackle K, Fitzgerald DE (1999) Emmetropization: an overview. J Behav Optom 10: 38-43. » CrossRef » PubMed » Google Scholar
Volume 3(2): 030-039 (2010) - 039
lishing Pub Gr CS
p ou
J Comput Sci Syst Biol ISSN:0974-7230 JCSB, an open access journal
51. Vessey KA, Rushforth DA, Stell WK (2005) Glucagon- and secretin-related peptides differentially alter ocular growth and the development of formdeprivation myopia in Chicks. Invest Ophthalmol Vis Sci 46: 3932-3942.
OM I
During the Growth of the Eye from the Age of Three. Memo Med Res Counc 301:1-67. » CrossRef » PubMed » Google Scholar