web anomaly detection system is presented which analyzes the. POST and GET ...... anomaly intrusion detection,â IEEE Network, vol. 23, no. 1,. 2009, pp. 42â47.
IJCSI International Journal of Computer Science Issues, Vol. 8, Issue 5, No 2, September 2011 ISSN (Online): 1694-0814 www.IJCSI.org
Host-based Web Anomaly Intrusion Detection System, an Artificial Immune System Approach Iman Khalkhali1, Reza Azmi2, Mozhgan Azimpour-Kivi1 and Mohammad Khansari3 1
School of Engineering and Science, Sharif University of Technology-International Campus Kish Island, Iran 2 Department of Computer Engineering, Alzahra University Tehran, Iran 3 Departmen of Network Science and Technology, Faculty of New Science and Technology, University of Tehran
Abstract Recently, the shortcomings of current security solutions in protecting web servers and web applications against web-based attacks have encouraged many researchers to work on web intrusion detection systems (WIDSs). In this paper, a host-based web anomaly detection system is presented which analyzes the POST and GET requests processed and logged in web servers’ access log files. A special kind of web access log file is introduced which eliminates the shortcomings of common log files for defining legitimate users’ sessions boundaries. Different features are extracted from this access log file in order to model the operations of the system. For the detection task, we propose the use of a novel approach inspired by the natural immune system. The capability of the proposed mechanism is evaluated by comparing the results to some well-known neural networks. The results indicate high ability of the immune inspired system in detecting suspicious activities. Keywords: Host-based Web Anomaly IDS, Enhanced Custom Log File, Artificial Immune System, Negative Selection Algorithm, Neural Network.
1. Introduction Nowadays, the World Wide Web (WWW) plays an important role in human life. Web applications are becoming increasingly popular in all aspects of human activities; ranging from science and business to entertainments. Consequently, web servers and web application are becoming the major targets of many attacks. Due to the growing number of computer crimes, needs for techniques that can secure and protect web servers and web applications against malicious attacks have been highlighted. Unfortunately, current security solutions, operating at network and transport layers, have insufficient capabilities in providing acceptable level of protection against web-based attacks. These issues have given rise to the ever evolving researches on web intrusion detection systems (WIDSs).
A WIDS dynamically monitors the input requests to the web server in order to decide whether a given set of requests is indicative of an attack or represents a normal web surfing activity. As the web servers record all the requests processed by them in access log files, these files could be considered as a major source of information that can be analyzed by WIDS. In order to detect web-based attacks, intrusion detection systems (IDSs) can be prepared with number of patterns of well-known attacks. These systems are called signature detection systems. Signature based IDSs typically require a signature to be defined for every possible attacks that can be performed by an attacker. Moreover, the set of signatures should be updated periodically in order to keep the system reliable. Although these systems can effectively detect known intrusion attempts, they are unable to detect novel attacks. Hence, these systems are vulnerable to zero-days attacks. To overcome the shortcomings of signature based IDSs, anomaly detection systems are proposed for detecting unknown attacks. The anomaly based WIDSs try to build a profile of the normal states of the system and detect deviation from this normal profile that may indicate a suspicious activity. The main shortcoming of anomaly based WIDSs is that the false positive rate (proportion of events mistakenly detected as attacks) is usually higher compared to signature detection systems. Furthermore, it could be a difficult task to define what exactly a normal behavior is in complex environments. Generally, anomaly detection approaches consist of two phases: training phase and testing phase. In the training phase the profile of normal behaviors is built. Then, it is applied to new data in order to detect abnormal behaviors in the testing phase. Various techniques have been applied to solve the general problem of intrusion detection. These techniques include statistical based methods [1], data mining methods [2-4], Markov models [5], [6], grammar based methods [7], [8], Artificial Neural Networks (ANNs) [9], [10], and Artificial Immune Systems (AISs) [11], [12].
14
IJCSI International Journal of Computer Science Issues, Vol. 8, Issue 5, No 2, September 2011 ISSN (Online): 1694-0814 www.IJCSI.org
2. Related Work As mentioned earlier, access log files of web servers are an important source of information for WIDSs. There are some shortcomings to common access log files generated by common web servers such as Apache. The first problem arises when defining web sessions. As the boundaries of sessions are not clearly defined, extraction of web sessions from these log files is not a straightforward process. Although there are some heuristics, such as time out scheme [13] that can lead us to identify web sessions, these methods are not very accurate in practice. On the other hand, common log files do not contain the POST requests processed by the web server. Generally speaking, both GET and POST methods have a key point in interaction of users with web applications. In order to overcome these issues, a log file generator is introduced that eliminates the aforementioned drawbacks in order to generate a special log file called the Enhanced Custom Log file (ECL). The detailed information of ECL is discussed later. In this paper, an anomaly detection system for detecting web-based attacks is presented. In the training phase, the anomaly detection system takes the ECL as the input and builds a dataset to tries to learn how to distinguish normal behaviors from attack by considering three parameters. These parameters include: the number of values assigned to variables of each request within a session; the number of dual composition of characters, in windows of size two, from the values assigned to variables of each request within the session; and a window of size three from the users’ navigational path within the sessions. Finally, we apply an Artificial Immune System (AIS), introduced in our previous work [27], in order to equip the detection system to distinguish normal behaviors from the abnormal ones. In order to evaluate the capability of the system, the system is encountered with new patterns in the testing phase. Also, to prove the ability of the proposed AIS algorithm the results are compared to different well-know ANNs. The remainder of this paper is organized as follows. In Section 2, a review on some available IDSs is presented. Section 3 introduces the fundamental operations of the proposed anomaly based WIDS including data gathering, feature extraction and detection mechanism. In Section 4, the experimental evaluation of the proposed system is presented. Moreover, the detection ability of the system is compared to some common ANN. Finally in Section 5, we conclude our study.
Generally speaking, an anomaly detector needs to have a proper definition of what normal behaviors are. To answer this question, there are two possible approaches. An anomaly detector can be provided by a set of rules or specifications of what is regarded as normal behavior based on the human expertise. This approach could be assumed as an extension of misuse detection systems. In the second approach, the anomaly detector automatically learns the behavior of the system under normal operations and then generates an alarm when a deviation is detected from the normal model [14]. Prior to introducing some related work, we should mention that the extendibility of a WIDS is proved when the training and test data are good samples of real world web attacks. Also, the attacks presented in these data need to be representative of variety of attacks that exist in current web. The most important datasets that has been used for evaluating IDSs are provided by DARPA/MIT Lincoln Laboratory in 1998 and 1999 [15]. These data are used by many researchers in intrusion detection researches because massive datasets are rare and also they provide an immediate comparison with the original Lincoln Lab’s test. As there are some inherent problems with this datasets [16], [17], some researchers improved their own attack database to supplement the attacks in the Lincoln Lab’s data [18]. Various features are proposed to be extracted from the audit data that is available in a particular system. Krugel et al. [19], proposed a service-specific IDS. In this system, the anomaly score of a request is calculated using three properties: type of the request, length of the request and payload distribution. In this approach, if the length of the request is longer than the average length, it is likely to be an attack. This approach is based on the observation that attack codes, which may cause buffer overflow, often contain a large number of NULL characters. In the case of a model for character distribution, the ASCII characters are grouped to 6 categories. Then a single uniform distribution model of these 6 groups for all requests of one service over all possible payloads’ length is computed. Finally, a chisquare test is performed against this model to calculate the anomaly score of test requests. In a similar attempt, anomaly detection system proposed by Wang and Stolfo [14] models the normal payloads of the network traffic by profiling the byte frequency distribution of payloads of particular length, flowing a particular host and port. Then, the size of the model is reduced using a clustering method. In the detection phase, the Mahalanobis distance is used to calculate the similarity of new data to the normal profile.
15
IJCSI International Journal of Computer Science Issues, Vol. 8, Issue 5, No 2, September 2011 ISSN (Online): 1694-0814 www.IJCSI.org
The system proposed by Kruegel and Vigna [20], is an IDS that use similar features to our work. This system utilizes a number of anomaly detection techniques to detect attacks against web servers and web-based applications. The system analyzes the HTTP GET requests that use parameters to pass values to server-side programs. These requests are recorded in access log file of web servers. Multiple models are produced using a wide range of features of the mentioned requests. These features include the presence or absence of attributes (parameters), attributes length, attribute characters distribution, the order of attributes, access frequency, inter-request time delay, etc. Different algorithms are proposed to generate the normal model of the systems and distinguish the normal behaviors from the abnormal ones. As discussed earlier, some anomaly detection systems produce a statistical model for a system and detect large deviation from this profile [14], [19], [20]. The others use machine learning techniques or Markov chains in order to make a profile of normal operations of system [21]. The session anomaly detection (SAD) system [22] analyzes web access logs in order to detect anomalous web sessions. In this system, the Bayesian parameter estimation is adopted to build profiles of normal webpage request sequences. Then, the likelihood of each event is estimated based on previous probability distribution and an anomaly score is assigned to each event. The anomaly detection system presented in [23], have applied Markov chains in order to model the HTTP traffic. In the training stage, the packet payloads of the training data (normal data) are segmented into a number of continuous blocks. Then, a dictionary of these blocks is produced and a symbol is associated to each entry in the dictionary. Each segmented payload is represented as a sequence of corresponding symbols from the dictionary. The arrays of symbols are then used to train a Markov chain to capture the occurrence and the spatial appearance of each sequence within the data. In the testing stage, the obtained Markov model is used to evaluate the incoming HTTP traffic. In some researches, ANNs have been applied in anomaly detection, mainly due to their adaptability to changes in environments. Furthermore, ANN can model complex relationships between inputs and outputs and also find patterns in data by using non-linear statistical data modeling. Ingham et al. [18] also developed their framework for comparing different anomaly detection techniques based on their gathered data. In recent years, a growing number of computer scientists have applied immunological models to several domains of computer and network security [24], [25]. These systems are characterized by some interesting features such as adaptability, self-organizing and distribution. Among the AIS models, the Negative Selection (NS) algorithm has a
high potential use in intrusion detection. The basic idea of this algorithm is to generate a set of detectors that are able to distinguish self (normal) from the non-self (abnormal) behaviors. Gonzales et al. [26], [25] proposed a realvalued negative selection to generated non-self samples using the self data. A conventional classifier is then applied to detect abnormal patterns.
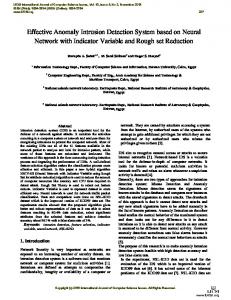
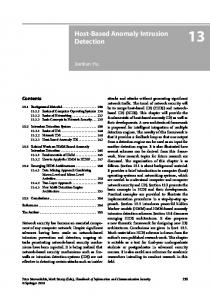
3. Proposed Method In this section, different parts of the proposed Web Hostbased Intrusion Detection System (WHIDS) are described. The general view of the proposed system is depicted in Fig. 1. As illustrated in this figure, the proposed WHIDS is composed of five major stages. In the first stage, with the assistance of the PHP log file generator, the HTTP streams recorded with their sessions in ECL format are fed to the system as input. In the second stage called the feature extraction stage, multiple features are extracted from the input data. In the training stage, a learning algorithm is employed in order to learn the states of the system regarding the features that are extracted in previous stage. The fourth stage involves analyzing the incoming sessions and comparing them to learned states models, built in training stage, in order to detect malicious activities. The last stage handles the output of the WHIDS. The output of the proposed system is an alarm signal for the system security officer when a suspicious activity is detected. The following sections describe the detailed information of each stage.
Fig. 1 The general view of the propose WHIDS.
3.1 Data Gathering Generally, in order to fully examine an IDS a suitable dataset is necessary. The key point is to accurately separate the normal data from the abnormal (attack) data. To achieve this goal, in the data gathering phase, the web applications and web server should be provided by a fully protected condition to ensure that we can gather the pure
16
IJCSI International Journal of Computer Science Issues, Vol. 8, Issue 5, No 2, September 2011 ISSN (Online): 1694-0814 www.IJCSI.org
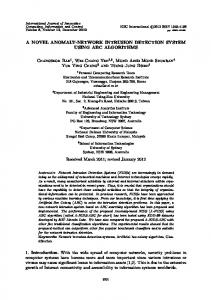
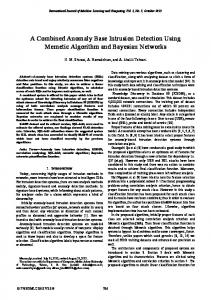
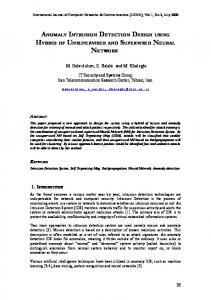
normal user behaviors. On the other hand, in order to prove the capability of the system in detecting various attacks, the attack data should cover large range of today’s web attacks. As mentioned earlier, our anomaly detector analyzes a special kind of access log in order to build a normal profile of web sessions and also detect malicious activates. The reasons that the common log files (Apache log files) are not employed are as follows. First, the proposed WHIDS analyses both GET and POST HTTP requests received by the web server. Generally speaking, most PHP applications work with GET or POST methods and both methods are needed to be used alternatively for interacting with users. As the POST requests are not recorded in common log file of web servers, a new log generation mechanism is needed to record these requests in log files. It should be noted that there are other methods for interacting with web application such as HEAD and PUT, which are ignored because of their low importance. Second, the boundaries of sessions are not clearly defined in common log files. As a result, extracting web sessions from these log files is not a straightforward process. Although there are some heuristics, such as time out scheme that can lead us to identify web sessions, these methods are not very accurate in practice. Considering the aforementioned problems, we develop a module called PHP log generator, written in PHP language, in order to generate a log file that satisfies the needs of our anomaly detector. The output of the PHP log generator would be a special kind of log file called Enhanced Custom Log file (ECL). An ECL entry represents a request to the web server which belongs to a specific session. The fields of an ECL entry include: ID (sequence number), session identification (ID), client IP address, time of the request, date of the request, method of the request (POST or GET), host name, requested URL, query string (the list of variables and values which are passed to web application), network address translation (NAT) IP address, forward IP address, user agent, protocol, server port number, and client port number. In order to clarify the functionality of the PHP log generator, consider the process of generating common log file in Apache web servers. This process consists of 5 steps (see Fig. 2). In the first step, a user writes his/her request in the URL and sends the request to the web server. In the second step, PHP interpreter receives the request and fetches the PHP file and interpret it to HTML. Then, it sends HTML file for the user. Prior to this step, the request is recorded in common log file in Apache web server. In the case of the method employed in this research, PHP log generator captures users’ requests before allowing the
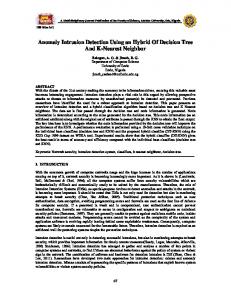
PHP interpreter to fetch the PHP file (see Fig. 3). Furthermore, a cookie is created which contains the session ID of the visitor. This cookie is stored in the user’s machine and helps the log file generator to recall the user in future connections; since each time the user sends a request, the session ID is enclosed in that request. It is worth bearing in mind that, expiration date of the cookies are settable by the log file generator when it aims to set session ID of the cookie. In the method used in this research, the session is generated by PHP log generator and is then recorded in ECL. Since the session is a unique identity which is assigned to users, it allows us to track clients. Session generation has some difficulties when the client closes the browser and re-opens it again. The process of restarting the session with closing and opening the browser can lead to mistake in tracking users. In other words, when users open and close the web browser in different times, more than one session are created and logged for them wrongly. To avoid this problem, the cookies have been used. By employing cookies, not only sessions are generated, but also they can be stored for a specific period of time.
3.2 Feature Extraction In this section, the process of generating a dataset containing different features that are extracted from the ECL is explained. The dataset, which is generated by the system, can be used by other researchers as a benchmark. As mentioned earlier, three different features are extracted by the feature extraction module in proposed WHIDS. These features include: the number of values assigned to variables of each request within a session (Histogram); the number of dual composition of characters in windows of size two from the values assigned to variables of each request within the session (Double windows); and a window of size 3 from the users’ navigational path within the sessions (Markov windows). Consider that, in feature extraction process, input data are actually web sessions that can consist of multiple requests to the web server. Histogram: Generally, a request to a web application may contain some variables and values. The length of a value assigned to a variable can be helpful in detecting anomalous requests. Generally, values can be either fixedsize tokens (such as session identifiers that are entitled in the request to resume a session) or short strings representing human inputs (e.g. fields in an HTML form). As a result, the length of the values assigned to variables of a particular web application does not very much. The
17
IJCSI International Journal of Computer Science Issues, Vol. 8, Issue 5, No 2, September 2011 ISSN (Online): 1694-0814 www.IJCSI.org
Fig. 2 The processes of common log file generation in an Apache web server.
Fig. 3 The process of ECL generation in Apache web server.
18
IJCSI International Journal of Computer Science Issues, Vol. 8, Issue 5, No 2, September 2011 ISSN (Online): 1694-0814 www.IJCSI.org
situation can be different when a malicious activity is occurred. As an example, in the buffer overflow attack, the length of the input value which is passed to the web application may vary from the normal range. Based on the above discussion, for the first feature that is proposed to be extracted from the ECL, called Histogram, we extract the variables’ values and count their character. These values are stored in a database whose columns are defined as particular intervals with the length of four. Intervals are assumed for the number of characters in each variable. For each variable in the requests of a session, we count the number of its characters. Then, the corresponding field’s value in the table of the database is incremented by one. As an example, imagine a login request in a session which contains a password variable assigned with the value of ‘XXX’. As the length of the value for this example is 3, the value for the corresponding column, 1 ≤ x < 5, is increased by one in the row that is correspond to the session of the request. Consider that, after counting the length of each variable in a session, the vector that is corresponded to that session is normalized. That is why the range of output is between 0 and 1. The normalized value for each field in a vector of a session is calculated by dividing the value of that field by the sum of values over all the fields in that vector. Double Windows: Generally, the parameters that are passed to a web application have regular characteristic. As an example, they mostly contain printable characters. In the case of a malicious activity, the structure of the characters which are passed to the web application could be quite different. Moreover, many attacks would send a series of a single character. As a result, modeling how different characters can appear in a normal query can be useful in detecting abnormal occurrence of them. Based on the above discussion, the second feature that is extracted from the ECL is the number of dual composition of characters, in windows of size two, from the values assigned to variables of each request within the session. Generally, the characters that are allowed to be used as the value of a variable include ‘~’, ‘!’, ‘@’, ‘#’, ‘$’, ‘%’, ‘^’, ‘&’, ‘*’, ‘(‘, ‘)’, ‘_’, ‘+’, ‘`’, ‘-‘, ‘=’, ‘[‘, ‘]’, ‘\’, ‘;’, ’'’, ‘,’, ‘.’, ‘/’, ‘{‘, ‘}’, ‘|’, ‘:’, ‘’, ‘?’, ‘"’, and the letters ‘a’ to ‘z’. Here, we attempted to create all possible double composition of the aforementioned characters. In this case, 3364 doubles can be created. As in the case of histogram, we have one column for each double and increment the counter of each column when the corresponding double is found in the value assigned to a variable of a request in a session.
The high dimensionality of the produced table leads us to add columns to the table on demand. In other words, it is not necessary to add all possible doubles as a column to the table, but they are added only if they are seen at least in a window of values assigned to variables of a request. For example, if the word ‘admin’ is assigned to a value of a variable, the doubles that are added to the system will be ‘ad’, ‘dm’,’mi’ and ‘in’. Fig. 4 (a) shows the table when all doubles are put into the table, whereas Fig. 4 (b) shows the table when doubles are added when they occur in the variables’ values. The advantage of the second approach is that many columns will be discarded and the produced table would be less sparse. Furthermore, this reduction decreases memory usage.
Fig. 4 The schematic view of the doubles window table. (a) When all possible doubles are put into the table. (b) When doubles are added to the table on demand.
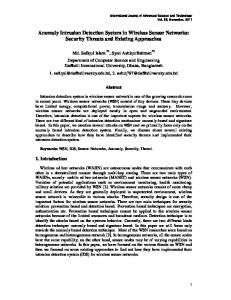
Markov Windows: Markov models are well-known as a method to capture the sequences of web navigation in anomaly detection systems. This model can detect unreasonable transition of user and mitigate authentication bypass attack. In addition to the sequence of web navigations, we consider the variables which are passed in the request by defining a new concept named treat. We consider various windows of the user’s navigational path within the sessions. Here, for the sake of efficiency the size of the windows are set to three. Assume that a website is included these pages: a, b, c, d, e, f, and g (the page a represent index.php or something similar). Accordingly, a user can have different navigational patterns for visiting pages (as an example a-b-c >> b-cd >> c-d-e >> d-e-f). As mentioned, we also consider the variables which are passed through the query in conjunction with the navigational path of the user and call these a treat. By introducing the treat concept in previous example, the page “index.php” will be changed to “index.php? variable1=”. Advantage of using treats instead of pages is that we can model the navigational path of a user in conjunction with the variables which are passing during this navigation. As an example, three queries: “index.php?var1=”, “index.php?var2=”, and “index.php?var1&var2=” are considered as different treat although the visited web page is identical in them (see Fig. 5). In other words, it is possible to go from one page to another by passing different kind of variables without considering their values.
19
IJCSI International Journal of Computer Science Issues, Vol. 8, Issue 5, No 2, September 2011 ISSN (Online): 1694-0814 www.IJCSI.org
Fig. 5 The concept of treat against the movement.
analysis and detection module in the proposed system. Briefly, this algorithm tries to generate some real-valued detectors. We inspired by the universal gravitational law to spread the detectors in the problem space in order to cover the non-self space properly. The detailed information of this algorithm is presented in [27]. After generating the detectors from the training samples, the testing samples are presented to the detector set and are compared to them based on the Euclidean distance. The samples which are closed to detectors sufficiently are considered as a potential suspicious activity. In order to prove the capability of the immune inspired algorithm, this algorithm is replaced by some well-known ANNs. The results of the effectiveness of these algorithms in detecting suspicious activities are compared to each other in following sections.
Fig. 6 The treat model.
Eventually, we make a table of treats which are observed in sessions. Similar to previous features, all possible triples are not added as a column to the table, but they are just added when they have been seen in a users’ sessions. Hence, the table contains triples that have been generated at least one time by one user. It should be mentioned that, repeated triples will not be taken into account. Fig. 6 represents two treats stored in the system. After specifying all triples in users’ sessions, we try to count the number of occurrence of each treats in each session. Hence, if we observe a particular treat in a session, the corresponding column, in the row related to that session, should be increased by one. Finally, the model is provided by normalizing these counts as explained previously.
3.3 Analysis and Detection As it was mentioned before, the WHIDS system consists of an analysis and detection module. This module receives the dataset generated in previous stage as input and analyzes it to learn the normal behaviors and abnormal behaviors. In other word, we have divided the dataset to training and testing data. The training data is used to train the system to distinguish the normal behaviors from the abnormal ones. Finally, the test data is fed to the trained algorithm in order to evaluate the capability of the algorithm in detecting malicious activities. The analysis and detection module is completely independent from other parts, so it allows us to be able to alternate the learning algorithms. Previously, we proposed a real-valued negative selection (RNS) algorithm for binary classification [27]. We use this AIS algorithm as the
3. Experimental Evaluation In this section, we discuss our approach to evaluate the effectiveness of the negative selection algorithm in detecting malicious activities in web server log files. Moreover, we examine the capability of the features that are extracted from log files to capture the properties of attributes that have been collected in ECL files. Beside the proposed RNS algorithm, three different algorithms including Multilayer Perceptron (MLP), Radial Basis Function Network (RBFN), and Naïve Bayes (NB) algorithm are chosen to learn the dataset which is generated from the ECL log files. Both MLP and RBFN have been employed in network based IDSs. The reason that they are chosen is that, they proved to have high ability in detecting intrusion in the network based systems. Consider that, due to the independency of the detector system’s modules from the analysis and detection module, it is possible to change the algorithms employed in this part or use the combination of that algorithms as a new one. As described earlier, due to the special kind of the attributes that we defined to model the behavior of the system, we used ECL. Also, for producing ECL we designed a social website and collect access log files in ECL format. For evaluating the effectiveness of the detection system, we need both normal and attack data. Therefore in the first step, we provided the web server with a fully protected condition to ensure that we can gather the pure normal users’ behaviors. In the second step, we produced the variety of attack such as SQL injection, path traversal, command injection, XSS, etc. to a web server which in not under any external traffic for collecting attack data. After data gathering, we analyzed the log files to
20
IJCSI International Journal of Computer Science Issues, Vol. 8, Issue 5, No 2, September 2011 ISSN (Online): 1694-0814 www.IJCSI.org
extract features that are comprehensively described in previous sections. Finally, a dataset is generated which can be analyzed by different algorithms to learn and detect the system behavior. Table 1 provides details information of important properties of the generated dataset from the ECL files. The table shows the time interval during which the ECL files were recorded, the log file size and the total number of HTTP requests in the log file. Table 1: The details information of the dataset used for evaluation.
Dataset
Time Interval
Size (MB)
HTTP Requests
Normal Data
7 days
5
30,000
Attack Data
7 days
21
156,700
As it was mentioned earlier, three different categories of features are extracted from the ECL. The structure of the final dataset is as follows. There are 10 columns for the histogram. In addition, there are 1160 columns for doubles which 506 columns are share between attack, and normal and 654 columns are not share between attack, and normal. Finally, in the case of extracted treats, 30 fields or columns are shared as a normal and attack treat and 3474 fields are not shared. Among these non-shared fields 2486 columns are normal treat and 988 columns are attack.
4.1 Detection Effectiveness An important key point in evaluating the system is choosing evaluation measures. Suitable measures can show real nature of the system and performance of algorithms. In this section, we compare the algorithms used in analysis and detection module from three different points of view including: the time they spend for learning the normal behaviors in training phase and detecting intrusions in testing data; the error of predicted value compared to the real value; and the measures revealing how much the system can detect anomalous behaviors. The testing technique, employed in all the tests performed in this section, is 10 times 10-folds cross validation, which can guarantee the generality of the results. In other words, we run each algorithm 10 times with 10-folds cross validation and the final values for evaluation measures is the average of these 10 runs. Also, in the case of the proposed RNS algorithm, the number of generated detectors in the evaluations presented in this section is set to 50. Execution Time: One of the important factors in the field of WHIDS is time the system spends to model the monitored system. In WHIDS systems, the faster we are able to detect the intrusion, the sooner we can find the
21
weakness points of the system and patch the holes. The time measure in WHIDS is the time that it takes for the algorithm to build a model for the training samples and predicting the status of the test samples. However, it is worth mentioning that, execution time alone, is not enough to evaluate an algorithm and the time should always be seen with the ability of the system in detecting intrusions. For example, if an algorithm is fast and needs a very short time to build a model but has a low ability in detecting anomalous behaviors, it cannot be a useful algorithm. On the other hand, an algorithm that takes an enormous amount of time to properly build the normal model and detect intrusions is unsuitable; since, by the time the intrusions are detected, the system may have been already damaged too much. Table 2 shows the execution time of each four algorithms, employed in analysis and detection module, over the dataset. As we can see in Table 2, among the four algorithms that were mentioned (proposed RNS, Naïve Bayes, RBFN and MLP), Naïve Bayes has the shortest execution time, followed by RBFN, NS, and finally MLP. In other words, MLP takes the longest time while the NB and RBFN spend a short time and proposed RNS is in the middle. It should be noted that, due to the very long time that MLP takes to respond, even if it performs very well on other measures, it cannot be an efficient algorithm for some environments. Table 2: The detailed information of the dataset.
Algorithm 4B
Time taken to build model (sec) 5B
Proposed RNS
297.95
NB
0.20
MLP
2973.40
RBFN
9.30
Error: In this part different kind of error metrics are measured to evaluate the error in the prediction values compared to the real value of the test set. The results are compared for each algorithm in analysis and detection module. Consider that, in the case of the proposed RNS algorithm, the calculation of errors is not a common task. For this reason we ignore the calculation of error measures for proposed RNS algorithm. Therefore, three different error metrics are measured for each learning algorithm. The first metric is the Mean Absolute Error (MAE). As the name suggests, the mean absolute error is an average of the absolute errors and shows how the predicted values differs from the true values. The closer the prediction value to the true value, the smaller mean absolute error would be.
IJCSI International Journal of Computer Science Issues, Vol. 8, Issue 5, No 2, September 2011 ISSN (Online): 1694-0814 www.IJCSI.org
The second error metric employed in our evaluation is the Root Mean Squared Error (RMSE). RMSE is a measure of error that is used frequently for evaluating algorithms. It is similar to MAE since like MAE, it measures the average difference between prediction value and true value. However, there is one important difference between MAE and RMSE. RMSE is more sensitive to outliers than MAE. The RMSE is calculated such that the effect of the large differences between predicted value and true value are amplified. In other words, larger differences between predicted value and the true value have a greater power to affect the obtained value of error. On the other hand in MAE, errors of different sizes are all treated in the same way. Both RMSE and MAE are useful measures of error. However, in some situations using RMSE is more meaningful while in other situations using MAE is more appropriate. The last measure for reflecting the error corresponds to each algorithm in this evaluation is the Kappa Statistics. This metric is a statistical measure which shows the consistency between predicted and true value in a dataset. Also, it corrects the consistencies that occur by chance. High value of Kappa shows high consistency between predicted and measured values and indicates better performance of algorithm. Table 3 shows the results for the aforementioned error measures for each three learning algorithms. As suggested by this table, the predicted values by MLP algorithm have lower error in comparison with the other two algorithms. Moreover, the RBFN is more successful than Naïve Bayes. However, it should be mentioned again that the error measurements, like all other measures, cannot be used alone to evaluate an algorithm. As we discussed in previous section, the MLP spends an enormous amount of time to construct the normal model and gets the results. Table 3: The error measures for each three learning algorithms.
Algorithm
MAE
RMSE
Kappa Statistics
NB
0.27502
0.52325
0.34114
MLP
0.04959
0.18309
0.90605
RBFN
0.05329
0.20916
0.89822
Efficiency Measures: In this section different kind of metrics are measured to evaluate the ability of the algorithms to learn the properties of the features of the data and also detecting the malicious activities. The results are presented for each algorithm in analysis and detection module. Generally, four situations can be assumed corresponding the relation between the result of an analysis for a sample event and its actual nature in an IDS. These situations include: false positive (FP), if the analyzed event is not an attack, but it is classified as a malicious activity; true positive (TP), if the analyzed event is correctly classified as intrusion; false negative (FN), if the analyzed event is malicious, but it is classified as a normal activity in the system; and true negative (TN), if the analyzed event is correctly classified as a normal activity. Considering these situations, two measures are defined that can represent the effectiveness of a detection tool. These two measures are the TP rate (recall) and FP rate (false alarm rate). The recall measure can be defined as the fraction of correctly classified instances to the total number of inputs that should have been classified as anomalous. In other words, recall is the fraction of true positive rates to the number of all cases that should have been classified as positive. On the other hand, the false alarm rate can be defined as the proportion of actually normal cases that were incorrectly classified as anomalous. There are some other measures that can reveal the effectiveness of the detection system. As instance, we can consider the Precision. The precision can be defined as the number of correct predictions divided by all the results that have been specified by the algorithm. A measure that can show the combination of the precision and recall is Fmeasure, which is provided by taking the harmonic mean of these two values. Table 4 represents the discussed measures for each of four algorithms when 10 times 10-fold cross validation test method was performed over the dataset. As suggested by this table, the MLP and RBFN are performing quite the same and they can excel the NB algorithm in detecting attacks correctly and not producing incorrect alarms. However, we can see that the false alarm rate generated by the MLP algorithm is slightly smaller compared to that of RFBN. Moreover, the recall and the precision, and hence the F-measure corresponding to MLP exceed that of RBFN. In additions, the proposed RNS algorithm has the highest values for recall and precision while producing the least false alarm. As a result, we can claim that the proposed RNS algorithm is performing more effectively in detecting malicious activities compared to other three algorithms.
22
IJCSI International Journal of Computer Science Issues, Vol. 8, Issue 5, No 2, September 2011 ISSN (Online): 1694-0814 www.IJCSI.org
Table 4: The results of the efficiency measures for each four learning algorithms.
Precision
Fmeasure
False Alarm Rate
0.9679
0.9795
0.9834
0.0007
NB
0.7449
0.7607
0.6862
0.4217
MLP
0.9561
0.9571
0.9557
0.0610
RBFN
0.9524
0.9533
0.9523
0.0656
Algorith m
Recall
Proposed RNS
4.1 Discussion In this section we summarize the obtained results from the evaluation mechanism presented in previous sections. As discussed earlier, the execution time of the MLP is too higher than that of the NB algorithm and RBFN. Furthermore, we can see that the NB is the fastest algorithm in building the normal model and detecting anomalies. Also, the proposed RNS algorithm has a mediocre execution time. The errors of the predicted values for the NB algorithms are the highest among all three algorithms, indicating how NB is performing poorly in predicting the values for sample data. MLP is performing more accurately in predicting the values corresponding to data samples. Finally, the RBFN, with a slight difference from MLP, is performing quite powerfully in predicting the values for data samples. As discussed, the error measures are not calculated for the proposed RNS algorithm. On the other hand, from the efficiency point of view, the proposed RNS algorithm is performing more powerfully in detecting anomalous behaviors with generating fewer mistaken alarms compared to other three learning algorithms. As the results of Table 4 suggest, the ability of the MLP and RBFN are quite the same. Furthermore, we can conclude that the NB algorithm is performing poorly in detecting attacks, although it is the fastest algorithm. To sum up, we can claim that, from both the cost (execution time) and the efficiency points of view, the proposed RNS algorithm can be selected as the best choice for the analysis and detection module of the proposed WHID among the other three algorithms discussed in this paper.
4. Conclusions and Future Work The main goal of this research was designing a host-based WIDS. We proposed to employ the enhanced custom log file in order to eliminate the inherent problems of common log files in defining web sessions boundaries. Moreover, ECL provides us with the POST requests along with the GET requests from the HTTP protocol. Different features were extracted from the ECL file which can represent the operations of the monitored web server. In this research, a dataset of normal and attack data were produced which can be used by other researchers in the field of WIDSs. Finally, we proposed the use of a novel RNS algorithm, inspired by the natural immune system, in order to produce a set of detectors that can cover the space of non-self (attack) properly and match to the non-self data and detect them. The results presented in this paper, proved the high ability of the proposed algorithm in detecting abnormal activities compared to some well-know and classical learning algorithms. The most significant improvement that can lead to fruitful this research in future is to prepare the system to perform in an online state. As discussed earlier, the AISs have some interesting characteristics, such as adaptability and selforganizing, that make them attractive for working on data streams, such as HTTP streams, instead of stored data in an offline manner. This can also be a beginning for designing host-based web intrusion prevention systems.
References [1] D. Qu et al., “Statistical anomaly detection for link-state routing protocols”, in Proceedings of the 6th International Conference on Network Protocols, 1998, pp. 62-70. [2] W. Lee, S. J. Stolfo, and K. W. Mok, “A data mining framework for building intrusion detection models”, in Proceedings of the 1999 IEEE Symposium on Security and Privacy, 1999, pp. 120–132. [3] A. Nalluri and D. C. Kar, “A web-based system for Intrusion Detection”, Journal of Computing Sciences in Colleges, vol. 20, no. 4, 2005, pp. 274–281. [4] K. Sequeira and M. Zaki, “ADMIT: anomaly-based data mining for intrusions,” in Proceedings of the 8th International Conference on Knowledge Discovery and Data Mining, ACM SIGKDD, 2002, pp. 386–395. [5] Y. Song, A. D. Keromytis, and S. J. Stolfo, “Spectrogram: A mixture-of-markov-chains model for anomaly detection in web traffic,” in Proceedings of the 16th Annual Network and Distributed System Security Symposium (NDSS), 2009. [6] J. Hu, X. Yu, D. Qiu, and H. H. Chen, “A simple and efficient hidden Markov model scheme for host-based anomaly intrusion detection,” IEEE Network, vol. 23, no. 1, 2009, pp. 42–47. [7] Z. Su and G. Wassermann, “The essence of command injection attacks in web applications,” in Proceedings of
23
IJCSI International Journal of Computer Science Issues, Vol. 8, Issue 5, No 2, September 2011 ISSN (Online): 1694-0814 www.IJCSI.org
[8]
[9]
[10]
[11]
[12]
[13]
[14]
[15]
[16]
[17]
[18]
[19]
[20]
[21]
[22]
[23]
33rd Symposium on Principles of programming languages, ACM SIGPLAN, 2006, vol. 41, pp. 372–382. V. Gorodetski and I. Kotenko, “Attacks against computer network: Formal grammar-based framework and simulation tool,” in Recent Advances in Intrusion Detection, 2002, pp. 219–238. G. Wang, J. Hao, J. Ma, and L. Huang, “A new approach to intrusion detection using Artificial Neural Networks and fuzzy clustering,” Expert Systems with Applications, vol. 37, no. 9, 2010, pp. 6225–6232. E. Corchado and Á. Herrero, “Neural visualization of network traffic data for intrusion detection,” Applied Soft Computing, vol. 11, no. 2, 2011, pp. 2042–2056. U. Aickelin, J. Greensmith, and J. Twycross, “Immune system approaches to intrusion detection–a review,” Artificial Immune Systems, 2004, pp. 316–329. F. S. de Paula, L. N. de Castro, and P. L. de Geus, “An intrusion detection system using ideas from the immune system,” in Congress on Evolutionary Computation, CEC2004, vol. 1, 2004, pp. 1059–1066. S. Sprenkle, E. Gibson, S. Sampath, and L. Pollock, “A case study of automatically creating test suites from web application field data,” in Proceedings of the 2006 workshop on Testing, Analysis, and Verification of Web Services and Applications, 2006, pp. 1–9. K. Wang and S. J. Stolfo, “Anomalous payload-based network intrusion detection,” in Recent Advances in Intrusion Detection, 2004, pp. 203–222. “MIT Lincoln Laboratory: Information Systems Technology.” [Online]. Available: http://www.ll.mit.edu/mission/communications/ist/corpora/i deval/data/index.html. [Accessed: 27-Aug-2011]. J. McHugh, “The 1998 Lincoln Laboratory IDS evaluation,” in Recent Advances in Intrusion Detection, 2000, pp. 145– 161. J. McHugh, “Testing intrusion detection systems: A critique of the 1998 and 1999 DARPA intrusion detection system evaluations as performed by Lincoln Laboratory,” ACM Transactions on Information and System Security, vol. 3, no. 4, 2000, pp. 262–294. K. Ingham and H. Inoue, “Comparing anomaly detection techniques for http,” in Recent Advances in Intrusion Detection, 2007, pp. 42–62. C. Krügel, T. Toth, and E. Kirda, “Service specific anomaly detection for network intrusion detection,” in Proceedings of the 2002 ACM Symposium on Applied Computing, 2002, pp. 201–208. C. Kruegel and G. Vigna, “Anomaly detection of web-based attacks,” in Proceedings of the 10th ACM Conference on Computer and Communications Security, 2003, pp. 251– 261. N. Ye, “A markov chain model of temporal behavior for anomaly detection,” in Proceedings of the 2000 IEEE Systems, Man, and Cybernetics Information Assurance and Security Workshop, 2000, vol. 166, p. 169. S. Cho and S. Cha, “SAD: web session anomaly detection based on parameter estimation,” Computers & Security, vol. 23, no. 4, 2004, pp. 312–319. J. M. Estévez-Tapiador, P. García-Teodoro, and J. E. DíazVerdejo, “Measuring normality in HTTP traffic for
[24]
[25]
[26]
[27]
anomaly-based intrusion detection,” Computer Networks, vol. 45, no. 2, 2004, pp. 175–193. S. A. Hofmeyr and S. Forrest, “Immunity by design: An artificial immune system,” in Proceedings of the Genetic and Evolutionary Computation Conference, 1999, vol. 2, pp. 1289–1296. F. González, D. Dasgupta, and R. Kozma, “Combining negative selection and classification techniques for anomaly detection,” Computational Intelligence, vol. 1, 2002. F. A. González and D. Dasgupta, “Anomaly detection using real-valued negative selection,” Genetic Programming and Evolvable Machines, vol. 4, no. 4, 2003, pp. 383–403. M. Azimpour-Kivi, R. Azmi, and S. Ghorbani-Faal, “Artificial immune systems (AIS) for classification and its application to anomaly detection,” in Proceedings of The 4th Iran Data Mining Conference, IDMC 10, Iran, 2010.
24