Received: 29 January 2018
|
Revised: 16 May 2018
|
Accepted: 23 May 2018
DOI: 10.1111/mec.14779
SPECIAL ISSUE: SPECIES INTERACTIONS, ECOLOGICAL NETWORKS AND COMMUNITY DYNAMICS
How much is enough? Effects of technical and biological replication on metabarcoding dietary analysis Vanessa A. Mata1,2
| Hugo Rebelo1,3,4
Gary F. McCracken5 | Simon Jarman1,6,7 1 CIBIO-InBIO, Centro de Investigação em Biodiversidade e Recursos Genéticos, Universidade do Porto, Vairão, Portugal
| Francisco Amorim1,2
|
| Pedro Beja1,3
Abstract DNA metabarcoding is increasingly used in dietary studies to estimate diversity,
2
Departamento de Biologia, Faculdade de Ciências, Universidade do Porto, Porto, Portugal 3
CEABN-InBIO, Centro de Ecologia Aplicada “Professor Baeta Neves”, Instituto Superior de Agronomia, Universidade de Lisboa, Lisboa, Portugal 4
composition and frequency of occurrence of prey items. However, few studies have assessed how technical and biological replication affect the accuracy of diet estimates. This study addresses these issues using the European free‐tailed bat Tadarida teniotis, involving high‐throughput sequencing of a small fragment of the COI gene in 15 separate faecal pellets and a 15‐pellet pool per each of 20 bats. We investi-
School of Biological Sciences, University of Bristol, Bristol, UK
gated how diet descriptors were affected by variability among (a) individuals, (b) pel-
5
lets of each individual and (c) PCRs of each pellet. In addition, we investigated the
Department of Ecology and Evolutionary Biology, University of Tennessee, Knoxville, Tennessee 6
Trace and Environmental DNA (TrEnD) Laboratory, Molecular and Life Sciences, Curtin University, Bentley, WA, Australia
impact of (d) analysing separate pellets vs. pellet pools. We found that diet diversity estimates increased steadily with the number of pellets analysed per individual, with seven pellets required to detect ~80% of prey species. Most variation in diet composition was associated with differences among individual bats, followed by pellets
7
Environomics Future Science Platform, CSIRO National Collections and Marine Infrastructure, Crawley, WA, Australia Correspondence Vanessa A. Mata, CIBIO-InBIO, Centro de Investigação em Biodiversidade e Recursos Genéticos, Universidade do Porto, 4485-661 Vairão, Portugal. Email:
[email protected] Funding information EDP Energias de Portugal; Fundação para Ciência e Tecnologia, Grant/Award Number: IF/00497/2013, LTER/BIA-BEC/0004/2009, PD/BD/113462/2015, PD/BD/52606/2014; EU Horizon 2020, Grant/Award Number: Grant agreement No 668981
per individual and PCRs per pellet. The accuracy of frequency of occurrence estimates increased with the number of pellets analysed per bat, with the highest error rates recorded for prey consumed infrequently by many individuals. Pools provided poor estimates of diet diversity and frequency of occurrence, which were comparable to analysing a single pellet per individual, and consistently missed the less common prey items. Overall, our results stress that maximizing biological replication is critical in dietary metabarcoding studies and emphasize that analysing several samples per individual rather than pooled samples produce more accurate results. KEYWORDS
bat ecology, metabarcoding, molecular diet analyses, replication, sampling design, trophic ecology
1 | INTRODUCTION
understanding of species interactions, food web structure and the mechanisms driving populations and ecosystem dynamics (Layman et
The study of animal predator diets has an old and rich history in
al., 2015; Nielsen, Clare, Hayden, Brett, & Kratina, 2017). The advent
ecology (e.g., Elton, 1927; Valverde, 1967), contributing to the
of DNA‐based molecular tools for the identification of complex
---------------------------------------------------------------------------------------------------------------------------------------------------------------------This is an open access article under the terms of the Creative Commons Attribution License, which permits use, distribution and reproduction in any medium, provided the original work is properly cited. © 2018 The Authors. Molecular Ecology Published by John Wiley & Sons Ltd Molecular Ecology. 2018;1–11.
wileyonlinelibrary.com/journal/mec
|
1
2
|
MATA
ET AL.
multitaxa samples, that is metabarcoding, has greatly renewed the
An important aspect often missed in metabarcoding dietary stud-
interest in dietary studies, particularly due to the high taxonomic res-
ies is the impact of both technical and biological replication on final
olution offered by this approach (e.g., De Barba et al., 2014; Kartzi-
results. Technical replication, that is the number of extractions and
nel & Pringle, 2015; Lopes et al., 2015). This has been especially
PCRs carried out on each sampling unit, is important because both
relevant to species whose diet is particularly difficult to study, either
extractions and PCRs have a random component, and a given prey
due to their secretive behaviour (e.g., Shehzad et al., 2012; Soininen
item may be missed in some replicates even if it was present in the
et al., 2015) or due to difficulties to identify prey in dietary remains
original sample. These false negatives are expected particularly if an
such as stomach contents, regurgitates and scats (e.g., Arrizabalaga‐
item's DNA is scarce or if there is a negative primer bias (Ficetola et
Escudero et al., 2015; Kaunisto, Roslin, Sääksjärvi, & Vesterinen,
al., 2015; Pansu et al., 2015; Willerslev et al., 2014). Biological repli-
2017; Mollot et al., 2014). However, despite its increasingly wide-
cation, that is the number of sampling units analysed per species,
spread use, uncertainties and potential biases associated with the
including for instance the number of individuals or the number of
quantification of diets based on metabarcoding are still not well
samples per individual, is important because the number of prey spe-
understood, requiring a detailed enquiry on how results are affected
cies detected tends to increase with the number of samples anal-
by different methodological options (Alberdi, Aizpurua, Gilbert, &
ysed. Lack of sufficient biological replication can be detected by
Bohmann, 2017; Nielsen et al., 2017).
either rarefaction or asymptotic species richness estimators, which
Diet studies aim to answer three main types of question about
identify sample sizes as being too small to characterize the biodiver-
animal populations: (a) dietary diversity, generally the number of dif-
sity in a sample (Gotelli & Colwell, 2001). Likewise, the precision of
ferent prey species consumed; (b) dietary composition, that is the
frequency of occurrence estimates is low when biological replication
identity of the prey species consumed; and (c) the contribution of
is low, and it varies with the prevalence of the prey items, and thus,
each prey species to the diet, quantified as the proportion in num-
a poor description of diet may occur at low sample sizes as a mere
bers, biomass or energetic content (e.g., Baker, Buckland, & Sheaves,
consequence of binomial sampling (Trites & Joy, 2005). These prob-
2014; Klare, Kamler, & MacDonald, 2011; Whitaker, McCracken, &
lems are worse when there is high variation in diet composition
Siemers, 2009). Surprisingly, there is a significant knowledge gap on
among individuals according for instance to gender, age or individual
the ability of metabarcoding‐based studies to provide accurate esti-
preferences (e.g., Mata et al., 2016; Pagani‐Núñez, Valls, & Senar,
mates of dietary descriptors, particularly under field conditions and
2015; Pleguezuelos & Fahd, 2004), and there may also be intraindi-
involving species with diverse diets (Nielsen et al., 2017). Despite
vidual variations due for instance to temporal changes in prey avail-
this paucity of quantitative studies, researchers often recognize that
ability (Burgar et al., 2014; Clare, Symondson, & Fenton, 2014b;
metabarcoding can be strongly influenced by numerous factors,
Clare et al., 2014a).
which should be accounted for in dietary studies. For instance, diet-
Here, we address the impacts of technical and biological repli-
ary descriptors can be strongly affected by amplification bias due to
cation on the results of metabarcoding dietary analysis, focusing on
unequal primer binding, which leads to systematic over‐ or underes-
the European free‐tailed bat (Tadarida teniotis). This species was
timation of the importance of some prey types relative to others
considered suitable because previous studies (Mata et al., 2016;
(Alberdi et al., 2017; Clarke, Soubrier, Weyrich, & Cooper, 2014).
Rydell & Arlettaz, 1994) have shown that it is a specialist predator
Also, “universal” barcoding markers are not necessarily good
of moths (Lepidoptera) and thus may be less affected by problems
metabarcoding markers and one often has to trade taxonomic reso-
of primer bias than species feeding on a wider range of taxonomic
lution for taxonomic range and vice versa (Albaina, Aguirre, Abad,
groups. Furthermore, moths are well represented in reference bar-
Santos, & Estonba, 2016; Clarke et al., 2014; Deagle, Jarman, Cois-
code databases, which reduces problems due to unidentified
sac, Pompanon, & Taberlet, 2014), although this problem is amelio-
MOTUs. Finally, metabarcoding dietary studies have often focused
rated to some extent by recent degenerate primer versions (e.g.,
on bats (e.g., Arrizabalaga‐Escudero et al., 2015; Hope et al., 2014;
Alberdi et al., 2017). Taxonomic assignments of amplicon sequences
Razgour et al., 2011), thus making it possible to evaluate the impli-
are frequently limited by poor reference databases for most taxo-
cations of our results in the context of widely used replication
nomic groups and localities (Bohmann et al., 2011), therefore ham-
options. In this study, we evaluate how variability among (a) indi-
pering data interpretation. Another problem is the imperfect
vidual bats, (b) faecal pellets of each bat and (c) PCRs of each pel-
correlation between the proportions of sequencing reads and bio-
let affect estimates of diet diversity and composition and on the
mass, making it hard to establish the contribution of each prey item
frequency of occurrence of the prey items. Also, we tested the
to the overall diet (Deagle, Thomas, Shaffer, Trites, & Jarman, 2013;
effects of analysing pools of samples vs. separate samples per indi-
Elbrecht & Leese, 2015; Piñol, Mir, Gomez‐Polo, & Agustí, 2015).
vidual, as these two variants are often used in dietary studies (e.g.,
Because of this, metabarcoding studies generally quantify diet in
pools: Burgar et al., 2014; Clare et al., 2014a, 2014b; Krauel,
terms of frequency of occurrence (e.g., Biffi et al., 2017; Kartzinel &
Brown, Westbrook, & McCracken, 2018; individuals: Hope et al.,
Pringle, 2015; Mata et al., 2016), although this does not necessarily
2014; Mata et al., 2016; Vesterinen, Lilley, Laine, & Wahlberg,
reflect the relative dietary intake of different prey items in terms of
2013). Our results were used to analyse the level of replication
numbers, biomass or energy (e.g., Foster, Harmsen, & Doncaster,
required to obtain accurate descriptions of predator diets using
2010; Greenstone et al., 2010; Sheppard et al., 2005).
metabarcoding.
MATA
|
ET AL.
2 | MATERIALS AND METHODS 2.1 | Study design
3
bats were placed in clean cotton bags, from where guano pellets were collected. We recorded gender, age (juveniles vs. adults) and sampling date of each individual. Pellets were stored in tubes containing silica gel and refrigerated at 4°C until DNA extraction. Pellets
This study was based on the dietary metabarcoding analysis of 20
from a subset of 143 individuals were used in a previous study to
European free‐tailed bats (Tadarida teniotis), using both a 15‐pellet
describe the diet of European free‐tailed bats (Mata et al., 2016),
pool and 15 separate pellets per bat, and three PCR replicates per
while for this study, we selected the pellets from a different subset
each pool and pellet (Figure 1). The number of individuals analysed
of 20 individuals that had left more than 30 guano pellets in the
is within or close to the range used in previous studies investigating
same capture event.
for instance trophic structure in bird and bat assemblages (Burgar et al., 2014; Crisol‐Martínez, Moreno‐Moyano, Wormington, Brown, & Stanley, 2016; Emrich, Clare, Symondson, Koenig, & Fenton, 2014;
2.3 | Molecular analysis
Razgour et al., 2011; Sedlock, Krüger, & Clare, 2014). The number of
We extracted DNA from each sample using the Stool DNA Isolation
pellets analysed separately for each individual is much larger than
Kit (Norgen Biotek Corporation), following the manufacturer's proto-
that of previous studies, which analysed either a single pellet or a
col. Samples were extracted in batches of 23 plus a negative control
pool of pellets per bat. The number of PCRs per sample is within the
in which no sample was added. Samples and negative controls were
range (two to four) of recent studies using multiple PCRs (Biffi et al.,
distributed in four 96‐well plates and kept in a freezer at −20°C
2017; Galan et al., 2018), although the large majority of dietary stud-
until further use. DNA amplification was performed using the COI
ies has been based on a single PCR per sample (e.g., Burgar et al.,
primers ZBJ‐ArtF1c and ZBJ‐ArtR2c (Zeale, Butlin, Barker, Lees, &
2014; Crisol‐Martínez et al., 2016; Emrich et al., 2014; Razgour et
Jones, 2011), modified to contain Illumina adaptors and a 5‐bp iden-
al., 2011; Sedlock et al., 2014). Metabarcoding was carried out sepa-
tification barcode. Each plate was then amplified in three indepen-
rately for each combination of bat × pellet (or pool) × PCR, yielding
dent reactions (replicates) with amplification primers containing
960 sampling units, for which we recorded the presence/absence of
different barcode sequences. The PCR were carried in volumes of
each prey species. To investigate the effects of pellet sample size on
10 μl, comprised of 5 μl of Qiagen Multiplex PCR Master Mix, with
the results of dietary studies, we selected randomly one PCR repli-
0.3 μl of each 10 pM primer and 1 μl of DNA extract. Cycling condi-
cate per pellet (320 sampling units) and quantified how increasing
tions used initial denaturing at 95°C for 15 min, followed by 35
the number of pellets analysed affected estimates of both diet diver-
cycles of denaturing at 95°C for 30 s, annealing at 45°C for 30 s
sity and the frequency of occurrence (FO) of the most important
and extension at 72°C for 30 s, with a final extension at 72°C for
prey species. Also, we compared diet diversity and FO estimates for
10 min. Amplification success was checked by visually inspecting
separate pellets and pooled samples. Finally, we used the overall
2 μl of each PCR product on a 2% agarose gel. Library preparation
sample to quantify the contribution of variation among individual
followed the manufacturer's protocol for metagenomic sequencing
bats, pellets and PCR replicates to variation in diet composition.
(Illumina). PCR products were purified using Agencourt AMPure XP beads (Beckman Coulter) and subsequently quantified using Nano-
2.2 | Bat pellet sampling
Drop and diluted to similar concentrations. All the 12 cleaned PCR plates were then pooled into a single plate, as each plate contained
European free‐tailed bats (Tadarida teniotis) were mist‐netted at their
a different barcode. Illumina indexes were added to the cleaned PCR
roosts in five bridges located in northeast Portugal (N41°09′–
products using the Nextera XT Kit (Illumina), allowing individual
42°00′), in April–October 2012 and 2013, under an ongoing moni-
identification of each amplified product. Indexed samples were again
toring programme (Amorim, Mata, Beja, & Rebelo, 2015). Individual
cleaned and then pooled at equimolar concentrations and sequenced
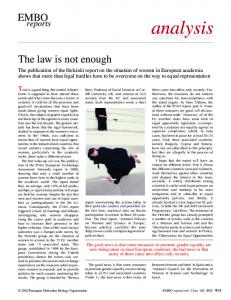
F I G U R E 1 Scheme of experimental design, indicating that analyses were based on faecal pellets collected from 20 bats, with 15 separate pellets and a pool of 15 pellets per bat, and three PCR replicates per pellet/pool (n = 960 sampling units)
4
|
MATA
ET AL.
using a whole v2 run of a MiSeq desktop sequencer (Illumina; ~0.1%
Accumulation curves were carried out using the “INEXT” package
coverage per sample). To test for the effect of sequencing depth on
(Hsieh, Ma, & Chao, 2016), and GLMMs were implemented using
individual and pooled pellets, an additional MiSeq run was used,
LME4
(Bates, Mächler, Bolker, & Walker, 2015).
where one pellet and a pool were selected per individual and
The contribution of biological and technical replication to varia-
sequenced at “low coverage” (0.1%) and “high coverage” (1.5%). The
tion in diet composition was analysed using PerMANOVA (Anderson,
actual coverages achieved are provided in Supporting Information
2001). Specifically, we modelled the contribution of three indepen-
Table S1.
dent components: (a) bats, (b) pellets within bats and (c) PCRs within pellets within bats to the observed differences in species composi-
2.4 | Bioinformatics and prey identification
tion among sampling units. The contribution of each component while controlling for differences in degrees of freedom was esti-
We used OBITools (Boyer et al., 2016) for general sequence pro-
mated from the corresponding mean sum of squares (MSS). We used
cessing. Briefly, paired‐end reads were aligned and assigned to sam-
a nested design because we were interested in how analysing sev-
ples, barcodes and primers were removed, and finally, sequences
eral pellets per individual contributed to variation in estimates of diet
were collapsed into haplotypes. Singletons were removed, as well as
composition and not in actual dietary variation among pellets. Like-
sequences smaller than 155 bp and longer than 159 bp. The remain-
wise, we were interested in the contribution of variation among
ing haplotypes went through “obiclean,” a method that allows the
PCRs of the same pellet and not in variations among PCRs per se.
removal of haplotypes differing 1 bp from each other, if one has a
As a measure of the statistical significance of each component, we
higher read count than the other in every sample. From each PCR,
used an F‐statistic estimated with a permutation procedure (10,000
we further removed haplotypes representing less than 1% of the
permutations), based on randomizations of the residuals of the “re-
total number of reads and those containing stop codons. We then
duced” model (randomized residual permutation procedure—RRPP).
compared the haplotypes retained against known sequences within
We also used PERMANOVA to test for significant differences in
the
BOLD
database
(www.boldsystems.org)
and
unpublished
prey composition inferred from pools of 15 pellets and 15 separate
sequences of arthropods collected in northern Portugal. Haplotypes
pellets.
that best matched the same species were collapsed into a single
“procD.lm” of the “GEOMORPH” package (Adams, Collyer, Kaliont-
taxon unit. For the haplotypes for which only family, order or class‐
zopoulou, & Sherratt, 2017).
PerMANOVA
was
implemented
using
the
function
level identification was possible, a neighbour‐joining tree was built
The effects of the number of pellets analysed per individual on
with all haplotypes to cluster similar sequences (>98% similarity) into
FO estimates of each prey species at the level of the overall sample
distinct taxa (e.g., Cerambycidae haplotypes with divergences above
(20 individuals) were evaluated using a simulation approach. Specifi-
98% among them were clustered into Cerambycidae 1, Cerambyci-
cally, from each bat, we randomly sampled from n = 1 to 14 pellets
dae 2 and so on). Although this approach may artificially increase
from the overall pellet sample, to generate the empirical distribution
the number of taxa present in some cases, it was taken to avoid
of FO estimates at each sample size. For instance, when n = 2 pel-
removing from further analysis taxa that are less represented on
lets, we sampled with replacement two pellets from the pool of 15
and for which genus or species‐level identification is often not
pellets analysed per bat, for all bats, and then estimated the FO of a
BOLD
possible.
given prey species from the proportion of bats in which that species was detected. Repeating this procedure 10,000 times produced the
2.5 | Data analysis
empirical distribution of FO estimates for n = 2 pellets. We then computed the estimation error for each n, as the simple difference
We analysed how pellet sample size affected estimates of diet diver-
between the FO estimated using 15 pellets per bat and the FO esti-
sity by building species accumulation curves per individual, as a func-
mated using n pellets per bat. To further understand the sources of
tion of the number of pellets analysed (Colwell & Coddington, 1994).
variability in FO estimates, we modelled the estimation error per pel-
We used both the actual number of species recorded and the Chao2
let sample size and prey species, in relation to the number of pellets
estimator of species richness (Chao & Chiu, 2016). We then aver-
analysed, the FO of that prey in the sample of 20 bats estimated
aged estimates for each pellet sample size across the 20 bats anal-
using 15 pellets per individual (FOtot), the average frequency of
ysed, to produce a mean species accumulation curve per individual.
occurrence of that prey species within individuals that consumed it
Estimates along this curve were compared to richness estimates
(FOpel) and the first‐ and second‐order interactions between the
obtained from the analysis of a pellet pool per individual. To evalu-
main effects, also using 15 pellets per individual. FOtot was used to
ate the effects of sequencing depth, we tested for the difference in
investigate whether error rates tended to be systematically lower (or
species richness in estimates based on one pellet and on a pool of
higher) in prey consumed frequently by the population, whereas
15 pellets, both at low and at high coverage. We used generalized
FOpel was used to investigate whether error rates tended to be sys-
mixed linear models (GLMM) with logit link and binomial errors,
tematically lower (or higher) in prey that was frequently consumed
specifying individual bats as the random component, to test whether
by particular individuals, although not necessarily at the population
the probability of detecting a given prey item in pools was related to
level. We also used beta regression to estimate whether the error
its frequency of occurrence in the sample of separate pellets (FOpel).
rates of FO estimates in pools varied in relation to FOtot and FOpel.
MATA
|
ET AL.
5
Simulations were implemented in the R script described in Supple-
(Table 1). However, the highest variation in the identity of species
mentary Material, while beta regression was carried out using the
consumed was associated with the individual bats (MSS = 8.63).
“BETAREG” package (Cribari‐Neto & Zeileis, 2010).
Variation associated with pellets within individuals was much lower (MSS = 0.56), but still about thirteen times higher than variation associated with PCRs within pellets (MSS = 0.04), indicating that
3 | RESULTS
there was little variation in the identity of species retrieved from replicate PCRs of the same pellet. PERMANOVA also showed signifi-
Metabarcoding of free‐tailed bat faecal pellets detected 153 taxa
cant differences in diet composition between the pools of 15 pellets
from nine insect orders, of which 65.4% were Lepidoptera (Support-
and the 15 pellets analysed separately (F = 2.20, R2 = 0.0547,
ing Information Table S2). Most taxa (77.1%), including 95% of the
p = 0.003).
Lepidoptera, were unambiguously assigned to a single species or to
Variation in the mean FO estimates in relation to the number of
a group of two or three closely related species within the same
pellets analysed per individual showed a consistent pattern, being
genus. The seven species with the highest frequencies of occurrence
strongly underestimated when the number of pellets analysed was
(>20% of pellets) were all moths of the family Noctuidae: Mythimna
low and progressively converging to the “true” value with increasing
vitellina (70.3%); Autographa gamma (64.3%); Agrotis segetum (45.3%);
pellet sample size (Figure 3). Accordingly, the mean error rates of
Peridroma saucia (35.7%); Noctua pronuba/janthe (28.7%); Phlogophora
the estimates were particularly high when just one or two pellets
meticulosa (25.3%); and Hoplodrina ambigua (23.7%).
were analysed per bat, but they declined thereafter. The beta regres-
The estimates of diet diversity per individual were strongly
sion model indicated that variation in the error rates of FO estimates
affected by the number of pellets analysed, either when using the
was largely accounted for (pseudo R2 = 0.84) by the significant
actual number of species detected or when using Chao2 species
effects of variation in the number of pellets analysed and the fre-
richness estimator (Figure 2). On average, it was necessary to anal-
quencies of occurrence of the prey item in the sample of 20 bats
yse seven and 12 pellets to record about 80% and 95%, respectively,
(FOtot) and in the sample of 15 pellets per bat (FOpel) (Supporting
of the species detected in the overall sample of 15 separate pellets
Information Table S3). The error rates always declined with the num-
per bat. Estimates of diet diversity per bat were much lower (paired‐
ber of pellets analysed per individual, but for a given sample size,
sample t tests: t = 6.03, df = 19, p < 0.0001) in pooled samples of
the error rates tended to be higher for species with high FOtot (i.e.,
15 pellets (mean ± SD: 5.0 ± 1.7) than in 15 pellets analysed sepa-
prey items consumed frequently by the population) and that they
rately (16.3 ± 8.4). Actually, either for low or for high sequencing
tended to be lower for species that had higher FOpel (i.e., prey items
depth, the average number of species detected was not significantly
consumed frequently by particular individuals) (Figure 4). The mean
different (low: t = 4.07, df = 19, p = 0.176; high: t = 1.26, df = 19,
error rate of FO estimates was much higher (t = −29.35, df = 134,
p = 0.222) in a pool of 15 pellets (low: 5.3 ± 1.8; high: 5.4 ± 1.8) and
p < 0.0001) in pool samples of 15 pellets (82.4% ± 32.5%) than in
in a single pellet (low: 6.3 ± 3.9; high: 6.2 ± 3.7). The GLMM indi-
14 pellets analysed separately (2.2% ± 2.9%). Regarding sequencing
cated that the probability of detecting a given prey item in a pool
coverage, either for low or for high sequencing depth, the error rates
was strongly related to its frequency of occurrence in the diet esti-
were similar, but significantly higher (low: t = −3.13, df = 134,
mated from the 15 separate pellets per individual (regression coeffi-
p = 0.002; high: t = −2.46, df = 134, p = 0.015) in a pool of 15 pel-
cient [FOpel] = 5.958, SE = 0.6795, z = 8.768, p < 0.001; Supporting
lets (low: 80.5% ± 34.0%; high: 79.5% ± 34.5%) than in a single pellet
Information Figure S1).
(low: 69.5% ± 40.7%; high: 71.6% ± 40.0%). Beta regression indicated
PerMANOVA showed that variation in species composition
that FOpel was the main factor affecting variation in the error rate
among sampling units was significantly affected by variation among
of pool FO estimates across prey items (Figure 5; Supporting Infor-
individuals, pellets within individuals and PCRs within pellets
mation Table S4).
20
40
(a)
15
30
10
20
5
10
0
0
5
10
15
0
(b)
0
5
10
15
F I G U R E 2 Accumulation curves for the number of (a) detected and (b) estimated (Chao2) prey species per bat, when varying the number of pellets analysed from one to 15. The curves show averages across 20 individual bats analysed, and error bars are the standard errors of mean estimates
6
|
MATA
ET AL.
4 | DISCUSSION
T A B L E 1 Summary results of PerMANOVA estimating the contributions of individuals, pellets within individuals and PCRs within pellets, to overall variation in diet composition
The results of our empirical case study focusing on the European
SS
MS
R2
F
p‐ value
19
163.93
8.6280
0.4703
21.6758
0.0001
tor diets. Specifically, we show strong effects of (a) the number of
Individual:pellet
280
158.15
0.5648
0.4538
2.7493
0.0001
samples analysed per individual on estimates of diet diversity; (b) the
Individual: pellet:PCR
600
26.45
0.0441
0.0759
1.4981
0.0001
number of individuals, samples per individual and, to a much lesser
Coefficient Individual
Residuals Total
df
replication on the results of metabarcoding studies of animal preda-
extent, the number of PCRs per sample on estimates of diet compo0 899
0
sition; and (c) the number of pellets per individual on estimates of
348.54
frequency of occurrence of prey items. Also, we show that analysing
Note. Statistical significance was estimated from randomized residual permutation procedure, with 10,000 permutations. Significant values (p > 0.05) are represented in bold.
Agrotis segetum
(a)
free‐tailed bat clearly show the impact of technical and biological
pools of samples provides much poorer results than analysing separate samples to estimate diet descriptors. Therefore, our results demonstrate the importance of the levels of biological replication for
Hoplodrina ambigua
Nineta flava
Peridroma saucia
Nomophila noctuella
1.0
0.8
FOtot
0.6 FOpool 0.4
0.2 FO error 0.0
(b)
Autographa gamma
1.0
0.8
0.6
0.4
0.2
0.0 2
6
10
14
2
6
10
14
2
6
10
14
F I G U R E 3 Variation in the empirical distribution of frequency of occurrence (FO) estimates (circles), in relation to the number of pellets analysed per individual, for prey items with low (a) and high (b) intraindividual FO (FOpel). Thin black lines are the FO of prey items estimated from the analysis of 15 pellets per individual (FOtot) and light shaded areas the corresponding binomial confidence interval. Thick black lines represent the mean error of FO estimates. Dashed lines represent estimated FO from pools (FOpool)
MATA
|
ET AL.
ll Pe 14
12
ets
10
8
6
4
2
0.2
7
FOpel 0.4
0.6
1.0
0.8 0.8
% FO error
0.8 0.6
0.6 0.4
0.4
0.2 0.2
F I G U R E 4 Fitted response surfaces inferred from a beta regression model showing how the error rates of frequency of occurrence (FO) estimates of prey items in the diet of European free‐tailed bats varied in relation to the number of pellets analysed and the mean frequency of occurrence of the prey items within individuals that consumed that prey (FOpel), at four levels of the frequency of occurrence of the prey items in the overall bat sample (FOtot, n = 20)
FOtot = 0.75
FOtot = 0.55
FOtot = 0.25
FOtot = 0.05
0.0
adequately describing diets using metabarcoding. These results sug-
descriptors. However, when species are rare or otherwise difficult to
gest that the small sample sizes in the range currently used by many
sample, more limited sampling may still be useful to provide over-
studies may be insufficient to provide robust estimates of diet
views of the prey consumed. Although our results are based on a single case study that may
1
be affected by some idiosyncrasies and limitations, this is unlikely to affect the generality of our conclusions to a significant extent. One possibility is that our results were largely driven by the particular
0.8
species studied, as it consumes a wide range of different prey items (Mata et al., 2016; this study), and thus, it may require higher levels
0.6
of replication than species with less diverse diets. Although diverse diets may indeed be more difficult to estimate (Nielsen et al., 2017), there are many species such as insectivore bats and birds that feed
0.4
on a very wide range of taxa and thus may be as prone to insufficient biological replication as European free‐tailed bats. Another limitation is that we did not have information on the “true” diet, against
0.2
which our metabarcoding results could be compared. Previous field
0
studies have circumvented this problem by comparing metabarcoding
0
0.2
0.4
0.6
0.8
F I G U R E 5 Fitted response curves inferred from a beta regression model showing how the error rates of frequency of occurrence (FO) estimates of prey items in pooled samples varied in relation to the frequency of occurrence within the pellets of individual bats (FOpel), at four levels of the frequency of occurrence of the prey items in the overall bat sample (n = 20; FOtot = 0.75, 0.55, 0.25 and 0.05 for black line, large dash line, small dash line and point line, respectively)
1
results with those from visual or stable isotope analysis (Nielsen et al., 2017), but this is not without problems, because all methods have their own errors and biases. Therefore, these comparisons do not show which method is closer to the “truth,” but only whether different methods provide consistent results. In these circumstances, we believe that our approach of assessing how estimates of diet descriptors vary with replication levels is warranted, although further research is needed on the extent to which the method provides accurate estimates of what is actually eaten by free‐ranging animals.
8
|
MATA
ET AL.
Finally, our study was based on the analysis of just 20 bats, with all
Almeida, 2017), but our results suggest that this strategy may lead
pellets of each bat collected in the same night, and thus, it might be
to substantial errors in the estimation of dietary descriptors. We
argued that our own study had insufficient biological replication.
found that pools strongly underestimated diet diversity and the fre-
Although this sample size is comparable to that of previous studies,
quency of occurrence of prey items, irrespective of sequencing
we recognize that it may be insufficient to describe in detail the diet
depth, yielding results comparable to those obtained by analysing a
of European free‐tailed bats. However, it highlights the difficulties of
single pellet. Prey items consumed less frequently were consistently
accurately estimating what 20 individuals have eaten during a single
missed when analysing pools, and there were high error rates of FO
night, thereby emphasizing the challenges of inferring diets for entire
estimates for both common and rare prey items. The reason why
populations over long time frames. This problem is not restricted to
pools did not detect more species, even with high sequencing depth,
DNA metabarcoding studies of diet, however, except that their
is not entirely clear as it seems somewhat counterintuitive, because
increased sensitivity of detection will make real biological variation
the DNA from species in individual pellets should also be present in
in diet more detectable. Population diet is an inherently complicated
a mix of the same pellets. However, common species in a mix will
ecological trait to characterize by any methodology, and this has
become proportionally more abundant, and rare species, which
been noted in the past for many dietary studies using different
appear in low quantities in just a few pellets, will show an even
methodologies (Nielsen et al., 2017).
smaller proportion. Therefore, the most likely explanation is that low
Our results support the view that technical replication affects
abundance templates are not detected because of competition dur-
the estimates of diet descriptors (e.g., Alberdi et al., 2017; Pansu et
ing PCR with proportionally more abundant templates. It is also pos-
al., 2015; Willerslev et al., 2014), although its impact was much
sible that during DNA extraction, pooled samples might saturate the
lower than that of biological replication. Although there was varia-
spin column and only the most common species get eluted. Never-
tion among PCR replicates in the composition of prey items, this
theless, the error in frequency of occurrence estimates is still slightly
was about 13 times lower than variation among pellets of the same
higher for pools even for common species. This is because pools
individual bat and about 200 times lower than variation among bats.
seem to detect mostly what is highly abundant within individuals,
The low variation among PCR replicates suggests that prey DNA
meaning that the analysis of a single pellet is as likely to detect
concentration was high and its degradation was low in bat faecal
abundant species as is the analysis of a pool. It should be noted,
pellets, which are factors known to affect the amount of false posi-
however, that pooling may still be a necessary step when the initial
tives and negatives and thus technical reproducibility in metabarcod-
DNA template is too low for extraction and amplification, although
ing studies (Ficetola et al., 2015). In contrast to PCR replicates, the
results need to be interpreted carefully given the errors associated
magnitude of variation among individuals was particularly striking,
with sample pooling revealed in our study.
suggesting that different individuals fed on different prey items. Rea-
Taken together, our results have important implications for the
sons for this are unknown, but they may be related to the effects of
design of metabarcoding dietary studies, emphasizing the prominent
season, gender, age or foraging habitat. Random factors may also
role of biological replication to obtain robust estimates of diet diver-
have played a major role, related to haphazard encounters between
sity and composition, and the frequency of occurrence of prey items.
each foraging bat and a particular set of prey items in the night
In particular, the high variability reported here both among and
when pellets were collected. Variation among pellets of the same
within individuals points out that large numbers of individuals and
individual is also noteworthy, with the accuracy of diet diversity and
sufficiently large numbers of samples per individual need to be anal-
frequency of occurrence estimates increasing markedly with the
ysed if the true diversity of the population's diet is to be recovered.
number of pellets analysed. These results seem surprising, because it
Determination of sufficient levels of biological replication in general,
might be expected that different pellets collected in the same time
however, will depend on the particular scientific questions being
from a single individual would be representative of a single meal
asked and the dietary characteristics of the species being studied.
consumed in that night, thereby leading to low variability in dietary
For instance, although in conventional studies of bat diets, it is gen-
information among pellets. However, bats have an extremely rapid
erally agreed that 20–50 samples should be analysed for each eco-
digestion and a high passage rate of food through the digestive tract
logical group under study (e.g., species, site, season, gender and age;
(Staliński, 1994), and thus, differences in pellet content within indi-
Whitaker et al., 2009), this may or may not be sufficient dependent
viduals may reflect prey consumed at different times during the
on the levels of variability within groups and the actual differences
same night. As a consequence, when the number of pellets analysed
in the value of diet descriptors among groups. Larger sample sizes
per individual is low, there are many prey items missed and high
may thus be needed to detect differences in trophic niche between
error rates in frequency of occurrence estimates, particularly for prey
two species showing high intraspecific dietary heterogeneity due to
items that are consumed by many individuals, but at low frequencies
gender, age or seasonal effects than between adult males and
by each individual.
females of the same species on a given season, for example. On the
Pooling of samples before DNA extraction has been used to
other hand, smaller sample sizes may be more acceptable in studies
reduce processing time and costs by integrating variability among
aiming to provide broad descriptions of dietary patterns in diverse
multiple samples or when individual samples were difficult to sepa-
species communities, particularly when these include species that
rate (Burgar et al., 2014; Clare et al., 2014a, 2014b; Jedlicka, Vo, &
are rare or otherwise difficult to study than when testing specific
MATA
|
ET AL.
hypothesis in community ecology requiring precise dietary estimates. Therefore, scoping studies may need to be conducted before embarking in full‐scale projects, using power analysis to estimate the levels of biological replication required to detect a given effect size at a predefined probability level (Ferry & Cailliet, 1996). When this is impractical, researchers may need to take a precautionary approach and try to maximize the number of samples analysed, which is increasingly feasible due to the ever lower costs of high‐throughput DNA sequencing.
ACKNOWLEDGMENTS The study was funded by Fundação para Ciência e Tecnologia (FCT) (Project LTER/BIA‐BEC/0004/2009), EDP Biodiversity Chair and the ERA Chair in Environmental Metagenomics (EU Horizon 2020 Research and Innovation Programme Grant agreement No 668981). FCT funded Vanessa Mata (PD/BD/113462/2015), Hugo Rebelo (IF/00497/2013) and Francisco Amorim (PD/BD/52606/2014). The authors would like to thank Pedro Tarroso for developing R scripts and Joana Veríssimo for helping with the laboratory work.
DATA ACCESSIBILITY Filtered sequencing data and haplotype identification are available on Electronic Supplementary Material (ESM).
AUTHOR'S CONTRIBUTIONS V.A.M., H.R., S.J. and P.B. designed the study. V.A.M. and F.A. collected the samples. V.A.M. performed the laboratory analysis. V.A.M., H.R. and P.B. analysed the data. V.A.M. and P.B. led the writing with substantial contributions from all authors.
ORCID http://orcid.org/0000-0003-3005-9030
Vanessa A. Mata Hugo Rebelo
https://orcid.org/0000-0002-7118-4068
Francisco Amorim Simon Jarman Pedro Beja
https://orcid.org/0000-0002-7731-9242 http://orcid.org/0000-0002-0792-9686
https://orcid.org/0000-0001-8164-0760
REFERENCES Adams, D. C., Collyer, M. L., Kaliontzopoulou, A., & Sherratt, E. (2017). Geomorph: Software for geometric morphometric analyses. R package version 3.0.5. Retrieved from https://cran.r-project.org/package= geomorph Albaina, A., Aguirre, M., Abad, D., Santos, M., & Estonba, A. (2016). 18S rRNA V9 metabarcoding for diet characterization: A critical evaluation with two sympatric zooplanktivorous fish species. Ecology and Evolution, 6(6), 1809–1824. https://doi.org/10.1002/ece3. 1986 Alberdi, A., Aizpurua, O., Gilbert, M. T. P., & Bohmann, K. (2017). Scrutinizing key steps for reliable metabarcoding of environmental samples.
9
Methods in Ecology and Evolution, 38(1), 42–49. https://doi.org/10. 1111/2041-210X.12849 Amorim, F., Mata, V. A., Beja, P., & Rebelo, H. (2015). Effects of a drought episode on the reproductive success of European free‐tailed bats (Tadarida teniotis). Mammalian Biology, 80(3), 228–236. https://d oi.org/10.1016/j.mambio.2015.01.005 Anderson, M. J. (2001). A new method for non parametric multivariate analysis of variance. Austral Ecology, 26(2001), 32–46. https://doi. org/10.1111/j.1442-9993.2001.01070. pp. x Arrizabalaga-Escudero, A., Garin, I., García-Mudarra, J. L., Alberdi, A., Aihartza, J., & Goiti, U. (2015). Trophic requirements beyond foraging habitats: The importance of prey source habitats in bat conservation. Biological Conservation, 191, 512–519. https://doi.org/10.1016/j.bioc on.2015.07.043 Baker, R., Buckland, A., & Sheaves, M. (2014). Fish gut content analysis: Robust measures of diet composition. Fish and Fisheries, 15(1), 170– 177. https://doi.org/10.1111/faf.12026 Bates, D., Mächler, M., Bolker, B., & Walker, S. (2015). Fitting linear mixed‐effects models using lme4. Journal of Statistical Software, 67(1), 1–48. https://doi.org/10.18637/jss.v067.i01 Biffi, M., Gillet, F., Laffaille, P., Colas, F., Aulagnier, S., Blanc, F., … Michaux, J. R. (2017). Novel insights into the diet of the Pyrenean desman (Galemys pyrenaicus) using next‐generation sequencing molecular analyses. Journal of Mammalogy, 98(5), 1497–1507. https://doi.org/10.1093/jmammal/gyx070 Bohmann, K., Monadjem, A., Noer, C., Rasmussen, M., Zeale, M. R. K., Clare, E. L., … Gilbert, M. T. P. (2011). Molecular diet analysis of two African free‐tailed bats (Molossidae) using high throughput sequencing. PLoS ONE, 6(6), e21441. https://doi.org/10.1371/journal.pone.0021441 Boyer, F., Mercier, C., Bonin, A., Le Bras, Y., Taberlet, P., & Coissac, E. (2016). obitools: A Unix‐inspired software package for DNA metabarcoding. Molecular Ecology Resources, 16(1), 176–182. https://doi.org/ 10.1111/1755-0998.12428 Burgar, J. M., Murray, D. C., Craig, M. D., Haile, J., Houston, J., Stokes, V., & Bunce, M. (2014). Who's for dinner? High‐throughput sequencing reveals bat dietary differentiation in a biodiversity hotspot where prey taxonomy is largely undescribed. Molecular Ecology, 23(15), 3605–3617. https://doi.org/10.1111/mec.12531 Chao, A., & Chiu, C.-H. (2016). Species richness: Estimation and comparison. Wiley StatsRef: Statistics Reference Online, 1–26, https://doi.org/ 10.1002/9781118445112.stat03432.pub2 Clare, E. L., Symondson, W. O. C., Broders, H., Fabianek, F., Fraser, E. E., Mackenzie, A., … Reimer, J. P. (2014a). The diet of Myotis lucifugus across Canada: Assessing foraging quality and diet variability. Molecular Ecology, 23(15), 3618–3632. https://doi.org/10. 1111/mec.12542 Clare, E. L., Symondson, W. O. C., & Fenton, M. B. (2014b). An inordinate fondness for beetles? Variation in seasonal dietary preferences of night‐roosting big brown bats (Eptesicus fuscus). Molecular Ecology, 23 (15), 3633–3647. https://doi.org/10.1111/mec.12519 Clarke, L. J., Soubrier, J., Weyrich, L. S., & Cooper, A. (2014). Environmental metabarcodes for insects: In silico PCR reveals potential for taxonomic bias. Molecular Ecology Resources, 14(6), 1160–1170. https://doi.org/10.1111/1755-0998.12265 Colwell, R. K., & Coddington, J. A. (1994). Estimating terrestrial biodiversity through extrapolation. Philosophical Transactions of the Royal Society B: Biological Sciences, 345(1311), 101–118. https://doi.org/10. 1098/rstb.1994.0091 Cribari-Neto, F., & Zeileis, A. (2010). Beta Regression in R. Journal of Statistical Software. Retrieved from http://www.jstatsoft.org/v34/i02/ Crisol-Martínez, E., Moreno-Moyano, L. T., Wormington, K. R., Brown, P. H., & Stanley, D. (2016). Using next‐generation sequencing to contrast the diet and explore pest‐reduction services of sympatric bird species in macadamia orchards in Australia. PLoS ONE, 11(3), e0150159. https://doi.org/10.1371/journal.pone.0150159
10
|
De Barba, M., Miquel, C., Boyer, F., Mercier, C., Rioux, D., Coissac, E., & Taberlet, P. (2014). DNA metabarcoding multiplexing and validation of data accuracy for diet assessment: Application to omnivorous diet. Molecular Ecology Resources, 14(2), 306–323. https://doi.org/10. 1111/1755-0998.12188 Deagle, B. E., Jarman, S. N., Coissac, E., Pompanon, F., & Taberlet, P. (2014). DNA metabarcoding and the cytochrome c oxidase subunit I marker: Not a perfect match. Biology Letters, 10(9), 20140562. https://doi.org/10.1098/rsbl.2014.0562 Deagle, B. E., Thomas, A. C., Shaffer, A. K., Trites, A. W., & Jarman, S. N. (2013). Quantifying sequence proportions in a DNA‐based diet study using Ion Torrent amplicon sequencing: Which counts count? Molecular Ecology Resources, 13(4), 620–633. https://doi.org/10.1111/17550998.12103 Elbrecht, V., & Leese, F. (2015). Can DNA‐based ecosystem assessments quantify species abundance? Testing primer bias and biomass‐ sequence relationships with an innovative metabarcoding protocol. PLoS ONE, 10(7), e0130324. https://doi.org/10.1371/journal.pone. 0130324 Elton, C. S. (1927). Animal ecology (J. S. Hexley, Ed.). New York: The Macmillan Company. Emrich, M. A., Clare, E. L., Symondson, W. O. C., Koenig, S. E., & Fenton, M. B. (2014). Resource partitioning by insectivorous bats in Jamaica. Molecular Ecology, 23(15), 3648–3656. https://doi.org/10.1111/mec. 12504 Ferry, L. A., & Cailliet, G. M. (1996). Sample size and data analysis: Are we characterizing and comparing diet properly? In GUTSHOP'96 (pp. 71–80). Ficetola, G. F., Pansu, J., Bonin, A., Coissac, E., Giguet-Covex, C., De Barba, M., … Taberlet, P. (2015). Replication levels, false presences and the estimation of the presence/absence from eDNA metabarcoding data. Molecular Ecology Resources, 15(3), 543–556. https://doi. org/10.1111/1755-0998.12338 Foster, R. J., Harmsen, B. J., & Doncaster, C. P. (2010). Sample‐size effects on diet analysis from scats of jaguars and pumas. Mammalia, 74(3), 317–321. https://doi.org/10.1515/MAMM.2010.006 Galan, M., Pons, J.-B., Tournayre, O., Pierre, É., Leuchtmann, M., Pontier, D., & Charbonnel, N. (2018). Metabarcoding for the parallel identification of several hundred predators and their prey: Application to bat species diet analysis. Molecular Ecology Resources, 18(3), 155721. https://doi.org/10.1111/1755-0998.12749 Gotelli, N. J., & Colwell, R. K. (2001). Quantifyinf biodiversity: Procedures and pitfalls in the measurement and comparison of species richness. Ecology Letters, 4(4), 379–391. https://doi.org/10.1046/j.1461-0248. 2001.00230.x Greenstone, M. H., Szendrei, Z., Payton, M. E., Rowley, D. L., Coudron, T. C., & Weber, D. C. (2010). Choosing natural enemies for conservation biological control: Use of the prey detectability half‐life to rank key predators of Colorado potato beetle. Entomologia Experimentalis et Applicata, 136(1), 97–107. https://doi.org/10.1111/j.1570-7458. 2010.01006.x Hope, P. R., Bohmann, K., Gilbert, M. T. P., Zepeda-Mendoza, M., Razgour, O., & Jones, G. (2014). Second generation sequencing and morphological faecal analysis reveal unexpected foraging behaviour by Myotis nattereri (Chiroptera, Vespertilionidae) in winter. Frontiers in Zoology, 11(1), 39. https://doi.org/10.1186/1742-9994-11-39 Hsieh, T. C., Ma, K. H., & Chao, A. (2016). iNEXT: iNterpolation and EXTrapolation for species diversity. R package version 2.0.12. Retrieved from http://chao.stat.nthu.edu.tw/blog/software-down load/ Jedlicka, J. A., Vo, A.-T. E., & Almeida, R. P. P. (2017). Molecular scatology and high‐throughput sequencing reveal predominately herbivorous insects in the diets of adult and nestling Western Bluebirds (Sialia mexicana) in California vineyards. The Auk, 134(1), 116–127. https://doi.org/10.1642/AUK-16-103.1
MATA
ET AL.
Kartzinel, T. R., & Pringle, R. M. (2015). Molecular detection of invertebrate prey in vertebrate diets: Trophic ecology of Caribbean island lizards. Molecular Ecology Resources, 15(4), 903–914. https://doi.org/ 10.1111/1755-0998.12366 Kaunisto, K. M., Roslin, T., Sääksjärvi, I. E., & Vesterinen, E. J. (2017). Pellets of proof: First glimpse of the dietary composition of adult odonates as revealed by metabarcoding of feces. Ecology and Evolution, 7 (20), 8588–8598. https://doi.org/10.1002/ece3.3404 Klare, U., Kamler, J. F., & MacDonald, D. W. (2011). A comparison and critique of different scat‐analysis methods for determining carnivore diet. Mammal Review, 41(4), 294–312. https://doi.org/10.1111/j. 1365-2907.2011.00183.x Krauel, J. J., Brown, V. A., Westbrook, J. K., & McCracken, G. F. (2018). Predator–prey interaction reveals local effects of high‐altitude insect migration. Oecologia, 186(1), 49–58. https://doi.org/10.1007/s00442017-3995-0 Layman, C. A., Giery, S. T., Buhler, S., Rossi, R., Penland, T., Henson, M. N., … Archer, S. K. (2015). A primer on the history of food web ecology: Fundamental contributions of fourteen researchers. Food Webs, 4, 14–24. https://doi.org/10.1016/j.fooweb.2015.07. 001 Lopes, C. M., De Barba, M., Boyer, F., Mercier, C., da Silva Filho, P. J. S., Heidtmann, L. M., … Taberlet, P. (2015). DNA metabarcoding diet analysis for species with parapatric vs sympatric distribution: A case study on subterranean rodents. Heredity, 114(5), 1–12. https://doi. org/10.1038/hdy.2014.109 Mata, V. A., Amorim, F., Corley, M. F. V., McCracken, G. F., Rebelo, H., & Beja, P. (2016). Female dietary bias towards large migratory moths in the European free‐tailed bat (Tadarida teniotis). Biology Letters, 12(3), 20150988. https://doi.org/10.1098/rsbl.2015.0988 Mollot, G., Duyck, P. F., Lefeuvre, P., Lescourret, F., Martin, J. F., Piry, S., … Tixier, P. (2014). Cover cropping alters the diet of arthropods in a banana plantation: A metabarcoding approach. PLoS ONE, 9(4), e93740. https://doi.org/10.1371/journal.pone.0093740 Nielsen, J. M., Clare, E. L., Hayden, B., Brett, M. T., & Kratina, P. (2017). Diet tracing in ecology: Method comparison and selection. Methods in Ecology and Evolution, 12(10), 1–14. https://doi.org/10.1111/2041210X.12869 Pagani-Núñez, E., Valls, M., & Senar, J. C. (2015). Diet specialization in a generalist population: The case of breeding great tits Parus major in the Mediterranean area. Oecologia, 179(3), 629–640. https://doi.org/ 10.1007/s00442-015-3334-2 Pansu, J., Giguet-Covex, C., Ficetola, G. F., Gielly, L., Boyer, F., Zinger, L., … Choler, P. (2015). Reconstructing long‐term human impacts on plant communities: An ecological approach based on lake sediment DNA. Molecular Ecology, 24(7), 1485–1498. https://doi.org/10.1111/ mec.13136 Piñol, J., Mir, G., Gomez-Polo, P., & Agustí, N. (2015). Universal and blocking primer mismatches limit the use of high‐throughput DNA sequencing for the quantitative metabarcoding of arthropods. Molecular Ecology Resources, 15(4), 819–830. https://doi.org/10.1111/17550998.12355 Pleguezuelos, J. M., & Fahd, S. (2004). Body size, diet and reproductive ecology of Coluber hippocrepis in the Rif (northern Morocco). Amphibia‐Reptilia, 25, 287–302. https://doi.org/10.1163/1568538 041975099 Razgour, O., Clare, E. L., Zeale, M. R. K., Hanmer, J., Schnell, I. B., Rasmussen, M., … Jones, G. (2011). High‐throughput sequencing offers insight into mechanisms of resource partitioning in cryptic bat species. Ecology and Evolution, 1(4), 556–570. https://doi.org/10.1002/ ece3.49 Rydell, J., & Arlettaz, R. (1994). Low‐frequency echolocation enables the bat Tadarida teniotis to feed on tympanate insects. Proceedings of the Royal Society B: Biological Sciences, 257, 175–178. https://doi.org/10. 1098/rspb.1994.0112
MATA
|
ET AL.
Sedlock, J. L., Krüger, F., & Clare, E. L. (2014). Island bat diets: Does it matter more who you are or where you live? Molecular Ecology, 23 (15), 3684–3694. https://doi.org/10.1111/mec.12732 Shehzad, W., Riaz, T., Nawaz, M. A., Miquel, C., Poillot, C., Shah, S. A., … Taberlet, P. (2012). Carnivore diet analysis based on next‐generation sequencing: Application to the leopard cat (Prionailurus bengalensis) in Pakistan. Molecular Ecology, 21(8), 1951–1965. https://doi.org/10. 1111/j.1365-294X.2011.05424.x Sheppard, S. K., Bell, J., Sunderland, K. D., Fenlon, J., Skervin, D., & Symondson, W. O. C. (2005). Detection of secondary predation by PCR analyses of the gut contents of invertebrate generalist predators. Molecular Ecology, 14(14), 4461–4468. https://doi.org/10.1111/ j.1365-294X.2005.02742.x Soininen, E. M., Gauthier, G., Bilodeau, F., Berteaux, D., Gielly, L., Taberlet, P., … Yoccoz, N. G. (2015). Highly overlapping winter diet in two sympatric lemming species revealed by DNA metabarcoding. PLoS ONE, 10 (1), e0115335. https://doi.org/10.1371/journal.pone.0115335 Staliński, J. (1994). Digestion, defecation and food passage rate in the insectivorous bat Myotis myotis. Acta Theriologica, 39(1), 1–11. Trites, A. W., & Joy, R. (2005). Dietary analysis from fecal samples: How many scats are enough? Journal of Mammalogy, 86(4), 704–712. https://doi.org/10.1644/1545-1542(2005) 086[0704:DAFFSH]2.0.CO;2 Valverde, J. A. (1967). Estructura de una comunidad mediterranea de Vertebrados terrestres, Vol. 1. Madrid: C.S.I.C. Vesterinen, E. J., Lilley, T., Laine, V. N., & Wahlberg, N. (2013). Next generation sequencing of fecal DNA reveals the dietary diversity of the widespread insectivorous predator Daubenton's Bat (Myotis daubentonii) in Southwestern Finland. PLoS ONE, 8(11), e82168. https://doi. org/10.1371/journal.pone.0082168
11
Whitaker, J. O. Jr., McCracken, G. F., & Siemers, B. M. (2009). Food Habits Analysis of Insectivorous Bats. In Thomas. H. Kunz, & S. Parsons (Eds.), Ecological and behavioral methods for the study of bats, 2nd ed. (pp. 567–592). Baltimore: The John Hopkins University Press. Willerslev, E., Davison, J., Moora, M., Zobel, M., Coissac, E., Edwards, M. E., … Taberlet, P. (2014). Fifty thousand years of Arctic vegetation and megafaunal diet. Nature, 506, 47–51. https://doi.org/10. 1038/nature12921 Zeale, M. R. K., Butlin, R. K., Barker, G. L. A., Lees, D., & Jones, G. (2011). Taxon‐specific PCR for DNA barcoding arthropod prey in bat faeces. Molecular Ecology Resources, 11(2), 236–244. https://doi.org/ 10.1111/j.1755-0998.2010.02920.x
SUPPORTING INFORMATION Additional supporting information may be found online in the Supporting Information section at the end of the article.
How to cite this article: Mata VA, Rebelo H, Amorim F, McCracken GF, Jarman S, Beja P. How much is enough? Effects of technical and biological replication on metabarcoding dietary analysis. Mol Ecol. 2018;00:1–11. https://doi.org/10.1111/mec.14779