Feb 17, 2011 - Since in most of the applications of compressed sensing such as the ... that can then be used for comparing compressed sensing algorithms.
How to Design Message Passing Algorithms for Compressed Sensing David L. Donoho∗,
Arian Maleki† and
Andrea Montanari∗,†
February 17, 2011
Abstract Finding fast first order methods for recovering signals from compressed measurements is a problem of interest in applications ranging from biology to imaging. Recently, the authors proposed a class of low-complexity algorithms called approximate message passing or AMP. The new algorithms were shown, through extensive simulations and mathematical analysis, to exhibit very fast convergence rate and high phase transition. This paper provides a step-by-step explanation of how these algorithms can be constructed, leveraging on the ideas from the graphical models theory, and message passing.
1
Introduction
There has been much recent effort on finding new algorithms for recovering sparse solutions of underdetermined system of linear equations. The `1 minimization, also known as the basis pursuit [7], has attracted attention as an efficient recovery algorithm. It solves the following optimization problem �
minimize ksk1 , subject to y = As ,
(1)
where s ∈ RN is the vector to be recovered, A is an n × N measurement matrix and y ∈ Rn includes the measurements. The solution of this problem can be obtained by generic linear programming or LP algorithms. However, high computational complexity of LP presents an obstacle for large problem sizes that occur very often in applications. Low computational complexity of iterative thresholding algorithms has made them an appealing alternative. Therefore many variations of this approach have been proposed in the literature [32, 19, 34, 10, 8, 17, 21, 16, 18, 4, 20, 27, 37, 36, 5, 6, 31, 2, 30, 23]. A generic form of iterative thresholding algorithms is, xt+1 = ηt (xt + A∗ z t ) z t = y − Axt ,
(2)
where xt ∈ RN is the current estimate. z t ∈ Rn is the residual. A∗ is the Hermitian of the matrix and finally ηt is a nonlinear function that imposes the sparsity or the structure of the signal on the estimation. Popular examples of such thresholding functions are soft thresholding where η(x; b) = sign(x)(x − b)+ and hard thresholding where η(x; b) = xI(|x| ≥ b). The threshold level b in these two cases may depend on the iteration t and there are different heuristics for setting this value. Whenever the arguments of these ∗
Department of Statistics, Stanford University
†
Department of Electrical Engineering, Stanford University
1
functions are vectors, it means that the function is applied component-wise to the elements of the vector. Unfortunately the iterative thresholding algorithms suffer either from slow convergence rate or low phase transition compared to `1 . In a recent paper [13], we proposed an algorithm that exhibits both the low computational complexity of iterative thresholding algorithms and the reconstruction power of the basis pursuit. The algorithm was dubbed AMP, for ‘approximate message passing’, and was inspired by the ideas from graphical models theory, message passing algorithms, and statistical physics. Starting from x0 = 0, the algorithm proceeds according to the following iteration, xt+1 = η(xt + A∗ z t ; β σ ˆ t ), z t = y − Axt + hη 0 (xt−1 + A∗ z t−1 ; β σ ˆ t−1 )i.
(3)
η is the soft thresholding function and z t and xt are similar to the corresponding notation in the generic iterative thresholding. We have also chosen the special value β σ ˆ t for the threshold levels. σ ˆ t is an estimate t ∗ t of the standard deviation of the ’noise’ ( x + A z − xo ) at time t and β is a constant parameter that shall be tuned optimally [13]. This noise is called multiple access interference noise. The only discrepancy from the generic iterative thresholding algorithms is the extra term hη 0 (A∗ z t−1 + xt−1 ˆt−1 )i in the calculation i ;τ of the residual. This term has a significant effect on the performance of the algorithm [13] while slightly increases the computational complexity. In this paper, it will be shown that this algorithm is equivalent to the sum product belief propagation algorithm if a suitable joint distribution is considered for the variables s1 , s2 , . . . , sN . Remarkably, AMP update rules are much simpler than the justifying sum-product rules. Such a striking simplification emerge in the large system limit. This is one instance of the “blessings of dimensionality”[11]. Apart from justifying the algorithms studied in [13], the unified derivation provided here allows to develop (1) an automatic way to set the threshold without any need for optimal tuning of parameter β and (2) other versions of the algorithm that are better suited for specific objectives. In particular, an important alternative of the problem (1) is 1 minimize λ ksk1 + ky − Ask22 , 2
(4)
also known as Basis Pursuit De-Noising (BPDN), or Lasso. We derive an iterative AMP algorithm for this problem that has exactly the same structure as the AMP with different threshold values. Finally, the approach presented here allows us to systematically incorporate further information concerning the distribution of the signal s, thus bridging the gap with a Baysian approach to compressed sensing reconstruction.
2
Contribution and organization of the paper
In this section we explain the notation that will be used throughout the paper and will then explain our main contributions. Finally we compare the ideas presented in this paper with the related work in the literature.
2.1
Notation
Let so be a vector in RN . We observe n < N linear measurements of this vector through the matrix A, y = Aso . The goal is to recover so from (y, A). Although the number of measurements is much smaller than the dimension of the signal, the problem can still be solved since the underlying signal is ‘structured’ in an appropriate sense. A specific notion of ‘simplicity’ amounts to postulating that s is either exactly or 2
approximately sparse. The columns of A are assumed to have unit `2 norm. a, b, c, . . . and and i, j, k, . . . denote the indices in [n] ≡ {1, 2, . . . , n} and [N ] ≡ {1, 2, . . . , N } respectively. The a, i element of the matrix A will be indicated as Aai . We are following the standard notation in graphical models where a, b, c, . . . represent the factor nodes and i, j, k, . . . are used for the variable nodes[26]. The elements of the vectors y, s, x, so are indicated by ya , si , xi , so,i respectively. Let δ = n/N be a measure of indeterminacy of the measurement system. Whenever we refer to the large system limit we consider the case where N → ∞ while δ is fixed. Since in most of the applications of compressed sensing such as the magnetic resonance imaging the problem of interest has millions of variables with tens of thousands of measurements, the large system limits of the algorithms are of particular interest. In addition large system limit provides very sharp and exact sampling theorems that can then be used for comparing compressed sensing algorithms [23]. It is worth mentioning that in practice, the algorithms we develop in this paper perform well even in the medium size problems where there are just thousands of variables and hundreds of measurements [13]. In the rest of this section we explain the original problems we want to solve and the corresponding iterative thresholding algorithms.
2.2
Basis pursuit problem
Consider the following distribution over the variables s1 , s2 , . . . , sN N n Y 1 Y µ(ds) = exp (−β|si |) δ{ya =(As)a } , Z
(5)
a=1
i=1
where δ{ya =(As)a } denotes a Dirac distribution on the hyperplane ya = (Ax)a . It is clear that as β → ∞, the mass of this distribution concentrates around the solution of (1). If the minimizer is unique and the marginals of µ are known, the solution of (1) will be immediate. Belief propagation provides a low-complexity heuristic for approximating such marginals. In order to introduce belief propagation, we consider the factor graph G = (V, F, E) with variable nodes V = [N ], factor nodes F = [n] and edges E = [N ] × [n] = {(i, a) : i ∈ [N ], a ∈ [n]}. Hence G is the complete bipartite graph with N variable nodes and n functional nodes. It is easy to see that the joint distribution (5) is structured according to this factor graph. The state variables of the belief propagation are the messages {νi→a }i∈V,a∈F , {ˆ νa→i }i∈V,a∈F associated with the edges of this graph. In the present case, messages are probability measures over the real line. Throughout this paper νi→a , νˆa→i denote densities. The update rules for the densities are Y t+1 t νi→a (si ) ∼ νˆb→i (si ) , (6) = e−β|si | b6=a t νˆa→i (si ) ∼ =
Z Y
t νj→a (si ) δ{ya −(As)a } ds .
(7)
j6=i
Here and below a superscript denotes the iteration number. Moreover, the symbol ∼ = denotes identity between probability distributions up to a normalization constant1 . Unfortunately this message passing algorithm has two problems. First, the messages are density functions over the real line and unless they have certain structure keeping track of these messages will be very difficult. Second, since the graph is dense the number of messages are 2nN and therefore the algorithm is computationally expensive. In section 3 we will prove that in the large system limit and as β → ∞ this complicated message passing algorithm is equivalent to the following simple iterative algorithm. 1 More precisely, given two non-negative functions p, q : Ω → R over the same space, we write p(s)∼ =q(s) if there exists a positive constant a such that p(s) = a q(s) for every s ∈ Ω.
3
Starting from x0 = 0 and τˆ0 = 1 the resulting iterative algorithm proceeds according to xt+1 = η(A∗ z t + xt ; τˆt ) , 1 z t = y − Axt + z t−1 hη 0 (A∗ z t−1 + xt−1 ˆt−1 )i , i ;τ δ τˆt−1 0 ∗ t−1 hη (A z + xt ; τˆt−1 )i . τˆt = δ
(8)
where η(x; b) = sign(x)(|x| − b)+ is the soft thresholding function applied entry-wise. η 0 is the first derivative of η with respect to the first argument and the notation h·i is the averaging operator. Intuitively t speaking the xti in the iterative algorithm corresponds to the mean of the message νi→a , zat corresponds to t t the mean of the message νˆa→i and finally τˆt corresponds to the variance of the message νi→a . For more careful definition and analysis of these terms refer to section 3. We will call this algorithm AM P.0.
2.3
BPDN problem
Now consider the following density function over the variables s = (s1 , . . . sN ). µ(ds) =
n N o n β Y 1 Y exp(−βλ|si |) exp − (ya − (As)a )2 ds . Z 2 i=1
(9)
a=1
Notice that the mode of this distribution coincides with the solution of BPDN and the distribution concentrates on its mode as β → ∞. In section 4 we will show that each iteration of the sum-product message passing algorithm is equivalent to the following AMP algorithm. xt = η(xt + A∗ z t ; λ + γ t ), 1 z t+1 = y − Axt + z t hη 0 (xt−1 + A∗ z t−1 ), i δ t λ + γ γ t+1 = hη 0 (Az t + xt ; γ t + λ)i . (10) δ The only difference between this algorithm and AMP.0 is in the way the threshold parameter is set. We call this algorithm AMP.A where A stands for the automatic threshold selection.
2.4
Theoretical Prediction
Statistical properties of approximate message passing algorithms allow us to accurately analyze the asymptotical performance of the algorithm. The state evolution framework introduced in [13] will be briefly reviewed in section 5. Based on this framework we derive the following equations that predict the evolution of AMP.0 and AMP.A algorithms. Assuming that the empirical distribution of so converges weakly to ps the state evolution equations are 1 2 τt+1 = σ 2 + E[η(X0 + τt Z; λ + γ t ) − X0 ]2 , δ γt + λ t+1 γ = E[η 0 (X0 + τt Z; λ + γ t )]. δ In these two equations (τ t , γ t ) are called the states of the system at time t. X0 and Z are two independent random variables with density function ps and N (0, 1) respectively. σ is the standard deviation of the measurement noise. In the above equations λ = 0, corresponds to the AMP.0 algorithm. 4
2.5
Extensions
The method we will propose for deriving the above AMP algorithms, enables us to incorporate more complicated priors (if available on the data). To demonstrate this we consider two more complicated priors in the extension section and develop the corresponding message passing algorithms. First, we will see how one can add a positivity constraint. Second, we will consider an arbitrary product distribution on the variables and will derive a simple iterative algorithm that is equivalent to the sum product belief propagation.
2.6 2.6.1
Comparison with other work First order methods
As mentioned in the introduction finding fast first order methods for `1 minimization is an active area of research and numerous approaches have been proposed [32, 19, 34, 10, 8, 17, 21, 16, 18, 4, 20, 27, 37, 36, 5, 6, 31, 2, 30, 23]. Here we just emphasize on the main differences between the algorithms constructed in this paper with those proposals. For more formal comparison the reader is referred to [25]. (1) The AMP algorithm is derived from the statistical point of view rather than linear algebraic or convex analysis view point. This makes the accurate analysis of the algorithm on compressed sensing problem possible. The linear algebraic analysis of the convergence rate may provide lower bounds that are far from the reality of compressed sensing problems. For instance, we are able to prove linear convergence of the estimate of AMP to the final solution, while the best result known for linear algebraic methods is strong convergence without any specific bound on the rate [10, 2, 8]. (2) As a result of the statistical analysis all the free parameters can be tuned optimally. Therefore the algorithms we propose are parameter free. Also the theoretical framework of this algorithm allows us to analyze different continuation strategies [21] which is considered as a difficult problem for other approaches. 2.6.2
Message passing algorithms
The use of message passing algorithms for compressed sensing problems was suggested before, see for instance [33]. However such a proposal faces two major difficulties. (1) According to the standard prescription, messages used in the the sum-product algorithm should be probability measures over the real line R, cf. Eqs. (12), (13). This is impractical from a computational point of view. That’s why simpler models such as mixture models are sometimes considered in these cases. (2) The factor graph on which the sum-product algorithm is run is the complete bipartite graph with N variable nodes, and n function nodes. In other words, unless the underlying matrix is sparse, the graphical model is very dense. This requires to update N n messages per iteration, and each message update depend on N or n input messages. Again this is very expensive computationally. (3) The use of belief propagation requires to define a prior on the vector so . For most applications, no good prior is available. 2.6.3
State evolution and replica calculations
In the context of coding theory, message passing algorithms are analyzed through density evolution [29]. The common justification for density evolution is that the underlying graph is random and sparse, and hence converges locally to a tree in the large system limit. In the case of trees density evolution is exact, hence it is asymptotically exact for sparse random graphs.
5
State evolution is the analog of density evolution in the case of dense graphs. For definitions and results on state evolution we refer to the [13, 12]. The success of state evolution cannot be ascribed to the locally tree-like structure of the graph, and calls for new mathematical ideas. The fixed points of state evolution describe the output of the corresponding AMP, when the latter is run for a sufficiently large number of iterations (independent of the dimensions n, N ). It is well known, within statistical mechanics [26], that the fixed point equations do indeed coincide with the equations obtained through a completely different non-rigorous approach, the replica method (in its replica-symmetric form). This is indeed an instance of a more general equivalence between replica and cavity methods. During the last year, several papers investigated compressed sensing problems using the replica method [28, 22, 9]. In view of the discussion above, it is not surprising that these results can be recovered from the state evolution formalism put forward in [13]. Let us mention that the latter has several advantages over the replica method: (1) It is more concrete, and its assumptions can be checked quantitatively through simulations; (2) It is intimately related to efficient message passing algorithms; (3) It actually allows to predict the performances of these algorithms.
2.7
Organization of the Paper
In the interest of clarity, we first present our results on the basis pursuit problem (1) in Section 3. We will then consider problem (4) in Section 4. Section 5 will be devoted to the asymptotic analysis of the algorithm and finally in section 6 we will be discussing more complicated priors.
3
AMP for reconstruction under hard constraints
In this section the basis pursuit optimization problem defined in Eq. (1) is considered. In the concrete √ √ derivation, for the sake of simplicity we assume that Aai ∈ {+1/ n, −1/ n}. This is not crucial, and only simplifies some of the calculations. The derivation of AMP proceeds in 4 steps: 1. Construct a joint distribution over (s1 , . . . , sN ), parameterized by β ∈ R+ , associated with the problem of interest. The distribution is structured according to a graphical model and it is immediate to write down the corresponding sum-product belief propagation algorithm. 2. Show, by central limit theorem argument, that in the large system limit, the sum product messages are well approximated by families with two scalar parameters. Derive the update rules for these parameters. 3. Find the limit β → ∞ (the entire mass of the distribution will concentrate around the mode) and get the appropriate rules for minimization. 4. Approximate the message passing rules for large systems with updates of the form (8).
3.1
Construction of the graphical model
We consider the following joint probability distribution over the variables s1 , s2 , . . . sN µ(ds) =
N n Y 1 Y exp (−β|si |) µA,y (ds) , Z a=1
i=1
where µA,y is the RLebesgue measure on the hyperplane {s : As = y}, and Z is a constant that ensures the normalization µ(ds) = 1. In other words, the weights that are assigned to the solutions of the linear
6
system As = y, decay exponentially with the `1 norm of the solutions. This measure can be written more explicitly as µ(ds) =
N n Y 1 Y exp (−β|si |) δ{ya =(As)a } . Z
(11)
a=1
i=1
Here and below δ{ya =(As)a } denotes a Dirac distribution on the hyperplane ya = (Ax)a . Products of such distributions associated with distinct hyperplanes yield a well defined measure. As we let β → ∞, the mass of the above distribution concentrates around the solution of (1). If the minimizer is unique and the marginals of µ are known, the solution of (1) will be immediate. Belief propagation provides a low-complexity heuristic for approximating marginals. We consider the factor graph G = (V, F, E) with variable nodes V = [N ], factor nodes F = [n], and edges E = [N ] × [n] = {(i, a) : i ∈ [N ], a ∈ [n]}. The update rules for the sum-product message passing algorithm on this graph are Y t+1 t (si ) , (12) νi→a (si ) ∼ νˆb→i = e−β|si | b6=a t νˆa→i (si ) ∼ =
Z Y
t νj→a (si ) δ{ya −(As)a } ,
(13)
j6=i
where superscript denotes the iteration number. In the next section we will try to find the form of the messages in the large system limit.
3.2
Large system limit
The main goal in this section is to show that in the large system limit as N → ∞ the messages have very simple forms. More specifically we show that under certain conditions that will be explained later for n, N t large, the messages νˆa→i ( · ) are approximately Gaussian distributions with variances of order N . On the t other hand, the densities of messages νi→a ( · ) are well approximated by the product of a Gaussian and a Laplace density. We state this fact formally below. Recall that, given two distributions µ1 , µ2 , their Kolmogorov distance is Z a Z a ||µ1 − µ2 ||K ≡ sup µ1 (dx) − µ2 (dx) . (14) a∈R
−∞
−∞
t The first Lemma provides an estimate for the messages νˆa→i . t t Lemma 3.1. Let xtj→a and (τj→a /β) be, respectively, the mean and variance of the distribution νj→a . R 3 t 0 Assume further |sj | dνj→a (sj ) ≤ Ct uniformly in N, n. Then there exists a constant Ct such that
Ct0 , t N 1/2 (ˆ τa→i )3/2 s � � βA2ai β t 2 φˆta→i (dsi ) ≡ exp (A s − z ) dsi , ai i a→i t t 2πˆ τa→i 2ˆ τa→i
t ||ˆ νa→i − φˆta→i ||K ≤
where the distribution parameters are given by X t za→i ≡ ya − Aaj xtj→a ,
t τˆa→i ≡
j6=i
X j6=i
7
t A2aj τj→a .
(15)
(16)
Proof. By an easy manipulation, we see that, for any Borel set S n o X t+1 νˆa→i (S) = P ya − Aaj sj ∈ Aai S , j6=i
where Aai S = {Aai x : x ∈ S}. Here probability is over the random vector (s1 , s2 , . . . , si−1 , si+1 , . . . , sN ), t t that is distributed according to the product measure ν1→a (s1 ) . . . νN →a (sN ). P Consider the random variable Z = ya − j6=i Aaj sj . According to the assumptions and the central limit theorem, Z is approximately normal. Clearly X E(Z) = ya − Aaj xtj→a , j6=i
Var(Z) =
X
t A2aj τj→a .
j6=i
The statement follows from Berry-Esseen Central limit theorem. t+1 Motivated by this lemma, we consider the computation of means and variances of the messages νi→a (si ). To state the result, it is convenient to introduce the family of densities o n 1 β (17) fβ (s; x, b) ≡ exp − β|s| − (s − x)2 . zβ (x, b) 2b
We also denote as follows its mean and variance (here Z has density fβ ( · ; x, b)) Fβ (x; b) ≡ Efβ ( · ;x,b) (Z) ,
Gβ (x; b) ≡ Varfβ ( · ;x,b) (Z) .
(18)
t Notice that, because of Eq. (16), τˆi→a is expected to concentrate tightly, and we will therefore assume that it is independent of the edge (i, a).
Lemma 3.2. Suppose that at iteration t, the messages from factor nodes to the variable nodes are set to t t t νˆa→i = φˆta→i , with φˆta→i defined as in Eq. (15) with parameters za→i and τˆa→i = τˆt . Then at the next iteration we have X t+1 t+1 2 t , τˆt ) . (19) νi→a (si ) = φt+1 (s ) {1 + O(s /n)} , φ (s ) ≡ f (s ; Abi zb→i i i i β i i→a i→a b6=a
In particular, the mean and variances of these messages are given by �X � X t t t xt+1 Abi zb→i ; τˆt ), τi→a = β Gβ Abi zb→i ; τˆt . i→a = Fβ ( b6=a
b6=a
Proof. Equation (19) is simply obtained by pointwise multiplication of the densities φˆta→i in Eq. (15), according to the general sum-product rule (12). More precisely, we obtain n o Y X β t+1 t t 2 νi→a (si ) ∼ νˆb→i (si ) = exp − β|si | − (A s − z ) = e−β|si | ai i b→i 2ˆ τt b6=a b6=a n �o X β �n − 1 2 t ∼ si − 2si Abi zb→i , = exp − β|si | − t 2ˆ τ n b6=a
t+1 2 t which coincides with φt+1 i→a (si ) up to terms of order si /n. Finally the formulae for xi→a and τi→a follow directly from the definitions of Fβ and Gβ .
8
t Summarizing the above discussion, and approximating τˆa→i with an edge-independent quantity τˆt , we reach to the following algorithm. �X � X t t t xt+1 = F A z ; τ ˆ , za→i ≡ ya − Aaj xtj→a , (20) β bi b→i i→a b6=a
j6=i
τˆt+1 =
3.3
β n
N X
Gβ
�X
i=1
� t Abi zb→i ; τˆt .
(21)
b
Large β limit
Although we gave simplified belief propagation formulas for a general value of β in the last section, but the special case β → ∞ is of particular interest since the mode of the distribution introduced in Eq. (11) is the same as the Basis pursuit solution. The goal of this section is to derive explicit and simple formulas for the two functions Fβ and Gβ in the large β limit. Consider the soft threshold function x − b if b < x, 0 if −b ≤ x ≤ b, η(x; b) = (22) x + b if x < −b. It is easy to confirm that, �
1 η(x; b) = arg min |s| + (s − x)2 2b s∈R
� .
(23)
In the β → ∞ limit, the integral that defines Fβ (x; b) is dominated by the maximum value of the exponent, that corresponds to s∗ = η(x; b). Therefore Fβ (x; b)→η(x; b) as β → ∞. The variance (and hence the function Fβ (x; b)) can be estimated by approximating the density fβ (s; x, b) near s∗ . Two cases can occur. If s∗ 6= 0, then at this point the derivative of the exponent is equal to zero and therefore the density can well be approximate with a Gaussian distribution and Gβ (x; b) = Θ(1/β). On the other hand if s∗ = 0, fβ (s; x, b) can be approximated by a Laplace distribution, leading to Gβ (x; b) = Θ(1/β 2 ). We summarize this discussion in the following lemma: Lemma 3.3. For bounded x, b, we have lim Fβ (x; β) = η(x; b) ,
β→∞
lim β Gβ (x; β) = b η 0 (x; b) .
β→∞
We are therefore led to the following message passing algorithm: �X � X t t t xt+1 = η A z ; τ ˆ , za→i ≡ ya − Aaj xtj→a , bi b→i i→a b6=a
(25)
j6=i
τˆt+1 =
3.4
(24)
τˆt Nδ
N X i=1
η0
�X
� t Abi zb→i ; τˆt .
(26)
b
From message passing to AMP
The updates in Eqs. (25), (26) are easy to implement but nevertheless the overall algorithm is still computationally expensive since it requires tracking of 2nN messages. The goal of this section is to further 9
simplify the message passing update equations. The modification we introduce is expected to become negligible in the large system limit, but reduces the computation cost dramatically. In order to justify approximation we assume that the messages can be approximated in the following way. xti→a = xti + δxti→a + O(1/N ), t t za→i = zat + δza→i + O(1/N ),
(27)
t with δxti→a , δza→i = O( √1N ) (here the O( · ) errors are uniform in the choice of the edge). We also consider a general message passing algorithms of the form �X � X t t xt+1 = η A z , z ≡ y − Aaj xtj→a , (28) t a bi a→i b→i i→a b6=a
j6=i
with {ηt ( · )}t∈N a sequence of differendiable nonlinear functions with bounded derivatives. Notice that the algorithm derived at the end of the previous section, cf. Eqs. (25), Eqs. (26), is indeed of this form, albeit with ηt non-differentiable at 2 points. This does not change the result, as long as the nonlinear functions are Lipschitz continuous. In the interest of simplicity, we shall stick to the differentiable model. Lemma 3.4. Suppose that the asymptotic behavior (27) holds for the message passing algorithm (28). Then xti and zat satisfy the following equations �X � t t xt+1 = η A z + x t ia a i + oN (1), i a
zat = ya −
X j
1 0 (A∗ z t−1 + xt−1 )i + oN (1), Aaj xtj + zat−1 hηt−1 δ
where the oN (1) terms vanish as N, n → ∞. Proof. To prove the lemma we substitute (27) in the general equations (28) and write the Taylor expansion t of the latter. The update equation for za→i yields X X t za→i = ya − Aaj xtj − Aaj δxtj→a + Aai xti +O(1/N ). | {z } j∈[N ] j∈[N ] δzat i {z } | zat
For xt+1 i→a we have xt+1 i→a = ηt (
X
b∈[n]
|
X
Abi zbt +
t Abi δzb→i ) − Aai zat ηt0 (
X
Abi zbt +
b∈∂i
b∈[n]
{z
}
xti
|
X
t Abi δzb→i ) +O(1/N ) .
b∈∂i
{z
δxti→a
}
In underbraces we have identified the various contributions. Substituting the expression indicated for t δxti→a , δza→i we obtain the recursion for xti and zat . In particular xti is updated according to X X t xt+1 = ηt ( Abi zbt + Abi δzb→i ) + o(1) i b∈[n]
= ηt (
X
b∈[n]
Abi zbt
+
b∈[n]
= ηt (
X
X
A2bi xti ) + o(1)
b∈[n]
Abi zbt + xti ) + o(1) .
b∈[n]
10
For zat we get zat = ya −
X
Aaj xtj +
= ya −
j∈[N ]
= ya −
X j∈[N ]
X
0 A2aj zat−1 ηt−1 (
Abj zbt−1 +
X
t−1 Aaj δza→j ) + o(1)
b∈[n]
b∈[n]
j∈[N ]
j∈[N ]
X
X
X X 1 Abi zbt−1 + xt−1 η0( Aaj xtj + zat−1 i ) + o(1) n b∈[n]
j∈[N ]
1 Aaj xtj + zat−1 hηt−1 ( δ
X
Abi zbt−1 + xt−1 i ) + o(1)i .
b∈[n]
This concludes the proof. This theorem naturally suggest a simplified form of the iterations (25), (26). The resulting algorithm can be written in the vector notation as xt+1 = η(A∗ z t + xt ; τˆt ) , 1 z t = y − Axt + z t−1 hη 0 (A∗ z t−1 + xt−1 ˆt−1 )i , i ;τ δ
(29)
where h · i denotes the average entry of a a vector. The recursion for τˆ is also as follows. τˆt =
4
τˆt−1 0 ∗ t−1 hη (A z + xt ; τˆt−1 )i . δ
(30)
AMP for reconstruction under soft constraints
Another popular reconstruction procedure in compressed sensing is the following optimization problem 1 minimize λksk1 + ky − Ask22 . 2
(31)
In this section we describe another approximate message passing algorithm for solving this optimization problem. We will follow closely the four-step procedure already outlined in the previous section. The algorithm that is derived is very similar to the AMP algorithm introduced in the previous section. The only difference is in the update rule for the threshold level.
4.1
Construction of the graphical model
As before we define a joint density distribution on the variables s = (s1 , . . . , sN ) N n n β o Y 1 Y µ(ds) = exp(−βλ|si |) exp − (ya − (As)a )2 ds . Z 2
(32)
a=1
i=1
Notice that –as in the previous case– the mode of this distribution coincides with the solution of the relevant problem (31). The distribution concentrates on its mode as β → ∞. The sum-product algorithm is Y t+1 t νi→a (si ) ∼ νb→i (si ), (33) = exp(−βλ|si |) b6=a t νˆa→i (si ) ∼ =
Z exp
n
−
oY β t (ya − (As)a )2 dνj→a (sj ) . 2 j6=i
11
(34)
4.2
Large system limit
The normal approximation Lemma is similar in form to the one given before, with two important differences: (i) The variance of the resulting messages is larger (because the constraint ya = (As)a is only enforced t softly); (ii) We can aprproximate the density of νˆa→i with a gaussian density (not just the corresponding distribution function) which is in fact stronger than the previous result. t t Lemma 4.1. Let xtj→a and (τj→a /β) be, respectively, the mean and variance of the distribution νj→a , for R 3 t the sum-product algorithm (33), (34). Assume further |sj | dνj→a (sj ) ≤ Ct uniformly in N, n. Then there exists a constant Ct0 such that t sup |ˆ νa→i (si ) − φˆta→i (si )| ≤
si ∈R
Ct0
, t N (ˆ τa→i )3/2 s � � βA2ai β t 2 φˆta→i (si ) ≡ , exp − (A s − z ) ai i a→i t t 2π(1 + τˆa→i 2(1 + τˆa→i ) )
where the distribution parameters are given by X t za→i ≡ ya − Aaj xtj→a ,
t τˆa→i ≡
j6=i
X
t A2aj τj→a .
(35)
(36)
j6=i
Proof. We have X β t νˆa→i (si ) ∼ Aaj sj )2 ) = E exp (− (ya − Aai si − 2 j6=i � � β ∼ = E exp − (Aai si − Z)2 2 ∼ = Ehsi (Z) , t t Here expectation is over s1 , s2 , P . . . , si−1 , si+1 , . . . , sN independent and distributed according to ν1→a , . . . νN →a . 2 Further, we defined Z = ya − j6=i Aaj sj and hsi (z) ≡ exp(−(β/2)(Aai si − z) ). It is not hard to compute the mean and the variance of Z X t E(Z) = ya − Aaj xtj→a = za→i , j6=i
Var(Z) =
1 t 1X 2 t Aaj τj→a = τˆa→i . β β j6=i
Let W be a normal random variable with the same mean and variance as Z. By a different form of Berry-Esseen central limit theorem mentioned in appendix A, Ct000 Ct00 ≤ , t t N 1/2 (ˆ τa→i )3/2 N 1/2 (ˆ τa→i )3/2 √ where ||h0 ||∞ = supt |h0 (t)| is the infinity norm of h0 (which is bounded by β). We therefore get Ehsi (Z) Ehsi (W ) t sup νˆa→i (si ) − Ehsi (W ) ≤ | R −R | Eh (Z)ds Eh si i si (W )dsi si ∈R R R Ehsi (W )dsi − Ehsi (Z)dsi Ehsi (Z) − Ehsi (W ) R R ≤ | |+| R Ehsi (Z)| Ehsi (Z)dsi Ehsi (W )dsi Ehsi (Z)dsi Ct0 ≤ . t N (ˆ τa→i )3/2 Ehs (Z) − Ehs (W ) ≤ ||h0 ||∞ i i
12
The last inequality is due to the following facts, √ Z Z 2π Ehsi (Z)dsi = E hsi (Z)dsi = q , A2ai β √ Z 2π . Ehsi (W )dsi = q A2ai β The proof is completed by computing Ehsi (W ). Such computation amounts to a straightforward gaussian integral, yielding Ehsi (W ) ∼ = φˆta→i (si ). The update rule for variable-to-factor node messages, cf. Eq. (33), is identical to the one used in the case of hard constraints, cf. Eq. (12), apart from the factor λ in the exponent. Keeping track of this term we obtain the following result. Lemma 4.2. Suppose that at iteration t, the messages from factor nodes to the variable nodes are set to t t t νˆa→i = φˆta→i , with φˆta→i defined as in Eq. (58). with parameters za→i and τˆa→i = τˆt . Then at the next iteration we have X t+1 t+1 2 t , λ2 (1 + τˆt )) . (37) νi→a (si ) = φt+1 (s ) {1 + O(s /n)} , φ (s ) ≡ λ f (λs ; λ Abi zb→i i i i β i i→a i→a b6=a
In particular, the mean and variances of these messages are given by � � X X 1 β 2 t t 2 t t t xt+1 = ; λ (1 + τ ˆ )), τ = ; λ (1 + τ ˆ ) , F (λ A z G λ A z β bi b→i β bi b→i i→a i→a λ λ2 b6=a
b6=a
where, fβ , Fβ , andGβ are defined in Eqs. 17 and 18. The proof is very similar to the proof of Lemma 3.2 and for the sake of brevity we do not mention it here. As a summary, we get the following simple iterative algorithm which at each iteration equivalent to the corresponding iteration of the message passing algorithm. � X 1 � X t 2 t t xt+1 = ; λ (1 + τ ˆ ) , z ≡ y − Aaj xtj→a , (38) F λ A z a bi β a→i b→i i→a λ j6=i
b6=a
τˆt+1 =
β λ2 n
N X
� X � t Gβ λ Abi zb→i ; λ2 (1 + τˆt ) .
i=1
(39)
b
As before the next step is to derive the algorithm in the limit β → ∞ which is the most interesting regime and is equivalent to basis pursuit denoising problem.
4.3
Large β limit
Applying Lemma 3.3 to Eqs. (38), (39) they reduce –in the large β limit– to �X � X t t t xt+1 = η A z ; λ(1 + τ ˆ ) , za→i ≡ ya − Aaj xtj→a , bi b→i i→a b6=a
j6=i
τˆt+1 =
N τˆt X
1+ Nδ
i=1
13
η0
�X b
� t Abi zb→i ; λ(1 + τˆt ) ,
where we used the invariance property η(a x; a b) = aη(x; b) valid for any a > 0. If we call λˆ τ t = γ t the new form of the AMP algorithm is, �X � X t t t xt+1 = η A z ; λ + γ , za→i ≡ ya − Aaj xtj→a , (40) bi b→i i→a b6=a
j6=i
γ t+1 =
N γt X
λ+ Nδ
i=1
η0
�X
� t Abi zb→i ; λ + γt ,
(41)
b
These expression should be compared with Eqs. (40), (41) for the basis pursuit algorithm. The only difference is just in the threshold value.
4.4
From message passing to AMP
Again, this algorithm can be considerably simplified using the Lemma 3.4. In matrix notation we obtain the following equations xt = η(xt + A∗ z t ; λ + γ t ), 1 z t+1 = y − Axt + z t hη 0 (xt−1 + A∗ z t−1 ), i δ which generalize Eqs. (29) and (29). The threshold level is computed iteratively as follows γ t+1 =
4.5
λ + γt 0 hη (Az t + xt ; γ t + λ)i . δ
(42) (43)
(44)
Comments
Threshold level. The derivation presented above provides a ‘parameter free’ algorithm. The threshold level τˆt or γ t is fixed by the recursions (30), (41). In the basis pursuit problem, one could take the alternative point of view that τˆt is a parameter that can be optimized over. This point of view was adopted in [24]. For the case of Lasso it is again possible to consider the threshold as a free parameter and then tune it such that the fixed point of iteration satisfies the KKT conditions. This approach has been adopted in [12]. The analysis and comparison of these thresholding policies are presented in section 5. We call the AMP algorithm with the thresholding policy introduced in (30) and (41) AMP.0 and AMP.A respectively. When we tune the algorithm to get the best phase transition the algorithm is called AMP.M where M stands for minimaxity. Finally, when the free parameter is tuned to satisfy the KKT conditions the algorithm is called AMP.T. Mathematical derivation of the AMP. We showed that in a specific limit (large systems, and large β) the sum-product update rules can be considerably simplified to get the update rules (29), (42). Let us emphasize that our proofs concern just a single step of the iterative procedure. Therefore they do not prove that the (averages and variances) of the sum-product message are precisely tracked by Eqs. (29), (42). It could be that the error terms in our approximation, while negligible at each step, conjure up to become large after a finite number of iterations. We do not expect this to happen, but it is nevertheless an open mathematical problem.
5
State evolution
Recently the authors introduced the state evolution framework for analyzing the performance of the AMP algorithm [13]. This approach has been also rigorously proved recently [1]. Consider the following iterative algorithm 14
xt+1 = ηt (xt + A∗ z t ), 1 0 z t = y − Axt + hηt−1 (A∗ z t−1 + xt−1 )i. δ
(45)
where ηt (.) is a function that may also depend on the iteration. We recall the following result from [1]. Let {A(N )} be a sequence of sensing matrices A ∈ Rn×N indexed by N , with iid entries Aij ∼ N (0, 1/n), and assume n/N → δ. Consider further a sequence of signals {x0 (N )}N ≥0 , whose empirical distributions converge to a probability measure pX0 on R with bounded (2k − 2)th moment, and assume Epˆ(X02k−2 ) → EpX0 (X02k−2 ) as N → ∞ for some k ≥ 2. Theorem 5.1. For any pseudo-Lipschitz function ψ : R2 → R we have, N 1 X ψ(xt+1 i , x0,i ) = E[ψ(ηt (X0 + τt Z), X0 )], N →∞ N
lim
i=1
with X0 ∼ pX0 and Z ∼ N (0, 1) independent. According to the above theorem we can consider the parameter τt as the state of the algorithm and track the behavior of this state variable across iterations. This is called state evolution [13]. If we consider the measurements to be of the form y = Ax + w with w ∼ N (0, σ 2 In ), the state evolution equation is given by, 1 2 (46) τt+1 = σ 2 + E[ηt (X0 + τt Z) − X0 ]2 , δ where again X0 ∼ pX0 and Z ∼ N (0, 1) independent. Although the state evolution equation has been proved for the case of Gaussian measurement matrix, its validity has been carefully verified through extensive simulations for other random matrices [13]. According to the state evolution we can predict the performance of the algorithms derived in this paper theoretically. For the AMP.A algorithm the state evolution can be written as, 1 2 τt+1 = σ 2 + E[η(X0 + τt Z; λ + γ t ) − X0 ]2 , δ t+λ γ γ t+1 = E[η 0 (X0 + τt Z; λ + γ t )]. δ
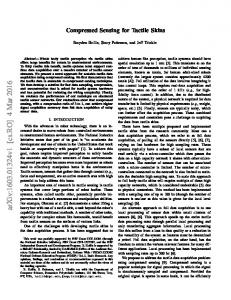
(47)
Figure (1) shows the match between the predictions of the state evolution and the Monte Carlo simulation results.
5.1
Exactly Sparse Solution
Suppose there is no measurement noise in the system, i.e. y = Aso . Also the the elements of so are drawn from (1 − �)δ0 (soi ) + �G(soi ) where G is a density function on R+ 2 without a point mass at 0 and define ρ = �/δ. We are interested in the solution of the basis pursuit problem and therefore we consider the AMP.0 algorithm. It is easy to see that the state evolution equation for this case is given by, 1 2 τt+1 = E[η(X0 + τt Z; γ t ) − X0 ]2 , δ t γ γ t+1 = E[η 0 (X0 + τt Z; γ t )]. δ 2
This is just for the simplicity of exposition. The results can be easily extended to other cases.
15
(48)
Figure 1: Comparison of state evolution predictions against observations. Top row: N = 4000, δ = .2 and ρ = 0.05. Bottom row: N = 4000, δ = .3 and ρ = 0.17. Each red point is the average of 50 Monte Carlo samples and the bars show the 95 percent confidence interval.
16
Lemma 5.2. Consider the state evolution equation 48. Suppose that the sparsity level � is small enough such that the algorithm converges to the correct answer, i.e. (τt , γt ) → (0, 0). Then τt = c, t→∞ γt lim
(49)
where c is a finite non-zero constant. Proof. The proof is by contradiction. The goal is to rule out the two cases c = 0 and c = ∞. Although the proof is a simple application of dominated convergence theorem, but for the sake of clarity we mention the proof here. case I: c = ∞. We know that, γ t+1 1 1−� 0 t � = Eη 0 (X + τ t Z; γ t ) = Eη (τ Z; γ t ) + EX∼G η 0 (X + τ t Z; γ t ) = γt δ δ δ 1−� 0 � Eη (Z; γ t /τ t ) + EX∼G η 0 (X + τ t Z; γ t ). δ δ By taking the limit and using the dominated convergence theorem we get, γ t+1 1−� � 1 = + = > 1, t→∞ γ t δ δ δ lim
and this means that γ t is not going to zero which is a contradiction. Case II: c = 0. 2 τt+1 1 = E[η(X0 /γt + Zτt /γt ; 1) − X0 /γt ]2 = 2 δ γt � 1−� E[η(Zτt /γt ; 1)]2 + EX∼G [η(X0 /γt + Zτt /γt ; 1) − X0 /γt ]2 . δ δ
(50)
Clearly we can use the dominated convergence theorem again to get the limit and therefore, 2 τt+1 � = > 0, 2 t→∞ γt δ
lim
(51)
which is again a contradiction and the proof is complete. Inspired with the above lemma we can introduce a simpler AMP algorithm. xt+1 = η(xt + A∗ z t ; θσ t ), 1 z t = y − Axt + z t−1 hη 0 (xt−1 + A∗ z t−1 ; θσ t−1 )i, δ
(52)
where σ t is the standard deviation of the MAI noise at iteration t and θ is a constant number. This is the algorithm that was proposed by the authors in [13]. Here θ is a parameter that has to be tuned before applying the algorithm. The state evolution for this algorithm is simpler since there is just one state variable. 1 2 τt+1 7→ Ψ(τt2 ) = E[η(X0 + τt Z; θτt ) − X0 ]2 . δ
(53)
The performance of these two algorithms is very similar as τt → 0. This is formally stated in the following lemma. 17
Figure 2: The maxmin optimal values of θ as proposed in [13].
Lemma 5.3. Suppose that limτ →0
γ τ
→ c we then have,
E[η(X0 + τ Z; γ) − X0 ]2 /τ 2 = 1. τ →0 E[η(X0 + τ Z; cτ ) − X0 ]2 /τ 2 lim
The proof of this lemma is very simple and is omitted. The following result taken from [13] helps us analyze the performance of the new thresholding policy. Lemma 5.4. The Ψ function is concave and its derivative at τt = 0 is independent of G which is the distribution of the non-zero coefficients . dΨ Let ρ = �/δ and define ρ∗LS (δ) ≡ supθ sup{ρ : dτ 2 |0 < 1}. The optimal value of θ is represented by θM M which stands for the maximin. The value of θM M as a function of δ is shown in figure 2. For more information about θM M refer to the appendix. Using the above two lemmas it is easy to prove the following theorem.
Theorem 5.5. If ρ > ρ∗LS (δ), AMP.0 does not converge to the correct answer, i.e. (τt , γt ) 9 (0, 0). On the other hand for ρ < ρ∗LS (δ) the AMP.M algorithm converges to the correct answer. According to the above theorem from the sparsity measurement point of view AMP.M is at least as good as AMP.0. The only advantage of AMP.0 is that it does not need any tuning. We will show in the next section that for most of the values of δ the phase transitions of AMP.0 and AMP.A happen at the same place. But for small values of δ, the recursion of AMP.A suffer from oscillatory phenomena. 5.1.1
Comparison of AMP.A and AMP.M
In the previous section we showed that the phase transition of AMP.0 algorithm can not surpass the phase transition of AMP.M. However the main question is if the state evolution of AMP.0 always converges to the correct answer for ρ < ρ∗LS . In other words what is the actual phase transition region of the AMP.A 18
algorithm? In order to answer this question precisely, we again use the state evolution equation. We consider 200 equisapced points on the [0, 1] for the values of δ. For each value of δ we also consider 200 equi-spaced values of ρ. For each pair (δ, ρ) we run the state evolution for 500 iterations and measure t o k2 the `2 norm of the estimate after a) 50, (b) 100 (c) 200 and (d) 500 iterations. If kˆxks−s < .001, we o k2 declare success. With this method we calculate the phase transition of the AMP.A algorithm. In this simulation we have chosen the input ensemble from a constant amplitude ensemble which is known to be the least favorable distribution for approximate message passing algorithms [24]. Figure 3 compares the phase transition of the AMP.0 algorithm derived by this method with the phase transition of AMP.M or basis pursuit algorithm. As it is seen in this figure above δ > 0.2 the phase transitions are indistinguishable. However below δ = 0.2 the extra state variable γ causes some instability in the recursive equations that does not exist in AMP.M.
6
Extensions
So far, we have considered the general compressed sensing problem. However in some applications more information is known about the original signal. In this section we consider two of these scenarios and derive the corresponding approximate message passing algorithms.
6.1
Positivity Constraint
Suppose that the signal is known to lie in the positive orthant, i.e. so,i ≥ 0 ∀i. It has been proved that this extra information may be used properly to improve the phase transition region of the `1 minimization [15]. This information can be easily incorporated into the message passing algorithm. In this section we just consider the BPDN problem with the above constraint. The BP problem is a very simple modification of this approach and is therefore skipped in the paper. 6.1.1
Large system limit
Define a joint probability density on the variables s = (s1 , . . . , sN ) µ(ds) =
N n o n β Y 1 Y exp(−βλsi )I{si >0} exp − (ya − (As)a )2 ds . Z 2
(54)
a=1
i=1
As before the messages in the sum-product message passing algorithm are Y t+1 t νi→a (si ) ∼ νb→i (si ), = exp(−βλsi )I{si > 0}
(55)
b6=a t νˆa→i (si )
∼ =
Z exp
n
−
oY β t (ya − (As)a )2 dνj→a (sj ) . 2
(56)
j6=i
Clearly the messages from the functional nodes to the variable nodes have exactly the same form and therefore the following lemma is the immediate result of theorem 4.1. t t /β) be, respectively, the mean and variance of the distribution νj→a , for Lemma 6.1. Let xtj→a and (τj→a R 3 t the sum-product algorithm (33), (34). Assume further |sj | dνj→a (sj ) ≤ Ct uniformly in N, n. Then
19
Figure 3: Theoretical phase transition of AMP.A after (a)50 (b) 100 (c) 200 and (d) 500 iterations. Dotted line is the phase transition curve of the basis pursuit problem derived in [14] and AMP.M [13].
20
there exists a constant Ct0 such that Ct0 , t N (ˆ τa→i )3 s � � βA2ai β t t 2 ˆ φa→i (si ) ≡ , exp − (Aai si − za→i ) t t 2π(1 + τˆa→i ) 2(1 + τˆa→i )
t sup |ˆ νa→i (si ) − φˆta→i (si )| ≤
si ∈R
where the distribution parameters are given by X t za→i ≡ ya − Aaj xtj→a ,
t τˆa→i ≡
X
(57) (58)
t A2aj τj→a .
(59)
1 β exp{−βs − (s − x)2 }, zβ (x, b) 2b
(60)
j6=i
j6=i
Define fβ+ (s; x, b) ≡ and G+ β (x; b) ≡ Varfβ (·;x,b) (Z).
Fβ+ (x; b) ≡ Efβ (·;x,b) (Z),
(61)
It is easy to prove that, Lemma 6.2. Suppose that at iteration t, the messages from factor nodes to the variable nodes are set to t t t νˆa→i = φˆta→i , with φˆta→i defined as in Eq. (58). with parameters za→i and τˆa→i = τˆt . Then at the next iteration we have X t+1 t+1 + t 2 , λ2 (1 + τˆt )) . (62) (λs ; λ Abi zb→i νi→a (si ) = φt+1 (s ) {1 + O(s /n)} , φ (s ) ≡ λ f i i i i i→a i→a β b6=a
In particular, the mean and variances of these messages are given by xt+1 i→a =
1 + X t ; λ2 (1 + τˆt )), Abi zb→i F (λ λ β
t τi→a =
b6=a
� β +� X 2 t t ; λ (1 + τ ˆ ) , λ A z G bi b→i λ2 β b6=a
where, fβ+ , Fβ+ and G+ β are defined in Eqs. 60 and 61. 6.1.2
Large β limit
Consider the following new form of the soft thresholding function. � x − b if b < x, η + (x; b) = 0 if −b ≤ x ≤ b.
(63)
b in this equation is assumed to be larger than 0. As before when β → ∞, Fβ+ (x; β) and G+ β (x; β) can be simplified even more. Lemma 6.3. For bounded x,b, we have lim Fβ+ (x; β) = η + (x; b),
β→∞
0+ lim βG+ β (x; β) = bη (x; b).
β→∞
21
we are therefore led to the following message passing algorithm, + xt+1 i→a = η
�X
� t Abi zb→i ; τˆt ,
t za→i ≡ ya −
X
Aaj xtj→a ,
(64)
N � τˆt X 0+ � X t η Abi zb→i ; τˆt . = Nδ
(65)
b6=a
j6=i t+1
τˆ
i=1
b
Finally by similar arguments we can reach to the following approximate message passing algorithm. xt+1 = η + (A∗ z t + xt ; τˆt ), 1 z t = y − Axt + hη 0 (A∗ z t−1 + xt−1 ; τˆt−1 )i, δ t τ ˆ τˆt = hη 0 (A∗ z t−1 + xt−1 ; τˆt−1 )i. δ
6.2
AMP for reconstruction with prior information
In many compressed sensing applications it is not realistic to assume that the signal s is random with a known distribution. Nevertheless, it might be possible in specific scenarios to estimate the input distribution. Further, the case of known signal distribution provides a benchmark for other approaches. 6.2.1
Construction of the graphical model
Let ρ = ρ1 × ρ2 · · · × ρN be a joint probability distribution on the variables s1 , s2 , . . . , sN . It is then natural to consider the joint distribution µ(ds) =
n N oY n β 1 Y exp − (ya − (As)a )2 ρi (dsi ) , Z 2 a=1
(66)
i=1
since µ is the a posteriori distribution of s, when y = As + z is observed, with z a noise vector with i.i.d. normal entries and independent of s. The sum-product update rules are Y t+1 t νi→a (dsi ) ∼ νˆb→i (si ) ρi (dsi ) , = b6=a t νa→i (si ) ∼ =
Z exp
n
−
oY β t (ya − (As)a )2 νj→a (dsj ) . 2 j6=i
t+1 Notice that the above update rules are well defined. At each iteration t, the message νi→a (dsi ) is a t probability measure on R, and Eq. (67) gives its density with respect to ρi . The message νa→i (si ) is instead a non-negative measurable function (equivalently, a density) given by Eq. (68). It is easy to see that the case studied in the previous section corresponds to choosing the ρi ’s to be identical exponential distributions.
6.2.2
Large system limit
In view the parallel between the update equations Eq. (67), (68) and (33), (34) it is easy to realize that Lemma 4.1 applies verbatimly to the algorithm described above. 22
In order to formulate the analogous of Lemma 6.2, we introduce the following family of measures over R: fi (ds; x, b) ≡
n β o 1 exp − (s − x)2 ρi (ds) , zβ (x, b) 2b
(67)
indexed by i ∈ [N ], x ∈ R, b ∈ R+ (we think β as fixed). We use this notation for its mean and variance (here Z ∼ fi ( · ; x, b)) Fi (x; b) ≡ Efi ( · ;x,b) (Z) ,
Gi (x; b) ≡ Varfi ( · ;x,b) (Z) .
(68)
These functions have a natural estimation theoretic interpretation. Let Xi be a random variable with distribution ρi , and assume that Yei = Xi + Wi is observed with Wi gaussian noise with variance b/β. The above functions are –respectively– the conditional expectation and conditional variance of Xi , given that Yei = x: Fi (x; b) = E(Xi |Yei = x) ,
Gi (x; b) = Var(Xi |Ye = x) .
(69)
With these definitions, it is immediate to prove the following analogous of Lemma 6.2. Lemma 6.4. Suppose that at iteration t, the messages from factor nodes to the variable nodes are set to t t t νˆa→i = φˆta→i , with φˆta→i defined as in Eq. (58). with parameters za→i and τˆa→i = τˆt . Then at the next iteration we have X t+1 t+1 2 t , (1 + τˆt )) . (70) νi→a (si ) = φt+1 (s ) {1 + O(s /n)} , φ (s ) ≡ f (s ; Abi zb→i i i i i i i→a i→a b6=a
In particular, the mean and variances of these messages are given by � �X X t t t xt+1 Abi zb→i ; (1 + τˆt )), τi→a = βGi Abi zb→i ; (1 + τˆt ) . i→a = Fi ( b6=a
b6=a
t+1 If we let τˆi→a = τˆt+1 for all edges (i, a) we get the message passing algorithm � �X X t t t ; (1 + τ ˆ ) , z ≡ y − Aaj xtj→a , xt+1 = F A z a i bi a→i b→i i→a
(71)
j6=i
b6=a
τˆt+1 =
N � βX � X t Gi λ Abi zb→i ; (1 + τˆt ) . n i=1
(72)
b
Remarkably, knowledge of the prior distribution is asymptotically equivalent to knowledge of the functions Fi and Gi . 6.2.3
From message passing to AMP
By applying Lemma 3.4 we obtain the following algorithm (in matrix notation) xt = F(xt + A∗ z t ; λ + γ t ), 1 z t+1 = y − Axt + z t hF0 (xt−1 + A∗ z t−1 )i . δ
(73) (74)
Here, if x ∈ RN , F(x; b) ∈ RN is the vector F(x; b) = (F1 (xi ; b), F2 (x2 ; b), . . . , FN (xN ; b)). Analogously F0 (x) = (F01 (xi ; b), F02 (x2 ; b), . . . , F0N (xN ; b)) (derivative being taken with respect to the first argument). Finally, the threshold level is computed iteratively as follows 1 γ t+1 = hG(Az t + xt ; γ t + λ)i . δ 23
(75)
7
Comments and discussion
We presented a step-by-step approach for constructing message passing algorithms. This approach has several advantages: 1. The approach provided here is very general and can be applied to many other settings. The AMP algorithms in general may be slightly more complicated than the AMP.A and AMP.0 was demonstrated in section 6, but they are much simpler than the actual message passing algorithms on the complete graph. 2. The final approximate message passing algorithm does not have any free parameter. This may come at the cost of more complicated algorithm. The complications may show themselves specially in the analysis as was demonstrated in 5. 3. The state evolution framework provides a very simple approach to predict the asymptotic performance of the resulting algorithms. There are a few open questions that are yet to be answered. 1. The state evolution has been proved to accurately predict the performance of AMP algorithm when the measurement matrix is i.i.d Gaussian. However simulation results show the correctness of state evolution on a wider range of matrix ensembles. 2. Our main concern in the derivation has been the single step performance of the message passing algorithm and not the whole algorithm. Therefore it is conceivable that the errors accumulate and the algorithm does not perform as well as the actual message passing. The simulation results again confirm that this phenomena does not happen but this has not been addressed theoretically.
A
Berry-Esseen Central Limit Theorem
In this section we present a proof of the Berry-Esseen central limit theorem which is used in section 4. This proof is mainly due to Charles Stein [35]. Although more widely known approaches such as Lindeberg swapping trick [3] can also be used for proving similar results, we use Stein’s method that gives stronger bound. Theorem A.1. Let s1 , s2 , . . . , sn be independent zero mean random variables. Suppose E(s2i ) = 1 and E(|si |3 ) ≤ C where C is independent of i. For any differentiable bounded function φ(x) with bounded first derivative we have, E(φ(
s1 + s2 + . . . + sn C √ )) = E(φ(G)) + O( √ (1 + sup |φ0 (x)|)), n n
where G ∼ N (0, 1). Proof. Let Zn = transform as,
s1 +s2√ +...+sn . n
Following Stein’s method, for a given function φ(x) we define its Stein Tφ (x) = e
x2 2
Z
x
e−
y2 2
(φ(y) − Eφ(G))dy.
−∞
This function is bounded and has bounded derivative and second order derivative and supx |Tφ00 (x)| ≤ supx |φ0 (x)|. It is also not difficult to see that that E(Tφ0 (Zn ) − Zn Tφ (Zn )) = E(φ(Zn ) − φ(G)). Define Ti = Zn − √sin . 24
δ θM M
0.001 3.312
0.05 2.02
0.10 1.73
0.15 1.55
0.20 1.41
0.25 1.29
0.30 1.19
0.35 1.10
0.40 1.02
0.45 0.95
0.50 0.88
0.55 0.81
0.60 0.74
Table 1: Maxmin optimal value of θM M for several values of δ.
EZn Tφ (Zn ) =
X i
1 X s2 si 1 si si Tφ (Zn ) = E √ si Tφ (Ti ) + √i Tφ0 (Ti + t √ ) = Es2i Tφ0 (Ti + t √ ). n n n n n i
We now try to bound E(f 0 (Zn ) − Zn f (Zn )). E (Tφ0 (Zn ) − Zn Tφ (Zn )) = ETφ0 (Zn ) +
si 1X 0 si Tφ (Ti + √ ) − s2i Tφ0 (Ti + t √ ) n n n i
1X 0 = E Tφ (Ti + n i 1X 0 = E Tφ (Ti + n i
≤ ≤
B
s s √i ) − Tφ0 (Ti ) + f 0 (Ti ) − s2i Tφ0 (Ti + t √i ) n n s s √i ) − Tφ0 (Ti ) + s2i Tφ0 (Ti ) − s2i Tφ0 (Ti + t √i ) n n
1 √ E(|si | sup |Tφ00 (x)|) + E(|si |3 ) sup |Tφ00 (x)|) n x x 4 √ sup |φ0 (x)|. n
Table for θM M (δ)
In section 5 we considered the following algorithm, xt+1 = η(xt + A∗ z t ; θσ t ), 1 z t = y − Axt + z t−1 hη 0 (xt−1 + A∗ z t−1 ; θσ t−1 )i, δ
(76)
and mentioned that θ is a free parameter. In [13] the optimal value of θ that achieves the maximum phase transition was proved to be equal to
θM M (δ) = arg max
1 − 2/δ[(1 + z 2 )Φ(−z) − zφ(z)] . 1 + z 2 − 2[(1 + z 2 )Φ(−z) − zφ(z)]
Table 1 shows the optimal value of θ for several values of δ.
25
References [1] M. Bayati and Andrea Montanri. The dynamics of message passing on dense graphs, with applications to compressed sensing. IEEE Transactions on Information theory, 2010. submitted. [2] A. Beck and M. Teboulle. A fast iterative shrinkage thresholding algorithm for linear inverse problems. SIAM journal on imaging sciences, 2(1):183–202, 2009. [3] P. Billingsley. Probability and measure. John Willey and sons, 3 edition, 1995. [4] J. Bioucas-Dias and M. Figueiredo. A new twist: Two-step iterative shrinkage/thresholding algorithms for image restoration. IEEE transactions on image processing, 16:2992–3004, 2007. [5] T. Blumensath and M. E. Davies. Iterative thresholding for sparse approximations. Journal of Fourier Analysis and Applications, special issue on sparsity, 14(5):629–654, 2008. [6] T. Blumensath and M. E. Davies. How to use the iterative hard thresholding algorithm. Proc. SPARS, 2009. [7] S.S. Chen, D.L. Donoho, and M.A. Saunders. Atomic decomposition by basis pursuit. SIAM Journal on Scientific Computing, 20:33–61, 1998. [8] P. L. Combettes and V. R. Wajs. Signal recovery by proximal forward-backward splitting. Multiscale Modeling and Simulation, 4(4):1168–1200, 2005. [9] D. Guo D. Baron and S. Shamai. A single-letter characterization of optimal noisy compressed sensing. Proc. of the 47th Annual Allerton Conference, 2009. [10] I. Daubechies, M. Defrise, and C. De Mol. An iterative thresholding algorithm for linear inverse problems with a sparsity constraint. Communications on Pure and Applied Mathematics, 75:1412– 1457, 2004. [11] D. L. Donoho. High-dimensional data analysis: The curses and blessings of dimensionality. Amer. Math. Soc. Lecture: “Math challenges of the 21st century”, 2000. [12] D. L. Donoho, A. Maleki, and A. Montanari. Noise sensitivity phase transition. IEEE Transactions on Information Theory, 2010. submitted. [13] D. L. Donoho, Arian Maleki, and Andrea Montanari. Message passing algorithms for compressed sensing. Proceedings of National Academy of Sciences, 106(45):18914–18919, 2009. [14] D. L. Donoho and J. Tanner. Neighborliness of randomly-projected simplices in high dimensions. Proceedings of the National Academy of Sciences, 102(27):9452–9457, 2005. [15] D. L. Donoho and J. Tanner. Counting faces of randomly projected polytopes when the projection radically lowers dimension. Journal of American Mathematical Society, 22:1–53, 2009. [16] M. Elad, B. Matalon, J. Shtok, and M. Zibulevsky. A wide-angle view at iterated shrinkage algorithms. Proc. SPIE (Wavelet XII), August 2007. [17] M. Elad, B. Matalon, and M. Zibulevsky. Image denosing with shrinkage and redundant representations. Proceedings of the IEEE computer Society Conference on Computer Vision and Pattern Recognition, 2006.
26
[18] M. Figueiredo, J. Bioucas-Dias, and R. Nowak. Majorization-minimization algorithms for waveletbased image restoration. IEEE Transactions on Image Processing, 16(12):2980–2991, 2007. [19] M. Figueiredo and R. Nowak. An em algorithm for wavelet-based image restoration. IEEE Transactions on Image Processing, 12(8):906–916, 2003. [20] M. Figueiredo, R. Nowak, and S. Wright. Gradient projection for sparse reconstruction: Application to compressed sensing and other inverse problems. IEEE Journal of Selected Topics of Signal Processing, 1(4):586–598, 2007. [21] E. Hale, W. Yin, and Y. Zhang. Fixed point continuation method for `1 minimization with application to compressed sensing. Rice University Technial Report TR07-07, 2007. [22] Y. Kabashima, T. Wadayama, and T. Tanaka. A typical reconstruction limit for compressed sensing based on lp-norm minimization. Journal of Statistical Mechanics, 2009. [23] A. Maleki and D. L. Donoho. Optimally tuned iterative thresholding algorithm for compressed sensing. IEEE journal on selected areas in signal processing, April 2010. [24] A. Maleki and A. Montanari. Analysis of approximate message passing algorithm. 44th Annual Conforence on Information Sciences and Systems, 2010. [25] Arian Maleki. Approximate message passing algorithm for compressed sensing. Stanford University PhD Thesis, 2010. [26] M. M´ezard and A. Montanari. Information, physics, computation: Probabilistic approaches. ambridge University Press, 2008. [27] Yurii Nestrov. Gradient methods for minimizing composite objective function. CORE Report, 2007. [28] S. Rankan, A. K. Fletcher, and V. K. Goyal. Asymptotic analysis of map estimation via the replica method and applications to compressed sensing. submitted to IEEE Transactions on Information Theory, 2010. [29] T.J. Richardson and R. Urbanke. Modern Coding Theory. Cambridge University Press. [30] J. Bobin S. Becker and E. Cand`es. Nesta: a fast and accurate first-order method for sparse recovery. 2010. submitted for publication. [31] M. Figueiredo S. Wright, R. Nowak. Sparse reconstruction by separable approximation. IEEE Transactions on Signal Processing, 57(7):2479–2493, 2009. [32] S. Sardy, A. G. Bruce, and P. Tseng. Block coordinate relaxation methods for nonparametric wavelet denoising. Journal of Computational and Graphical Statistics, 9:361–379, 2000. [33] S. Sarvotham, D. Baron, and R. Baraniuk. Compressed sensing reconstruction via belief propagation. Preprint, 2006. [34] J. L. Starck, M. Elad, and D. L. Donoho. Redundant multiscale transforms and their application for morphological component analysis. Journal of Advances in Imaging and Electron Physics, 132:287– 348, 2004. [35] C. Stein. Approximate Computation of Expectations, volume 7. Institute of Mathematical Statistics, 1986. 27
[36] E. van den Berg and M. P. Friedlander. Probing the pareto frontier for basis pursuit solutions. SIAM Journal on Scientific Computing, 31(2):890–912, 2008. [37] W. Yin, S. Osher, D. Goldfarb, and J. Darbon. Bregman iterative algorithms for `1 -minimization with applications to compressed sensing. SIAM Journal on Imaging Sciences, 1(1):143–168, 2008.
28