How to generate macro data using survey micro data on household wealth Carlos Coimbra, 1 Luísa Farinha 2 and Rita Lameira 3
I.
Introduction
Information on the level, composition and distribution of wealth across households is an important element for both economic analysis and economic policy. The lack of information on real assets and on the distribution of wealth across households is the reason for producing a survey conducted by the central bank in association with the National Statistical Institute (NSI) designed to study the wealth of Portuguese households. The survey is known as the Inquérito ao Património e Endividamento das Famílias, or IPEF. 4 This survey is the only statistical source that makes it possible to link information on household income, expenditure, financial assets, real assets and debt. The micro data obtained from the survey have been used to study the heterogeneity of households’ behaviour in terms of the share of risky assets they have in their portfolios and the size of their debt, in relation to characteristics such as income, education level, age and region. The survey results were also useful in clarifying some puzzling issues in macroeconomic analysis, which will be discussed further on, and in making inferences as to the average size and structure of households’ wealth. The paper is organized as follows. The second section provides a brief look at the survey’s benefits and shortcomings; the third section presents an example of how the survey results were important in understanding macroeconomic developments in the Portuguese economy; the fourth section comments on macro data from the survey regarding the average size and structure of household wealth; and the final section offers some concluding remarks.
II.
IPEF benefits and shortcomings
The IPEF has been conducted by the central bank and the NSI as an additional module in an existing survey. 5 The central bank provides financial support, collaborates in designing the questionnaire and offers technical training for the NSI interviewers. The NSI monitors all of the fieldwork and produces the database combining the wealth data with information from the
1
Banco de Portugal, Statistics Dpt. and ISCTE, Economics Dpt., Av. Almirante Reis, 71, 1150-012 Lisbon, Portugal. E-mail:
[email protected].
2
Banco de Portugal, Research Dpt., Av. Almirante Reis, 71, 1150-012 Lisbon, Portugal. E-mail:
[email protected].
3
Banco de Portugal, Statistics Dpt., Av. Almirante Reis, 71, 1150-012 Lisbon, Portugal. E-mail:
[email protected].
4
The IPEF has been conducted three times to date: in 1994, 2000 (the results of this survey are the ones used in this paper) and 2006/2007 (the data from this survey were not yet available when this paper was written).
5
The IPEF was associated with the employment survey in 1994 and with the household budget survey in the other two cases.
IFC Bulletin No 28
409
associated survey. After being subjected to an anonymisation procedure, this database is then provided to the central bank. Thus, the IPEF has not been an entirely independent statistical operation. The principal reasons for conducting it as a collaborative venture were (i) the opportunity to crossreference information on wealth with information on other socio-economic characteristics provided by the other survey; (ii) the relatively large sample size (over 6,000 households in the 2000 survey, expected to increase to over 8,000 in the latest); and (iii) the fact that the survey is monitored by the NSI, thus ensuring greater credibility and integrity than if it were conducted by a private entity. However, the survey does have one important drawback: the sample is not designed with the specifics of wealth surveys in mind. The resulting problems are well documented in the literature, 6 and include the following: (i) since wealthy households are a small fraction of the population, the probability of being selected in the survey sample will be drastically disproportionate to their share of total wealth; (ii) wealthy households are less likely to respond to surveys on wealth; and (iii) wealthy households are more likely to underreport the level of owned assets (particularly financial assets). Additionally, without adequate incentives, interviewers may not expend the extra effort needed for overcome these impediments. All of this would suggest a need to “over-sample” wealthy households. However, the relatively large size of the sample and the availability of information on some benchmark variables tend to compensate for the above-mentioned problems. Moreover, the difficulties associated with the under representation of wealthy households do not seem to have the same impact for all types of assets and liabilities. In fact, some real assets, such as principal residence and related debt, appear to be less affected. 7
III.
The use of micro data in macro-economic monitoring
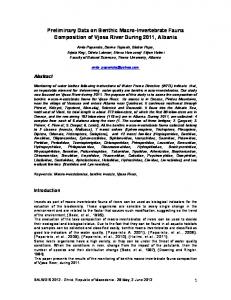
In the second half of the 1990s in Portugal, there was a sudden and notable rise in household indebtedness, to unprecedented levels (from 36 percent of disposable income in 1995 to 85 percent in 2000). This reflected falling interest rates, as well as changes in the supply side of the credit market that allowed more households to obtain credit (see Ribeiro, 2007). This is an important factor in understanding why private consumption continued growing faster than GDP after Portugal’s EMU accession. The results of the IPEF provide evidence of a significant lowering of liquidity constraints on households’ expenditures in that period. Chart 1 presents the survey data broken down according to monthly household income and the age of the household member interviewed. 8 Comparing the 1994 and 2000 results for all age and income categories considered, there was a substantial decline in the average debt burden. Micro level survey data were very useful in distinguishing the growing number of indebted households from the increase in their average debt. According to the survey data, the rise in household indebtedness at the aggregate level was not achieved at the expense of increased debt at the individual level. Rather, they indicate that households were able to smooth out consumption across the business cycle. Since 2000, aggregate indebtedness has continued to rise steadily, so that a more recent picture of household debt at the micro level is of utmost importance.
6
See, for example, Kennickell, 2005.
7
In Portugal most households own their residences and tend to have associated mortgages.
8
For details, see Farinha (2004).
410
IFC Bulletin No 28
Chart 1 Average debt burden by IPEF sub-sample – income and age 70%
Percentage
60%
2000 1994
50% 40% 30% 20% 10% 0% less than 500 €