Volume 9, Number 2, 2016
HOW TO IMPLEMENT AN E-LEARNING CURRICULUM TO STREAMLINE TEACHING DIGITAL IMAGE PROCESSING Sándor Király
Abstract: In the field of teaching, one of the interesting subjects is the research of the fact which didactic methods are good for learning the current curriculum for the students who show a wide range of age, interest, chosen courses, previous studies and motivation. This article introduces the facilities that support the learning process: the demonstration programs, the evaluation system or the didactic template. The experiment proved that the developed material for the course of digital image processing greatly improved the efficiency of learning the subject and the students’ grades. The appropriate use of LMS and the evaluation system contribute to the understanding of learning habits and allow the material to be developed further, matching to individual students’ skills. The results showed that the revision of the material based on examining the log files, the mapped learning habits and the analysing of the results of the evaluation system made the curriculum more efficient in contrast to the earlier one. Key words: E-learning, digital image processing, evaluation system, demonstration program
1. Introduction During digital image analysis, the goal is to analyse the picture, understand and correctly interpret the visual information in it and finally recognise what it depicts. To achieve this, transformations are needed to be performed, that result in an image with better properties than the original. These transformations are usually algorithms, most on strong mathematical basis. Students need to know and use the image processing methods by using the available software (GIMP – GNU Image Manipulation Program, ImageJ – software of National Institutes of Health, MATLAB – software of MathWorks) and they also need to understand the theoretical background of these algorithms. The digital image processing course is held for both daytime and correspondent students. The daytime students have 28 lessons in a semester as opposed to the correspondent students who have only 10 lessons. How can their motivations be kept up if they meet their teacher only two times in a semester? As this is an optional course it is also desirable that the rate of dropout remains at a very low level. This subject is taught by several universities but not in the form of e-learning with the use of LMS (Learning Management System). There are also some articles about the way of teaching digital image processing in form of an interactive E-learning course but without the use of LMS. [1, 2, 10, 11] In this paper, we introduce a curriculum for teaching subject of digital image processing that based on six pillars: e-learning, the didactic template, the text of the material, the images and the animations, the demonstration programs and the evaluation system. The developed material is reachable in any time and by using any device capable of internet connection, as well as customizable, interactive and it applies different media during the learning process. To measure the efficiency of this e-learning material, we carried out an experiment. Both daytime students and correspondent students were randomly distributed into two-two groups: students in the experimental one were taught by using the e-learning material, the others belonged to the control group participated in the conventional education.
Received January 2016.
14
Sándor Király
2. E-learning The curriculum was designed according to the recommendations of quality e-learning as a SCORM (Shareable Content Object Reference Model) compatible content package. [9, 15, 18] For these kinds of packages the Moodle LMS system seemed to be suitable. Naturally, others could also have been suitable, such as CORPUS or CooSpace but Moodle is an open-source and free application and this was also an argument in favour of this LMS. Moodle makes possible the discovery of unique contexts with the help of properly designed user profiles, blog entries and filled questionnaires. It supports flexible learning environment on level of the portal, courses and the individual lessons and even with the roles and associated rights being redefinable on a per course basis. Moreover, it can cooperate with a lot of applications, of which most can be incorporated into the courses. Its logging capability proved to be suitable to map the learning habits of students. [4]
3. The curriculum The developed curriculum for the digital images processing course discusses the topics based on the following sections, since these subjects are sufficient for understanding the fundamentals of digital image processing. [5, 6]: Human visual model Digitizing Linear coordinate transforms Histogram transforms Arithmetic and logical operations Image inversion Convolution-based operations: Edge detection, sharpening, smoothing Integral transforms: Fourier transform, Filters in frequency domain, Wavelet transform and its applications Mathematical morphology Segmentation Digital image formats The developed curriculum based on the following didactic template: Introduction Defining the goals, requirements Lessons: Objectives, Explanation of the topic, Practice tasks, Summary, Self-assessment questions, Test questions Supplements Bibliography Glossary, key notions Trial tests A-C Exam tests A-B The material was designed to fulfil the requirements of education formulated by Josef Kraus that is based on modern brain research. [8]
Acta Didactica Napocensia, ISSN 2065-1430
How to Implement an E-learning Curriculum to Streamline Teaching Digital Image Processing
15
• The student activities are of the highest importance, therefore the teaching must be extremely activated. • The teaching and learning process must be multi-channel. According to the observations, the accepted information remain in our memory in the following rates: 10% of the information only if we read it, 20% only if we can hear it, 30% only if we can see it, 50% if we can see and hear it as well, 70% if we can see and hear it and speak of it as well, and the 90% of the information remains of the activities that we do. These improve the importance of the usage of concrete and visual representations. • Practice makes perfect. • The learning process should include easier and restful parts. • To provoke students’ attention is necessary. • The curiosity of students is one of the highest importance in the teaching and learning process. Considering that the four theoretical pillars of the discussed image processing methods are integral transforms, convolution and mathematical morphology, a special curriculum was designed to help the relational understanding of them. (The fourth one is the histogram transforms but previously, students understood this topic very easy.) The increasing of the number of activities for these sections was also expected to enhance the understanding in the learning process. [16]
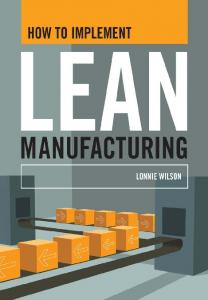
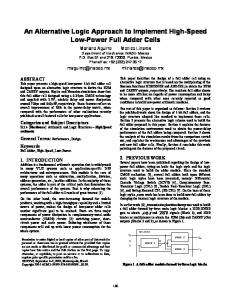
3.1. Integral transforms In digital image processing, for transforming an image in the spatial domain to the frequency domain 2D (two-dimensional) discrete Fourier-transform is applied. Because of didactic reason, the curriculum demonstrates the 1D (one-dimensional) continuous and discrete Fourier transform instead of the 2D version firt, since understanding the 1D version is much easier, over and above profiting that the Fourier transform is separable, the 2D version can be obtained from performing the 1D version two times. The understanding of 1D Fourier-transform was aided by the following tools: • An Excel spreadsheet in which students can define and represent signals and the spectrum of these signals. • An external flash program that can find cosine functions similar to a given signal by changing the frequency of cosine functions. While students are changing the frequency, the program can show the result of the integration. (http://www.fourier-series.com/f-transform/flashprograms/FourierTrans.html). • Exercises in the curriculum that helped students to calculate the Fourier-transform coefficients in the discrete version. • Special images represent the meaning of frequency of images, see Figure 1.
(a)
(b)
(c)
(d)
Figure 1. Our own drawn pictures (a) (c) and the result of the Fourier transform (b) (d) performed by ImageJ software
Volume 9 Number 2, 2016
16
Sándor Király
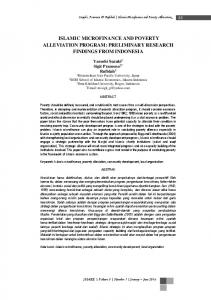
The filtering in the frequency domain and the creation of filters were demonstrated by the ImageJ program and a developed software of MATLAB for the curriculum. By using this program, students can open any JPEG files and they can manipulate them after they set the center and the radius of the frequency-domain that they want to change, and they can also set the rate of changing. This software represents that increasing the frequencies of an image causes stronger edges (and noises), decreasing them results blurred edges (and noises). Manipulating the low frequencies students can change the saturation of the images. Besides, students could define and perform low-pass and high-pass filters on their own uploaded images by using an external Java applet in the e-learning material. [7] The understanding the meaning of the WT (Wavelet Transform) and the DCT (Discrete Cosine Transform) was very easy after the Fourier-transform. To demonstrate the feature of energy saving of DCT and WT, students could use two Excel sheets that performed the transforms after giving the intensity values of an image and could calculate the new intensity values as well. [13] The spreadsheet of DCT can also represent the whole way of coding of JPG files. [17] Figure 2 shows the result of a wavelet transform using Haar wavelet.
Figure 2. Wavelet transform by using Haar wavelet (Matrix A is the image, matrix U is the DCT matrix, UA is their product, UT is the transpose of U.) – developed by the author
For images, students could perform Wavelet transform by using Wavelet Toolbox of MATLAB.
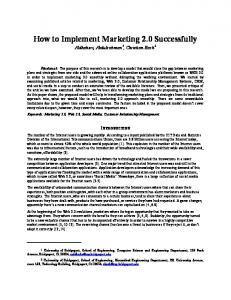
3.2. Convolution In digital image processing, the two dimensional discrete convolution is used. Similarly to the FT, the curriculum discusses the one dimensional continuous and discrete versions first, helping the understanding with an animation and some real examples in the cases of the discrete version. For real pictures, students used the GIMP software in which they could use the learnt filters, e.g. Sobel or Laplace. To understand the convolution for images step-by-step, two software were developed. (Figure 3.a) The first one can perform the convolution on the intensity values of different images using different PSFs (Point Spread Function). Students can choose a homogeneous image, an image with noise, or an image with horizontal or vertical edges. The program can show the changes of the intensity values of the selected image, step-by-step, depending on the selected PSF. The other software demonstrates the working of rank filters compared to the smoothing filter, see Figure 3.b. These
Acta Didactica Napocensia, ISSN 2065-1430
How to Implement an E-learning Curriculum to Streamline Teaching Digital Image Processing
17
demonstration programs were designed to enhance the understanding of convolution with different PSFs and implemented for both Windows and Android operating systems.
. (a)
(b) Figure 3. Demonstrating the working of convolution (a), and the working of rank filters (b) by the developed computer software
3.3. Mathematical morphology For teaching the mathematical morphology, the curriculum applies not only picturesque images but an own developed software. By means of this software, students can generate optional images and after setting the size of the structuring element, they can perform the selected morphology operation. Images can be saved and reused. The software can also show the steps of the selected operations: which background pixels become object pixels and reverse, which object pixels become background pixels.
Volume 9 Number 2, 2016
18
Sándor Király
3.4. The text of the curriculum To catch students’ attention and to keep up their curiosity, the curriculum was full of metaphors, humorous phrases and questions. The fine structure of the text of the developed material ensures the raising of awareness and the problematization of the learning content while the hierarchical setup supports the activation of previous knowledge and experiences, the connection of the newly learned knowledge to the older one. The interactive programs used for the material, self-developed applications and animations ensure interactivity and involve the students into learning, while granting them the required motivation that is further increased by the practicing tasks that can be performed on carefully chosen images.
4. The evaluation system The e-learning curriculum can reach its goal, effectively supporting the self-sufficient studying, if the evaluation system is developed properly. So the evaluation system provided the continuous feedback and it was elaborated so that its use ensures the instrumental and relational understanding of the material and also the successful exam. [3, 12, 14] After each lesson, there are practical tasks, control questions and test questions as well. Control questions were made based on the text of the lesson. It measures whether students memorised the text, the definitions and the theorems. Test questions test if students understood the text, the definitions and the theorems. There are 212 questions separated into 7 categories (dichotomous questions, multiply questions, ordinal questions, relationships analysis questions, matching questions, numerical questions and embedded questions). After submitting the answers, students can get the result of the test and the right answers immediately. The curriculum includes both elaborated practical exercises and tasks that students have to solve with the available programs (GIMP, ImageJ, and MATLAB). These tasks measure if they could understand which operations can be applied in different cases for the given images. Besides, students can measure their knowledge by completing the three trial tests after the course.
5. Participants Students who enrolled in the regular course had 2 lessons in a week in the semester. These students were divided in two groups randomly. The experiment group used the developed e-learning material, the control group used only the previous presentation slides. Students who enrolled in the correspondent course had 2x5 lessons in the semester. Theses students were also divided in the experiment group and the control group.
6. Results After the course, the students in the both the control and the experimental groups took the same test included both theoretical and practical exercises.
6.1. The results of the groups of the regular course Table 1 represents the achieved results for both groups.
Acta Didactica Napocensia, ISSN 2065-1430
How to Implement an E-learning Curriculum to Streamline Teaching Digital Image Processing
19
Table 1. The results of the experiment in the case of the groups in the regular course Theoretical part
Practical part
Average (%)
Average (%)
Experimental group
Control group
Experimental group
Control group
80,59
69
68,24
53,16
According to the two sample t-test, it has 99.485% chance of that the developed e-learning material caused the difference of achievements in the case of the theory test and that it has 97% chance of that the developed material caused the difference of achievements in the case of the practical test. The customizability of the material, the expressive figures, the demonstration software and the wide range of interactive options caused that the students’ achievements improved with more than 11 percentage points.
6.2 The results of the groups of the correspondence course The improvement was higher than in the case of groups of the regular course, see Table 2. Table 2. The results of the experiment in the case of groups in the correspondence course Theoretical part
Practical part
Average (%)
Average (%)
Experimental group
Control group
Experimental group
Control group
86,10
68,78
57,37
37,33
As the samples come from a population with normal distribution and after performing the F-test, it was determined that the variances of the test samples were not different substantially. According to the two sample t-test, it has 99.87% chance of that the developed material caused the difference of achievements in the case of theory test, and that it has 98.70% chance of that the developed material caused the difference of achievements in the case of the practical test. Unfortunately, the number of students for the course was not large, therefore we are aware that the results must be treated with caution.
6.3 The results of examining the habits of learning Examining the logs of Moodle, the students’ achievements in the semester with their achievements on the final tests were compared. The average results of the control questions at the end of the lectures were compared to the results of the final test. It turned out that there were only two students who achieved more than 80% in the control tests and fewer than 80% in the final test. The correlation coefficient was 0.5530 which means that there was near and positive relation between the achievements in the semester and in the final test. Consequently, the students who studied from this material could be sure that the evaluation system showed them very precisely, how deep they learned the topics. The good results achieved in the control tests predestined the students achieving good results in the final test. We can declare that the e-learning material with good evaluation system can motive the students. The habits of learning and the students’ answers for the questions can be found in the evaluation system were examined. On the basis of it, the material was revised. Some practical exercises were put in the part of theory and the students had to to send the resulted images of some practical exercises to
Volume 9 Number 2, 2016
20
Sándor Király
the teacher guaranteeing the feedback this way. Some expressive examples and animations were put in some parts of the material to make the topics more understandable. After the revision of the material, the achievement of a group of the daytime students and a group of the correspondence students were examined in the next semester. Table 3 shows the results. Table 3. The results of examining learning habits Regular course
Correspondence course
Average (%)
Average (%)
Theoretical part
Practical part
Theoretical part
Practical part
New result
Previous result
New result
Previous result
New result
Previous result
New result
Previous result
87,14
80,95
83,18
68,24
89,55
86,10
77,00
57,37
There was only one student who didn’t take the final test, therefore the dropout rate remained at a very low level.
7. Conclusion To conclude, these results contribute the evidence that e-learning can be an effective educational strategy in the field of teaching Digital Image Processing. The developed material can be understandable for students without deeper knowledge of mathematics. The results also showed that the material with revision based on the examination of the log files, the mapped learning habits, and the analysis of the results of the evaluation system, became more efficient in contrast to the earlier one. Since students can complete this course at their own pace the number of students dropping out can be reduced. The experiment proved that the developed material greatly improved the students’ grades and the efficiency of learning this subject. The use of LMS and the evaluation system contributed to the understanding of learning habits and allowed the material to be developed further, matching to individual students’ skills. Furthermore, the experiment proved that the use of e-learning with properly developed, motivating material with the developed computer software and Excel sheets can popularize an optional subject with the students, increasing their inner motivation. The customizability of the electronic material in turn speeds up the learning process. Since the number of students is not large, the results must be treated cautiously.
References [1] Al-Ghaib, H. & Adhami, R. (2012), "An E-learning interactive course for teaching digital image processing at the undergraduate level in engineering," Interactive Collaborative Learning (ICL), 2012 15th International Conference on, vol., no., pp.1,5, 26-28 Sept. 2012 doi: 10.1109/ICL.2012.6402146 [2] Asir, A. G. D. & Jebamalar, L. E. (2013). Competency-Based Calisthenics of Learning Outcomes for Engineering Education. International Journal of Education and Learning, 2 (1), 25-34.
Acta Didactica Napocensia, ISSN 2065-1430
How to Implement an E-learning Curriculum to Streamline Teaching Digital Image Processing
21
[3] Attwell, G. (2006), Evaluating E-learning: A Guide to the Evaluation of E-learning, retrieved from http://www.pontydysgu.org/wp-content/uploads/2007/11/eva_europe_vol2_prefinal.pdf. [31.12.2015] [4] Dobrzański, L.A.; Honysz, R. & Brytan, Z. (2006), Application of interactive course management system in distance learning of material science, Journal of Achievements in Materials and Manufacturing Engineering, retrieved from http://www.journalamme.org/ papers_amme06/1260.pdf [31.12.2015] [5] Fazekas, G. & Hajdú, A. (2004). Image processing methods, Képfeldolgozási módszerek (in Hungarian), retrieved from http://www.inf.unideb.hu/~hajdua/km_main.pdf [31.12.2015] [6] Fazekas, A., & Kormos, J. (2004), Mathematical basis of digital image processing, A digitális képfeldolgozás matematikai alapjai (in Hungrarian), retrieved from http://www.inf.unideb.hu/~hajdua/kepfeldolgozas.pdf [31.12.2015] [7] Fisher, R., Brown, N., Cammas, N., Fitzgibbon, A., Horne, S., Koryllos, K., Murdoch, A., Robertson, J., Sharman, T., & Strachan, C. (2004), Image processing learning sources, Retrieved from http://homepages.inf.ed.ac.uk/rbf/HIPR2/fftdemo.htm [31.12.2015] [8] Gordana, S. (2008). The usage of concrete and visual representations in teaching algebra in seventh year classes, Konkrét és képi reprezentációk használata a hetedik osztályos algebratanításban (in Hungarian), PhD thesis, Debrecen University, 2008. 8.11 [9] Grifoll, J.; Huertas, E; Prades, A.; Rodríguez, S.; Rubin, Y.; Mulder, F.; & Ossiannilsson, E. (2010), Quality Assurance of E-learning, retrieved from http://www.enqa.eu/indirme/papersand-reports/workshop-and-seminar/ENQA_wr_14.pdf, [31.12.2015] [10] Jebamalar, L. E., & Asir, A. G. D. (2014), On Teaching Digital Image Processing with MATLAB, American Journal of Signal Processing 2014, 4(1): 7-15, DOI: 10.5923/j.ajsp.20140401.02 [11] Jebamalar, L. E., & Asir, A. G. D. (2011). Wavelet Domain Shrinkage Methods for Noise Removal in Images: A Compendium. International Journal of Computer Applications, 33(10), 28-32. [12] Kim, S. W. & Lee, M. G. (2007), Validation of an evaluation model for learning management systems, Journal of Computer Assisted Learning, 2007, Issue 4, Vol. 24, pp. 284 - 294. [13] Király, S. (2012), Demonstrating the feature of energy saving of transforms in secondary schools, Teaching Mathematics and Computer Science, 10/1 (2012), 43-55. [14] Park, S.T., Byun, D.W., Park, D. W., & Lee, H. (2005), Evaluation System in e-Learning Through the Knowledge State Analysis Method, retrieved from http://faculty.ksu.edu.sa/Shammami/Documents/CSC%20541/Paper/370.pdf [31.12.2015] [15] Ruth, S.; "Is E-Learning Really Working? The Trillion-Dollar Question," Internet Computing, IEEE, vol.14, no.2, pp.78-82, March-April 2010. [16] Wang, Y.; Fan, S.; Cui, J.; Wang, Z.; & Li, L. (2012), Practical Teaching Reform for Digital Image Processing Based on Project-Driven, Springer Berlin Heidelberg [17] Watson, A.B. (1994), Image Compression Using the Discrete Cosine Transform, retrieved from http://www.mathematica-journal.com/issue/v4i1/article/81-88_Watson.mj.pdf [31.12.2015] [18] Hui, Z. (2007); "Bridge the Gap between Traditional Course Teaching and E-learning: a Case Study," Information Technologies and Applications in Education, 2007. ISITAE '07. First IEEE International Symposium on, vol., no., pp.183-186, 23-25 Nov. 2007.
Author Sándor Király, Institute of Mathematics and Informatics, Eszterházy Károly University of Applied Sciences, Eger, Hungary, e-mail:
[email protected]
Volume 9 Number 2, 2016
22
Acta Didactica Napocensia, ISSN 2065-1430
Sándor Király