molecules Article
HPLC-PDA-MS/MS Characterization of Bioactive Secondary Metabolites from Turraea fischeri Bark Extract and Its Antioxidant and Hepatoprotective Activities In Vivo Mansour Sobeh 1, *, Mona F. Mahmoud 2 , Omar M. Sabry 3 , Rasha Adel 4 , Malak Dmirieh 1 , Assem M. El-Shazly 4 and Michael Wink 1, * ID 1 2 3 4
*
Institute of Pharmacy and Molecular Biotechnology, Heidelberg University, Im Neuenheimer Feld 364, Heidelberg 69120, Germany;
[email protected] Department of Pharmacology and Toxicology, Faculty of Pharmacy, Zagazig University, Zagazig 44519, Egypt;
[email protected] Department of Pharmacognosy, College of Pharmacy, Cairo University, Cairo 11562, Egypt;
[email protected] Department of Pharmacognosy, Faculty of Pharmacy, Zagazig University, Zagazig 44519, Egypt;
[email protected] (R.A.);
[email protected] (A.M.E.-S.) Correspondence:
[email protected] (M.S.);
[email protected] (M.W.); Tel.: +49-6221-54-4880 (M.W.); Fax: +49-6221-54-4884 (M.W.)
Received: 6 November 2017; Accepted: 27 November 2017; Published: 29 November 2017
Abstract: Turraea fischeri is an East African traditional herb, which is widely used in traditional medicine. In this study, we profiled the secondary metabolites in the methanol extract of T. fischeri bark using HPLC-PDA-ESI-MS/MS, and 20 compounds were tentatively identified. Several isomers of the flavonolignan cinchonain-I and bis-dihydroxyphenylpropanoid-substituted catechin hexosides dominated the extract. Robust in vitro and in vivo antioxidant properties were observed in 1,1-diphenyl2-picrylhydrazyl radical scavenging assay (DPPH) and ferric reducing antioxidant power (FRAP) assay, and in the model organism Caenorhabditis elegans. Additionally, the extract exhibited promising hepatoprotective activities in D-galactosamine (D-GaIN) treated rats. A significant reduction in the elevated levels of aspartate aminotransferase (AST), total bilirubin, gamma-glutamyltransferase (GGT), and malondialdehyde (MDA) and increase of glutathione (GSH) was observed in rats treated with the bark extract in addition to D-galactosamine when compared with rats treated with D-galactosamine alone. In conclusion, T. fischeri is apromising candidate for health-promoting and for pharmaceutical applications. Keywords: Turraea fischeri; flavonolignan; cinchonains; HPLC-PDA-ESI-MS/MS; antioxidant; hepatoprotection
1. Introduction Although oxygen metabolism is a central key to life, it is also associated with reactive oxygen species (ROS) production; this phenomenon is known as the “Oxygen Paradox”. A large number of diseases, including cardiovascular diseases, stroke, cancer, diabetes, Parkinson, and Alzheimer disease, are apparently linked to ROS. Also, ageing and several age-related degenerative diseases involve inflammation and deleterious tissue damage from oxidative components. This also applies to liver cirrhosis [1]. In the body, some endogenous antioxidant enzymes are able to cope with ROS, and thus can limit the damage of ROS. However, in many diseases, among them liver injury, the antioxidant abilities
Molecules 2017, 22, 2089; doi:10.3390/molecules22122089
www.mdpi.com/journal/molecules
Molecules 2017, 22, 2089
2 of 14
Molecules 2017, 22, 2089
2 of 14
abilities are diminished or severely compromised. In the case of excessive amounts of ROS, other protective mechanisms, such as external antioxidants, could be of a great value [2,3]. are diminished severely In thefamily case ofcomprises excessive amounts of ROS, other protective The genusorTurraea L.compromised. of the Meliaceae more than 70 species in Africa, mechanisms, such as external antioxidants, could be of a great value [2,3]. Madagascar, Socotra, and tropical Asia; Turraea plants grow as trees or shrubs [4]. The genus is rich The genus Turraea L. of the as Meliaceae family comprises more than 70Several speciesspecies in Africa, Madagascar, in secondary metabolites, such limonoids, sterols, and flavonoids [5]. from the genus Socotra, and tropical Asia; Turraea plants grow as trees or shrubs [4]. The genus is rich in secondary were systematically investigated for their potential as antimalarial agents, among them, T. vogelii, metabolites, as limonoids, sterols, flavonoids Several from the genus T. robusta, T.such nilotica, T. floribunda, and and T. fischeri [6–8].[5]. Also, somespecies African Turraea specieswere are systematically investigated for their potential as antimalarial among them,asthma, T. vogelii, T. robusta, traditionally used as an aphrodisiac and for the treatment of agents, wounds, abscesses, and against T. nilotica, T. floribunda, and T. fischeri [6–8]. Also, some African Turraea species are traditionally used as bilharzias [9]. an aphrodisiac and for the treatment wounds, abscesses,herb asthma, againstused bilharzias Turraea fischeri Gürke is an EastofAfrican traditional and and is widely in folk[9]. medicine Turraea fischeri Gürke an fertility East African traditional and is widely in folk medicine against against stomachache andisfor properties [10].herb However, neitherused phytochemical studies nor stomachache and for fertility properties [10]. However, neither phytochemical studies nor biological biological investigations have been carried out for this plant. Therefore, this work describes for the investigations have been carried outoffor this plant.extract Therefore, this work describes for the first time first time the chemical constituents a methanol of Turraea fischeri bark using HPLC-PDAthe chemical constituents of a methanol extract of Turraea fischeri bark using HPLC-PDA-ESI-MS/MS. ESI-MS/MS. The in vivo hepatoprotection against D-galactosamine (D-GaIN) in toxication in rats The vivo hepatoprotection D-galactosamine (D-GaIN) in toxication and used antioxidant and in antioxidant properties inagainst the nematode Caenorhabditis elegans, which isina rats widely model properties in the nematode elegans, which is a widely used model system in this system in this context [11,12],Caenorhabditis were evaluated. context [11,12], were evaluated. 2. Results and Discussion 2. Results and Discussion 2.1. Phytochemicals in T. fischeri Bark 2.1. Phytochemicals in T. fischeri Bark HPLC-PDA-MS/MS was applied to profile the secondary metabolites of a methanol extract HPLC-PDA-MS/MS was applied to profile the secondary metabolites of a methanol extract from T. fischeri bark, and 20 compounds were tentatively identified (Figures 1 and 2, and Table 1). from T. fischeri bark, and 20 compounds were tentatively identified (Figures 1 and 2, and Table 1). Flavonolignans and bis-dihydroxyphenylpropanoid-substituted catechin isomers dominated the extract. Flavonolignans and bis-dihydroxyphenylpropanoid-substituted catechin isomers dominated the extract.
Figure 1. Cont.
Molecules 2017, 22, 2089
Molecules 2017, 22, 2089
3 of 14
3 of 14
Figure1.1.(a) (a)HPLC-ESI HPLC-ESI(− (−)-MS/MS profile of of aa methanol methanolextract extractof ofT.T.fischeri fischeribark; bark;(b) (b)AAsample samplespectra spectra Figure )-MS/MS profile (UV) of compounds (3–20) at 280 nm. (UV) of compounds (3–20) at 280 nm. Table1. 1. Tentative identification of secondary metabolites of a methanol of T. fischeri bark Tentative identification of secondary metabolites of a methanol extractextract of T. fischeri bark using Table using HPLC-PDA-MS/MS in the negative ion mode. HPLC-PDA-MS/MS in the negative ion mode. No. 2No. 12 151 15 88 99 1010 66 7 7 11 1112 1213 1317 1716 20 165 20 514
tR [M − H]− MS/MS Fragments Tentatively Identified Compounds MS/MS Tentatively Identifiedacid Compounds [M − H]− 2.00 tR 353 179, 191 Fragments Chlorogenic 179, 191 Chlorogenic acid 1.652.00 447 353 315, 153 Protocatechuic acid pentosyl-hexoside 315, 153 Protocatechuic acid pentosyl-hexoside 33.411.65 451 447 299, 341 Cinchonain-I * 33.41 451 299, 341 Cinchonain-I * 25.24 299, 341, Cinchonain-I 25.24 613 613 299,451, 341,595 451, 595 Cinchonain-Ihexoside hexoside ** 26.27 299, 341, Cinchonain-I 26.27 613 613 299,451, 341,595 451, 595 Cinchonain-Ihexoside hexoside ** 27.69 613 613 299,451, 341,595 451, 595 Cinchonain-Ihexoside hexoside ** 27.69 299, 341, Cinchonain-I 22.39 759 759 299, 323, 299, 323,451, 433,613, 451, 649 613, 649 Cinchonain-Irhamnosyl-hexoside rhamnosyl-hexoside * * 22.39 433, Cinchonain-I 23.00 759 299, 323, 433, 451, 613, 649 Cinchonain-I rhamnosyl-hexoside * 23.00 759 299, 323, 433, 451, 613, 649 Cinchonain-I rhamnosyl-hexoside * 27.18 759 299, 323, 433, 451, 613, 649 Cinchonain-I rhamnosyl-hexoside * 27.18 433, Cinchonain-I 28.27 759 759 299, 323, 299, 323,451, 433,613, 451, 649 613, 649 Cinchonain-Irhamnosyl-hexoside rhamnosyl-hexoside * * 28.27 433, Cinchonain-I 30.11 759 759 299, 323, 299, 323,451, 433,613, 451, 649 613, 649 Cinchonain-Irhamnosyl-hexoside rhamnosyl-hexoside * * 299, 323,451, 433,613, 451, 649 613, 649 Cinchonain-Irhamnosyl-hexoside rhamnosyl-hexoside * * 30.1136.1 759 759 299, 323, 433, Cinchonain-I 305, 393, 461, 503, 613, 665 Bis-dihydroxyphenylpropanoid-substituted catechin hexoside ** 36.134.76 759 775 299, 323, 433, 451, 613, 649 Cinchonain-I rhamnosyl-hexoside * 47.74 775 305, 393, 461, 503, 613, 665 Bis-dihydroxyphenylpropanoid-substituted catechin hexoside ** 34.76 461, catechin hexoside ** 12.24 775 793 305, 393, 341, 299,503, 451,613, 503, 665 613, 639Bis-dihydroxyphenylpropanoid-substituted Cinchonain-I syringyl-hexoside * 47.74 775 305, 393, 461, 503, 613, 665 Bis-dihydroxyphenylpropanoid-substituted catechin hexoside ** Bis-dihydroxyphenylpropanoid-substituted catechin 31.45 793 921 341, 299, 305, 461,503, 485,613, 595, 639 613, 811 12.24 451, Cinchonain-I syringyl-hexoside * rhamnosyl-hexoside ** Bis-dihydroxyphenylpropanoid-substituted catechin Bis-dihydroxyphenylpropanoid-substituted catechin 1418 31.45 485, 38.77 921 921 305, 461, 305, 461,595, 485,613, 595, 811 613, 811 rhamnosyl-hexoside ** rhamnosyl-hexoside ** Bis-dihydroxyphenylpropanoid-substituted catechin Bis-dihydroxyphenylpropanoid-substituted catechin 1819 38.77 485, 44.64 921 921 305, 461, 305, 461,595, 485,613, 595, 811 613, 811 rhamnosyl-hexoside ** rhamnosyl-hexoside ** Bis-dihydroxyphenylpropanoid-substituted catechin Bis-dihydroxyphenylpropanoid-substituted catechin 193 44.648.54 921 939 305, 461, 485,289, 595,613, 613, 811 759 rhamnosyl-hexoside syringyl-rhamnoside ** Bis-dihydroxyphenylpropanoid-substituted catechin Bis-dihydroxyphenylpropanoid-substituted catechin 34 8.549.72 939 939 289,289, 613,433, 759613, 759 syringyl-rhamnoside ** syringyl-rhamnoside ** Bis-dihydroxyphenylpropanoid-substituted catechin of the compounds is not resolved; this compound could be cinchonain-Ia, Ib, Ic, 4 * indicates 9.72 that the 939 stereochemistry 289, 433, 613, 759 syringyl-rhamnoside or Id. ** indicates that the stereochemistry of the compounds is not resolved. The compounds are**arranged based on molecular Compounds areof numbered in accordance to Figure 1. * their indicates thatweights. the stereochemistry the compounds is not resolved; this compound could be
cinchonain-Ia, Ib, Ic, or Id. ** indicates that the stereochemistry of the compounds is not resolved. The compounds are arranged based on their molecular weights. Compounds are numbered in accordance to Figure 1.
Molecules 2017, 22, 2089 Molecules 2017, 22, 2089
4 of 14 4 of 14
Molecules 2017, 22, 2089
4 of 14
Figure 2. Tentative structures of some compounds from Table 1.
Figure 2. Tentative structures of some some compounds compounds from from Table Table1.1. For instance, peak (15) at a retention time 33.41 min, exhibited a molecular ion peak [M − H]−
For(m/z) instance, peak (15) ataaretention retention time 33.41 min, exhibited molecularion ion peak[M [M−−H] H]−− at 451 and two daughter ions at m/ztime 341 and 299;min, it was assigned to cinchonain-I, as previously For instance, peak (15) at 33.41 exhibited aamolecular peak [13] (Figure 3a).ions Three (8, and 9, and 10)it retention times 26.27, andas (m/z) at 451 daughter ions at peaks m/z 341 299; assigned to cinchonain-I, as27.69, previously (m/z) atdescribed 451 and and two two daughter at m/z 341 and 299; itatwas was assigned to25.24, cinchonain-I, previously respectively, showed [MThree − H]− (m/z) at 613 and three10) fragment ions at 299, 341, and 451;26.27, they were described [13] (Figure 3a). peaks (8, 9, and at retention times 25.24, 27.69, described [13] (Figure 3a). Three peaks (8, 9, and 10) at retention times 25.24, 26.27, and and 27.69, identified as cinchonain-I-hexoside isomers (Figure 3b). − (m/z) at − respectively, showed [M − H] 613 and three fragment ions at 299, 341, and 451; they were respectively, showed [M − H] (m/z) at 613 and three fragment ions at 299, 341, and 451; they were identified as as cinchonain-I-hexoside cinchonain-I-hexoside isomers isomers (Figure (Figure3b). 3b). identified
Figure 3. (a) MS/MS fragmentation of cinchonain-I at [M − H]− (m/z) at 451; (b) MS/MS fragments of cinchonain-I hexoside at [M − H]− (m/z) at 613; (c) MS/MS spectra of cinchonain-I rhamnosyl-hexoside at [M − H]− m/z 759.
Also, six further compounds (6, 7, 11, 12, 13, and 17) displayed similar molecular ion peaks at [M − H]− (m/z) 759. In MS/MS analyses, they produced fragment ions as 649 (M–H–110), 613 (M–H–146, Figure 3. (a) (a) MS/MS MS/MS and fragmentation ofcinchonain-I cinchonain-I [M−hexose −H] H]−− (m/z) (m/z) at MS/MS fragments of Figure 3. fragmentation of atat[M at 451; (b) MS/MS rhamnose moiety), 451 (M–H–146–162, rhamnose and moieties); they were characterized as of − − atat613; (c) spectra of rhamnosyl-hexoside cinchonain-I hexoside [M−− H] H] (m/z) cinchonain-I hexoside atat[M (m/z) 613; (c)MS/MS MS/MS spectra ofcinchonain-I cinchonain-I rhamnosyl-hexoside cinchonain-I rhamnosyl-hexoside isomers (Table 1, Figure 3c). Additionally, a minor compound (5) at a− time at [M [M −retention H] 759. at H]−−m/z m/z 759.12.24 min had [M − H]− m/z 793 and in MS2 demonstrated daughter ions at m/z 613 (M–H–180, syringyl moiety) and 451 (M–H–180–162, syringyl and hexoside moieties); it was tentatively identified as cinchonain-I 1 and Figure 4). Also, six further compounds (6, 7,syringyl-hexoside 11, 12, 13, and (Table 17) displayed similar molecular ion peaks at
Also, six further compounds (6, 7, 11, 12, 13, and 17) displayed similar molecular ion peaks − (m/z) 759. In MS/MS analyses, they produced fragment ions as 649 (M–H–110), 613 (M–H–146, [M[M − H] − (m/z) 759. In MS/MS analyses, they produced fragment ions as 649 (M–H–110), at − H] rhamnose moiety), and 451moiety), (M–H–146–162, rhamnose and hexose moieties); they were characterized as 613 (M–H–146, rhamnose and 451 (M–H–146–162, rhamnose and hexose moieties); they were cinchonain-I rhamnosyl-hexoside isomers (Table 1,isomers Figure(Table 3c). Additionally, minor compound (5) characterized as cinchonain-I rhamnosyl-hexoside 1, Figure 3c).aAdditionally, a minor − m/z 793 and in MS2 demonstrated daughter ions at m/z 613 at a retention time 12.24 min had [M − H] − 2 compound (5) at a retention time 12.24 min had [M − H] m/z 793 and in MS demonstrated daughter (M–H–180, syringyl moiety) and moiety) 451 (M–H–180–162, syringyl and hexoside moieties); it was ions at m/z 613 (M–H–180, syringyl and 451 (M–H–180–162, syringyl and hexoside moieties); tentatively identified as cinchonain-I syringyl-hexoside (Table(Table 1 and 1Figure 4). 4). it was tentatively identified as cinchonain-I syringyl-hexoside and Figure
Molecules 2017, 22, 2089
5 of 14
Molecules 2017, 22, 2089 Molecules 2017, 22, 2089
5 of 14 5 of 14
Figure 4. MS/MSspectra spectraofof ofcinchonain-I cinchonain-Isyringyl-hexoside syringyl-hexosideatat at[M [M−−−H] H]−−− m/z m/z 793. Figure 4. 4. MS/MS m/z793. 793. Figure MS/MS spectra cinchonain-I syringyl-hexoside [M H]
Two peaks peaks at 34.76 34.76 and and 47.74 47.74 min min (compounds (compounds 16 16 and and 20) 20) with with aa molecular molecular ion ion of of [M [M −− H] H]−− at at Two Two peaks atat34.76 and 47.74 min (compounds 16 and 20) with a molecular ion of [M − H]− at 2 they produced aa major major ion ion peak peak at at m/z m/z 613 [M–H–162, [M–H–162, loss loss of of a hexose hexose m/z 775 775 were were detected. detected. In In MS MS22,, they m/z m/z 775 were detected. In MS , they produced produced a major ion peak at m/z 613 613 [M–H–162, loss of aa hexose 3 of 613, two daughter ions at m/z 503 and 461 were observed; thus, they were moiety]. In MS 3 3 ofof moiety].InInMS MS 613, daughter at503 m/zand 503461 and 461 were observed; were moiety]. 613, twotwo daughter ions ions at m/z were observed; thus, theythus, werethey identified identified as as bis-dihydroxyphenylpropanoid-substituted bis-dihydroxyphenylpropanoid-substituted catechin catechin hexoside hexoside isomers, isomers, as as reported reported identified as bis-dihydroxyphenylpropanoid-substituted catechin hexoside isomers, as reported before [13] before [13] [13] (Figures (Figures 5a,b and 6). before (Figures 5a,b and 6). 5a,b and 6).
Figure Negative ion ESI-MS/MS Figure 5.5. 5. Negative Negative ESI-MS/MS spectra spectra of of bis-dihydroxyphenylpropanoid-substituted bis-dihydroxyphenylpropanoid-substituted Figure ion ESI-MS/MS spectra of bis-dihydroxyphenylpropanoid-substituted 22 of [M − 3 of main daughter ion at m/z 613. −−m/z 3 of catechin–hexoside; (a) MS m/z 775; (b) MS of [M − H] 775; (b) MS main daughter daughter ion ion at at m/z m/z 613. 613. catechin–hexoside; (a) MS catechin–hexoside; (a) MS2 of [M − H]− m/z 775; (b) MS3 of main
Molecules 2017, 22, 2089 Molecules 2017, 22, 2089
6 of 14 6 of 14
Figure 6. A proposed fragmentation pattern of bis-dihydroxyphenylpropanoid-substituted catechin Figure 6. A proposed fragmentation pattern of bis-dihydroxyphenylpropanoid-substituted catechin − hexoside 775. hexoside at at [M [M −−H] H]−m/z m/z 775.
In the extract, three compounds (14, 18, and 19) had similar [M − H]−− at m/z 921, as well as In fragmentation the extract, three compounds and 19)ahad similar [M −ion H]at m/z at m/z as the well as similar pattern. In MS2, 2(14, they18, produced major daughter 811 921, due to loss similar fragmentation pattern. MStwo , they major ion at m/z 811 due to the of dihydroxyphenyl group. Also,Inthe ionsproduced at m/z 775aand 613daughter were produced due to the losses of loss of dihydroxyphenyl group. Also, the two ions at m/z 775 and 613 were produced due to 146 and 162, respectively. Therefore, these three precursors were tentatively assigned the to losses of 146 and 162, respectively. Therefore, these three precursors were tentatively assigned to bis-dihydroxyphenylpropanoid-substituted catechin rhamnosyl–hexoside isomers. Their retention bis-dihydroxyphenylpropanoid-substituted catechin rhamnosyl–hexoside isomers. Their retention times are documented in Table 1 and a representative mass spectrum is presented in Figure 7. Other times are documented 1 and aa representative mass at spectrum presented Figure 7.ions Other − m/z two minor peaks (3 andin4)Table produced molecular ion peak [M − H]is 939 andinfragment at two 759 − minor peaks and 4) producedcharacterized a molecular ion peak at [M − H] m/z 939 and fragment ions at 759 and 613; they(3were tentatively as bis-dihydroxyphenylpropanoid-substituted catechin and 613; they were tentatively characterized as bis-dihydroxyphenylpropanoid-substituted catechin syringyl-rhamnoside isomers (Table 1). syringyl-rhamnoside isomers (Table 1). 2.2. Antioxidant and Hepatoprotective Activities 2.2. Antioxidant and Hepatoprotective Activities In initial analyses, we determined the total phenolic content of a bark extract using the In initial analyses, we determined the total phenolic content of a bark extract using the Folin-Ciocalteu method. The extract contained 488 mg gallic acid equivalent/g extract. Next, we Folin-Ciocalteu method. The extract contained 488 mg gallic acid equivalent/g extract. Next, assessed the in vitro antioxidant properties of this extract by DPPH (1,1-diphenyl-2-picrylhydrazyl we assessed the in vitro antioxidant properties of this extract by DPPH (1,1-diphenyl-2-picrylhydrazyl radical scavenging assay) and FRAP (Ferric reducing antioxidant power) assay. A pronounced radical scavenging assay) and FRAP (Ferric reducing antioxidant power) assay. A pronounced antioxidant activity was detected in both of the assays in comparison to the potent antioxidant antioxidant activity was detected in both of the assays in comparison to the potent antioxidant compound ascorbic acid (Table 2). Comparable antioxidant properties were reported in Trichilia catigua compound ascorbic acid (Table 2). Comparable antioxidant properties were reported in Trichilia catigua and Parabarium huaitingii [14,15]. and Parabarium huaitingii [14,15]. Table 2. Antioxidant properties of a methanol extract from T. fischeri bark. Table 2. Antioxidant properties of a methanol extract from T. fischeri bark. Sample Bark Extract AscorbicAcid Sample Bark5.12 Extract AscorbicAcid DPPH (EC50, µg/mL) 3.31 FRAP (mM FeSO 4/mg extract) 18.32 22 DPPH (EC , µg/mL) 5.12 3.31 50
FRAP (mM FeSO4 /mg extract)
18.32
22
Molecules 2017, 22, 2089 Molecules 2017, 22, 2089
7 of 14 7 of 14
Figure7. Negative ion ESI-MS/MSspectra spectraofofbis-dihydroxyphenylpropanoid-substituted bis-dihydroxyphenylpropanoid-substituted catechin Figure 7. Negative ion ESI-MS/MS catechin − m/z 921. rhamnosyl-hexoside at [M − H] − rhamnosyl-hexoside at [M − H] m/z 921.
In the next step, we investigated whether these in vitro antioxidant activities would induce In the next step, thesestudied in vitrothe antioxidant activities would induce protective effects in we vivoinvestigated in C. elegans.whether We initially survival rate of the wild type N2 protective effects in vivo in C. elegans. We initially studied the survival rate of the wild type N2 worms worms that were treated with the toxic and pro-oxidant juglone (80 µM) to generate oxidative stress thatthat were treated with 24 theh.toxic and pro-oxidant juglone (80with µM)the to extract generate oxidative that is is lethal within The pre-treatment of the worms resulted in anstress increased lethal within 24in h.aThe of the(Figure worms8a). with the extract resulted in an increased survival survival rate dosepre-treatment dependent manner rate in aGiven dose dependent (Figure 8a).further to assess the abilities of the extract to diminish these initialmanner findings, we went Given these initial we went further assess theROS abilities thequantified extract to in diminish ROS ROS production or at findings, least scavenge it. Thus, the to intracellular levelof was N2 worms against elevated ROS levels. The extract the ROS level in was a concentration dependent pattern production or at least scavenge it. Thus, thereduced intracellular ROS level quantified in N2 worms against (Figure 8b).levels. The extract reduced the ROS level in a concentration dependent pattern (Figure 8b). elevated ROS Prolonged exposure to extreme stress conditions harm damage proteins, Prolonged exposure to extreme stress conditions cancan harm cells,cells, damage proteins, and and thusthus result result in cell and tissue death. Heat-shock proteins (HSPs) can be detected in all of the studied organisms, in cell and tissue death. Heat-shock proteins (HSPs) can be detected in all of the studied organisms, they increasinglyexpressed expressedininthe thestressed stressed cells cells to to protect protect and/or and/or repair byby andand they areare increasingly repairsuch suchdamage damage preventing proteinaggregation aggregationand and misfolding, misfolding, and maintain homeostasis preventing protein and to to maintain homeostasis[16]. [16].ToToexplain explainthe the possible mechanism of the observed in vivo antioxidant activities of the extract, we incubated possible mechanism of the observed in vivo antioxidant activities of the extract, we incubatedthe the transgenic strains TJ375 with 20 µM juglone for 24 h to induce oxidative stress, and then we transgenic strains TJ375 with 20 µM juglone for 24 h to induce oxidative stress, and then we measured measured the expression of the green fluorescent protein (GFP) in Phsp-16.2::GFP in the pharynx. the expression of the green fluorescent protein (GFP) in Phsp-16.2::GFP in the pharynx. The extract The extract significantly reduced HSP-16.2 expression in a dose-dependent fashion (Figure 8c). significantly reduced HSP-16.2 expression in a dose-dependent fashion (Figure 8c). To further elucidate the mechanisms by which the extract exerts its antioxidant activities, we To further elucidate the mechanisms by which the extract exerts its antioxidant activities, assessed its effects on the localization of the FOXO transcription factor DAF-16. The translocation of we DAF-16 assessedfrom its effects on the localization of the FOXO transcription factor DAF-16. The translocation the cytosol into the nucleus is a primary prerequisite for its ability to promote the of DAF-16 from the cytosol the nucleus is a superoxide primary prerequisite forheat-shock its abilityproteins to promote expression of several defense into enzymes, among them, dismutase and [17]. theApparently, expression the of several defense enzymes, among them, superoxideindismutase and heat-shock extract increased nuclear localization of DAF-16::GFP daf-16-jfp reporter strain proteins [17]. Apparently, extract increased nuclear localization of DAF-16::GFP in daf-16-jfp (transgenic strain TJ356),theindicating a reduced DAF-16 phosphorylation status after extract reporter strain (transgenic strain TJ356), indicating a reduced DAF-16 phosphorylation status after treatment in a dose-dependent pattern (Figure 8d). This suggests that the in vivo antioxidant extract treatment in a dose-dependent (Figure 8d). This suggestspathway. that the In in vivo antioxidant activities of T. fischeri extract might bepattern mediated by the DAF-16/FOXO conclusion, the activities of T. fischeri might mediated and by the pathway. conclusion, polyphenolics in the extract bark extract arebebioavailable are DAF-16/FOXO partly taken up by C. elegans.InThe results theagree polyphenolics barkexperiments extract are bioavailable and are partly taken up by C. elegans. The results with thoseinofthe earlier in our laboratory [18–21]. In light ofof these in vitro and in vivo findings, we investigated agree with those earlier experiments in our laboratory [18–21]. the hepatoprotective potential of the bark extract against the severe effects of liver intoxication in the well established rat model after
Molecules 2017, 22, 2089
8 of 14
In light of these in vitro and in vivo findings, we investigated the hepatoprotective potential of theMolecules bark extract against the severe effects of liver intoxication in the well established rat model 2017, 22, 2089 8 of 14 after injection of D-galactosamine (D-GaIN) [22]. We first investigated the biochemical changes in injection of D-galactosamine (D-GaIN)injection. [22]. We first investigatedelevation the biochemical the the liver enzymes after 24 h of D-GalN A significant in liverchanges enzymeinactivities liver enzymes after 24 h(AST), of D-GalN injection. A significant(ALT)) elevation liver enzymewere activities (aspartate aminotransferase alanine aminotransferase and in total bilirubin observed (aspartate aminotransferase (AST), (ALT)) and total bilirubinthe were in D-GalN-rats. Pretreatment of the rats alanine with 200aminotransferase mg/kg extract and silymarin attenuated increase observed in D-GalN-rats. Pretreatment of the rats with 200 mg/kg extract and silymarin attenuated in ALT and AST activities, and total bilirubin (p < 0.05, Figure 8). However, pretreatment with the increase in ALT and AST activities, and total bilirubin (p < 0.05, Figure 8). However, pretreatment 100 mg/kg b.w. extract significantly decreased AST and gamma-glutamyltransferase (GGT) levels with 100 mg/kg b.w. extract significantly decreased AST and gamma-glutamyltransferase (GGT) whenlevels compared with D-GalN < 0.05),(pbut did not and total bilirubin when compared when compared with(p D-GalN < 0.05), but affect did notALT affect ALT and total bilirubin when with compared D-GalN (pwith > 0.05, Figure 9). D-GalN (p > 0.05, Figure 9).
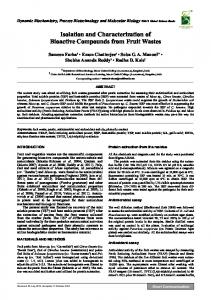
Figure 8. (a) Influence of T. fischeri extract on the survival rate in N2 worms against the deleterious
Figure 8. (a) Influence of T. fischeri extract on the survival rate in N2 worms against the deleterious effects of juglone (80 µM). The extract improved the survival rate to 49.39%, 57.73% and 58.54% at effects of juglone (80 µM). The extract improved the survival rate to 49.39%, 57.73% and 58.54% at concentrations of 25, 50, and 100 µg/mL, respectively, when compared to the juglone-alone control concentrations of 25, 50, and 100 µg/mL, respectively, when compared to the juglone-alone control (21.49%), (mean ± SEM, n = 3); (b) Influence on intracellular ROS accumulation in N2 nematodes (21.49%), (mean SEM, n =dye. 3); A (b)significant Influence on intracellular ROSinaccumulation in N2 50.44% nematodes evidenced by ± H2DCF-DA reduction was observed ROS levels by 44.96%, evidenced by H2DCF-DA dye. A were significant wasand observed in ROS levels by 44.96%,the 50.44% and 58.32% when the worms treatedreduction with 25, 50, 100 µg/mL extract, respectively; and 58.32% worms with 25, by 50,fluorescence and 100 µg/mL extract,Data respectively; the as control control when was setthe 100%. ROSwere levelstreated were measured microscopy. are expressed relative fluorescent intensity compared to group (mean ± SEM, Data n = 3);are (c)expressed Influence of was set 100%. ROS levels were measured bycontrol fluorescence microscopy. as the relative extract on Phsp-16.2::GFP expression in mutant strains TJ375. Phsp-16.2::GFP levels were significantly fluorescent intensity compared to control group (mean ± SEM, n = 3); (c) Influence of the extract on decreased by 51.49, 72.73, 86.36% after pre-treatment of the nematodes with 25, significantly 50, and 100 µg/mL Phsp-16.2::GFP expression in mutant strains TJ375. Phsp-16.2::GFP levels were decreased extract followed by 20 µM juglone; (d) Influence of the extract on the localisation of transcription by 51.49%, 72.73%, 86.36% after pre-treatment of the nematodes with 25, 50, andthe 100 µg/mL extract factor DAF-16 in mutant TJ356 strains. The extract induced nuclear localization to 46.67%, 56.67%, followed by 20 µM juglone; (d) Influence of the extract on the localisation of the transcription factor and 71.67% at concentrations of 25, 50, and 100 µg/mL extract, respectively. DAF-16::GFP localization DAF-16 in mutant TJ356 strains. The extract induced nuclear localization to 46.67%, 56.67%, and 71.67% was determined using fluorescence microscopy. The worms were assigned into three groups: at concentrations of 25, 50, and 100 µg/mL extract, respectively. DAF-16::GFP localization was cytosolic, intermediate, and nuclear according to their phenotype. ** p < 0.01, *** p < 0.001 related to determined using fluorescence microscopy. worms were assigned intocomparable three groups: cytosolic, control was analysed by one-way ANOVA. The Interestingly, the extract showed activities intermediate, and nuclear according to their phenotype. ** p < 0.01, *** p < 0.001 related to control with the reference compound epigallocatechin gallate (EGCG) in all assays. was analysed by one-way ANOVA. Interestingly, the extract showed comparable activities with the reference compound epigallocatechin gallate (EGCG) in all assays.
Molecules 2017, 22, 2089 Molecules 2017, 22, 2089
9 of 14 9 of 14
Figure 9. Influence of a single oral dose of D-galactosamine—induced liver injury (800 mg/kg) and Figure 9. Influence of a single oral dose of D-galactosamine—induced liver injury (800 mg/kg) and oral administration of two doses (100 mg/kg and 200 mg/kg b.w.) of T. fischeri extract and the positive oral administration of two doses (100 mg/kg and 200 mg/kg b.w.) of T. fischeri extract and the control silymarin (100 mg/kg) on serum enzyme activities (A) alanine aminotransferase (ALT); positive control silymarin (100 mg/kg) on serum enzyme activities (A) alanine aminotransferase (ALT); (B) aminotransferase(AST); (AST);(C) (C) gamma-glutamyltransferase (GGT); bilirubin (B) aspartate aspartate aminotransferase gamma-glutamyltransferase (GGT); (D) (D) TotalTotal bilirubin level. level. Results are expressed as mean ± SEM. * Significant difference compared to normal Results are expressed as mean ± SEM. * Significant difference compared to normal controlcontrol group; @ Significant difference compared to D-GalN treated group at p < 0.05. n = 6; by One Way group; @ Significant difference compared to D-GalN treated group at p < 0.05. n = 6; by One Way ANOVA and ANOVA and Tukey Tukey post hoc test. post hoc test.
Furthermore, we studied the influence of T. fischeri extract on oxidative stress markers. D-GalN Furthermore, we studied the influence of T. fischeri extract on oxidative stress markers. D-GalN injection increased the generation of ROS and reduced the level of endogenous antioxidants. This injection increased the generation of ROS and reduced the level of endogenous antioxidants. resulted in an increased oxidative stress, as revealed by elevation of malondialdehyde (MDA), a marker This resulted in an increased oxidative stress, as revealed by elevation of malondialdehyde (MDA), of lipid peroxidation and depletion of glutathione (GSH) (p < 0.05, Figure 10). Oral administration of a marker of lipid peroxidation and depletion of glutathione (GSH) (p < 0.05, Figure 10). Oral T. fischeri extract in doses of 100 mg/kg and 200 mg/kg b.w. and silymarin revealed potent administration of T. fischeri extract in doses of 100 mg/kg and 200 mg/kg b.w. and silymarin revealed antioxidant effect. It diminished the elevated MDA content and increased endogenous GSH when potent antioxidant effect. It diminished the elevated MDA content and increased endogenous GSH compared to D-GalN alone (p < 0.05, Figure 10). The effect of the extract in either dose levels was when compared to D-GalN alone (p < 0.05, Figure 10). The effect of the extract in either dose levels similar to silymarin on MDA but the latter exerted a stronger effect on GSH. was similar to silymarin on MDA but the latter exerted a stronger effect on GSH. Apparently, the studied extract exerted pronounced hepatoprotective activities, as evidenced Apparently, the studied extract exerted pronounced hepatoprotective activities, as evidenced by the biochemical activities of the liver enzymes and the ROS markers GSH and MDA. Additional by the biochemical activities of the liver enzymes and the ROS markers GSH and MDA. Additional evidence was found when the histopathological changes were investigated. D-GalN caused focal evidence was found when the histopathological changes were investigated. D-GalN caused focal hepatic necrosis and hepatic inflammation as revealed by mononuclear cell infiltration (Figure 11B). hepatic necrosis and hepatic inflammation as revealed by mononuclear cell infiltration (Figure 11B). Furthermore, acute cell swelling and intense microsteatosis were also observed in the hepatic cells. Furthermore, acute cell swelling and intense microsteatosis were also observed in the hepatic cells. Single or multiple hepatic cells showed apoptosis. Moreover, vasculitis and endotheliosis affected Single or multiple hepatic cells showed apoptosis. Moreover, vasculitis and endotheliosis affected some portal areas. The majority of portal areas showed intense portal fibrosis and inflammation, as some portal areas. The majority of portal areas showed intense portal fibrosis and inflammation, revealed by mononuclear cells infiltration and contain proliferative bile ductules. In T. fischeri as revealed by mononuclear cells infiltration and contain proliferative bile ductules. In T. fischeri (100 mg extract/kg) treated group, moderate microscopic changes represented by diffuse acute cells (100 mg extract/kg) treated group, moderate microscopic changes represented by diffuse acute welling and mild portal fibrosis were encountered (Figure 11C). The portal vasculatures were cells welling and mild portal fibrosis were encountered (Figure 11C). The portal vasculatures were dilated and showed lymphocytosis and scattered minute microsteatosis in individualized hepatic dilated and showed lymphocytosis and scattered minute microsteatosis in individualized hepatic cells. The remaining hepatic parenchyma was apparently normal. Pretreatment with 200 mg/kg of cells. The remaining hepatic parenchyma was apparently normal. Pretreatment with 200 mg/kg the extract exerted a better improvement in the structural changes of the liver where only portal of the extract exerted a better improvement in the structural changes of the liver where only portal inflammation was observed (Figure 11D). The effect of the known liver protectant silymarin was similar to the 200 mg/kg dose of the extract (Figure 11E).
Molecules 2017, 22, 2089
10 of 14
inflammation was observed (Figure 11D). The effect of the known liver protectant silymarin was similar to the22,200 mg/kg dose of the extract (Figure 11E). Molecules 2017, 2089 10 of 14 Molecules 2017, 22, 2089 10 of 14
Figure 10. Influence of single oral dose of D-galactosamine-induced liver injury (800 mg/kg) Figure and Figure 10. 10. Influence Influence of of aaa single single oral oral dose doseof ofD-galactosamine-induced D-galactosamine-induced liver liver injury injury (800 (800mg/kg) mg/kg) and and oral administration of two doses (100 mg/kg and 200 mg/kg b.w.) of T. fischeri extract and the positive oral administration of two doses (100 mg/kg and 200 mg/kg b.w.) of T. fischeri extract and the oral administration of two doses (100 mg/kg and 200 mg/kg b.w.) of T. fischeri extract and the positive control silymarin (100 mg/kg) on (A) Reduced glutathione content (GSH, mg/g liver tissue); positive control silymarin (100 mg/kg) on (A) Reduced glutathione content (GSH, mg/g liver tissue); control silymarin (100 mg/kg) on (A) Reduced glutathione content (GSH, mg/g liver tissue); (B) (B) Malondialdehyde content (MDA, nmol/g liver tissue). Results are (B) Malondialdehyde content (MDA, nmol/g liver tissue). Results areexpressed expressedas mean ±±± SEM. SEM. Malondialdehyde content (MDA, nmol/g liver tissue). Results are expressed asas mean mean SEM. Significant Significant difference when compared to *** Significant difference compared comparedto tonormal normalcontrol controlgroup; group;@@ @ Significant difference when compared Significant difference difference compared to normal control group; Significant difference when compared to # # D-GalN treated group at pp p