manage image sequence then recognize human action with simple human model by model-based recognition ... mathematical mo
GSTF Journal on Computing (JoC) Vol.5 No.3, May 2017
Human Activity Recognition System Based-on Sequential Logic Circuits and Statistical Models Nattapon Noorit
Nikom Suvonvorn
Department of Computer Engineering Faculty of Engineering, Prince of Songkla University Songkhla, Thailand
[email protected]
Department of Computer Engineering Faculty of Engineering, Prince of Songkla University Songkhla, Thailand
[email protected]
Abstract—this research proposed the human activity recognition system that described complete flow of processes from lowest process (dealing with images) to highest process (recognize human activity). We proposed human action recognition that manage image sequence then recognize human action with simple human model by model-based recognition technique. The experimental result shows good accuracy which up to 93% correctly recognized. We proposed the human activity process with 3 methods that consecutive improved. All of those methods can use the result of action recognition as inputs. First method is FSM recognizer. The human model in Finite State Machine (FSM) recognizer can be modeled by rational condition that make it easy to understand and consume low computation cost but it hard to define complex activity condition so it is unsuitable method for complex activity. The second recognizer applied Hidden Markov Model (HMM) for activity modeling. The HMM recognizer can dealing with much more complex activity and give fair recognition rate. However, HMM recognizer is not involve feature priority that should has effect to accuracy so we proposed the third recognizer that used graph similarity measurement for activity modeling and activity classification. The third one, Graph Similarity Measurement (GSM) recognizer involved feature priority for recognition method then show better result than HMM in most measurement. GSM recognizer has ~84% accuracy in average. FSM recognizer is suitable for simple activity with low computation cost while HMM is suitable for much more complex activity and use single feature for recognition process. However, HMM method may not give best result for the activity that use multiple features. GSM is also suitable for complex activity and, furthermore, give better result than HMM for the activity that trained from multiple features.
[15, 16]. However, many of its share the same idea that is matching unknown sequences with references to recognize a particular activity. Our works also follow this concept too. Various techniques are used to tackle activity recognition problems. Finite State Machine (FSM) is one of its. FSM is mathematical model which can use to design sequential logic circuit. The pattern of activity can be described by state machine with specific transition. FSM model is good for human perception. It is easy to understand, required low computation cost and can be designed with minimal effort. However, FSM quite sensitive to noise and may not suitable for complex sequence design. FSM is used in many papers like [17, 18, 19, and 20] Another widely used technique is Hidden Markov Model (HMM). HMM is statistical model that can use to model activity by given observation sequences. The recognition process can be done under statistical measurement between unknown sequence and particular activity models. HMM can be applied in many ways for solving various problems in several works such as [21, 22, and 23]. HMM can dealing with complex sequences but ordinary HMM may not has enough flexibility for multiple features with coming in separate sequences. Graph theory used in broad fields such as chemical [1], biology [2], social network [3] and computer vision [4, 5]. Graph theory also applied to activity recognition [6, 7]. This theory shows ability to represent complex pattern in an easier way and it has flexibility to adjust itself to tackle many problems in various ways that still based on graph theory. Its flexibility can be applied to some condition that can take advantage over ordinary HMM.
Keywords—activity recognition; action recognition; finite state machine; hidden markov model; graph similarity
I. INTRODUCTION
This paper proposed human activity recognition system that consist of several processes with many methods. First process is action recognition that used model-based method. The result of first process can use as input for next process. Second process is activity recognition. This process has 3 different methods including: FSM, HMM and GSM. Each method has its own advantage and limitation that will be described in further section.
Human activity recognition from videos shows importance roles in many automatic event detection and recognition applications like surveillance system, elder or patient monitoring. Its ability also apply to context awareness application in many fields like industrial, medical and educational domains. We can found many papers that proposed activity recognition methods in various ways such as [8, 9, 10, 11 and 12]. For instance, some papers tried to learn activity pattern from data in the scene [13, 14], while some interesting papers used manual defined model for a particular activity recognition DOI: 10.5176/2251-3043_5.3.376
© The Author(s) 2017. This article is published with open access by the GSTF 42
GSTF Journal on Computing (JoC) Vol.5 No.3, May 2017
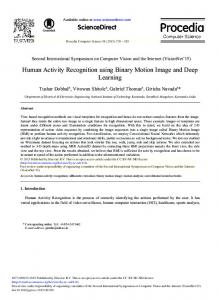
II. SYSTEM OVERVIEW Our system begin with fetch image from video or camera then send image sequence to action recognition process that used motion/texture based for human detection and tracking.
Image Fetching
In action recognition process, complex human body structure will be reconstructed into 3 simple parts (head, torso and legs) with 2 internal body structure vectors and 3 movements vectors (see figure 1 in action recognition process part). Structure vectors and movement vectors are used to define action recognition condition. In the meantime, movement features are calculated from tracking method. The result will gives action sequence with movement features that used in activity recognition (see details in section III).
Image Sequence Action Recognition (Model-based)
The Activity recognition process is designed for support both simple activity and complex activity with appropriate computation cost. For simple activity, Finite State Machine (FSM) handle this task with manual defined activity pattern. FSM can do the job with fast computation. For complex activity, HMM and GSM will take the job instead. Both methods is more suitable than FSM because complex pattern is hard to define manually. HMM can makes activity model with training process then classify activity by statistical measurement. GSM used learning method based-on graph theory. Statistical models are used for recognize activity with multiple features. Furthermore, our proposed GSM shown the better recognition results over ordinary HMM (the details described in section IV).
en wk si …
Action Sequence with Movement Features
Activity Recognition
III. ACTION RECOGNITION FSM
We can recognize human action from image sequences by 4 sub-process including: (A) Motion Segmentation (B) Human Structure Reconstruction (C) Human Model Tracking and Parameter Calculation (D) Action Recognition. A. Motion Segmentation This process focus to segment the region that human appeared. New incoming person in the scene should be detected as motions first so background subtraction technique is used for detect motion regions in image sequence for first time new incoming person locating. For reduce noise in detection process, morphological opening and closing filters are applied to images too.
GSM
HMM
Possible Activity(s)
Figure 1 Human Activity Recognition Overview
Detected motion regions of a person may have several pieces because of fragmentation from imperfect motion detection process so the motion regions that stay very close to each other will be considered as same object. After merging process, the new detected regions will be segmented by color difference.
After color segmentation process, we have a new appeared motion regions that segmented by texture (the group of color that know exactly position) that are used in human structure reconstruction process.
© The Author(s) 2017. This article is published with open access by the GSTF 43
GSTF Journal on Computing (JoC) Vol.5 No.3, May 2017
New detected motion regions are matched with our simple human model by physical human structure constraint with standing action. After matching process, we can suddenly initial internal structural parameters. For external structural parameter initialization, we need to wait until a movement detected.
C. Human Model Tracking and Parameters Calculation This process focus to track human movement through frame by frame. Each part in model is tracked separately by continuous adaptive mean-shift (Camshift) with texture property.
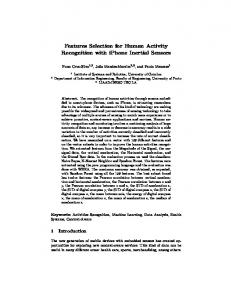
(a) (b) Figure 2 Human Segmentation (a) Person in image that segmented region by color segmentation (b) Simplification of human structure
In human reconstruction process, we get human position parts with its size and texture property. The process is executed separately on each part, the texture property will be converted to probability of color then project back to image in term of gray scale image. Previous position and size used as initial search window for start finding new position and new size by calculating maximum of probability distribution in probabilistic gray scale image. After convergence of search window is reached, we known the new position and size of tracked part.
B. Human Structure Reconstruction This process focus to matching new detected motion regions with a predefined simple human structure which has only 3 parts including head, torso and legs (2 legs are merged into 1 part). Each part is represented with ellipse (see Figure 2 (b)) that can has resizing and tilt depend on new appearance from moving.
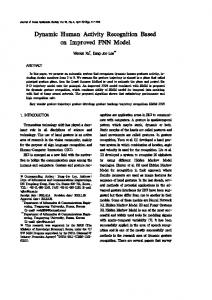
New position of human model parts (head, torso and legs) are used for calculate internal [ , ] and external parameters [ , , ] (see Figure 3). The internal parameter vectors [ , ] represent 2 characteristics including distance [v , v ] and angle [v θ ,v θ ]. The external parameter vectors [ , , ] also show 2 characteristics including direction [v , v , v ] and moving distance [v , v , v ]. The distance parameters like [v , v , v , v , v ] can calculated from previous position and current position in term of point(coordinate). The angle and direction like [v θ ,v θ , v , v , v ] can also calculated by those coordinates too. We can calculate those parameter with below equation.
Figure 3 Simple human model with parameters
v
From 3 simple parts, we defined internal structural parameters of our simple model that described relation between head, torso and legs. The internal structural parameters including (1) represent relation between torso and head (2) and are represent relation between torso and legs. Both vectors that reflex 2 relations of body part including distance and angle.
vθ
tan
Where: v is distance parameter v θ is angle or direction parameter (x1,y1) is a coordinate of previous position (x2,y1) is a coordinate of current position
We also defined three external structural parameters that show movement of each human model part. The external structural parameters including (1) represent a movement of head (2) represent a movement of torso (3) represent a movement of legs. As same as internal structural parameters, all of external structural features are vector that show 2 factors including moving distance and direction.
From internal structural and movement parameters, we can create related parameters that show more meaningful action describing (described in next section).
© The Author(s) 2017. This article is published with open access by the GSTF 44
GSTF Journal on Computing (JoC) Vol.5 No.3, May 2017
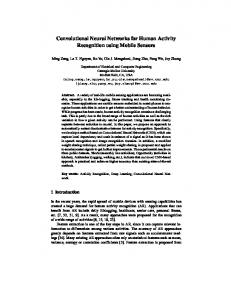
We can organize actions into 2 groups: (1) Static action is the action that has at least one non-movement component. (2) Dynamic action is the action that all components have movement.
D. Action Recognition From experiment, we have discovered that human activities can decomposed into basic 5 actions including: (1) standing, (2) walking (3) sitting (4) bending (5) laying. The action recognition process use internal structural and movement parameters for recognize action. The condition of action recognition process come from the pattern that shown in observing both internal and external parameters when a person act in difference actions (see Figure 4 and Figure 5).
1) Static Action a) Standing features The action is considered as standing when head vector angle and legs vector angle are almost lay on vertical axis so ! will become near zero and ! will become near 180 while all component movements are changing to near zero. !
!
≅ 0,
0
&'/ +,
≅ 180,
* &'() +,
5 &- '(+, -
≥
5 &- '(. +, -
>0
(9)
Relation between actions can be illustrated as diagram below.
(c) Sitting (d) Laying Figure 5 Simple human structure with target actions
© The Author(s) 2017. This article is published with open access by the GSTF 45
GSTF Journal on Computing (JoC) Vol.5 No.3, May 2017
IV. ACTIVITY RECOGNITION
(8) Standing (1)
Walking
The result of action recognition process is an action that can be recognized in every frames so we can get the sequence of action from previous method. In additional, tracking process also gave us movement features.
(9)
We have inspired idea from DNA (Deoxyribonucleic acid: the genetic instructions used in the growth of life) that construct very complex life form from a small number of nucleotides (C, G, A and T). We mimic DNA concept by describing complex thing like human activity with a simple thing like action, movement and some additional features. The action sequence with movement features can be used as input for describing more complex thing like human activity so we proposed human activity recognition method which using those features.
(3) (5)
(2)
Bending (4)
(9) (7)
Laying
Sitting (6) Static Actions
Dynamic Actions
Figure 6 Static Action and Dynamic Action: thick arrows with number represent features that defined above, dash arrows are the N/A action transition.
However, human activities have complex details and depend on many factors so we need to add more features for cover much more possible recognizable activities in future work. We expand movement to few features including: velocity, acceleration, direction and direction variation. We also add action time period, location and object interaction for describe relation between person and surrounding environment.
E. Experimental Result of Action Recognition We test our method on videos that recorded five peoples with different clothes. Each person perform action randomly and continuously. Our testing actions consist of 50 bending, 77 standing, 44 walking, 28 sitting and 11 laying actions.
Features can be grouping into 2 groups including: (1) Major symbol (2) Minor symbol. Major symbol is main features that defined from actions (detailed in Table 2). Minor symbol is additional features that defined from movement features and surrounding environment (detailed in Table 3).
Table 1 Experimental results of action recognition. Actions
Number of
Testing Frames
Detected actions
Table 2 Major symbols with meaning.
Recognition rate
Walking
2243
1809
80.65 %
Sitting
1220
1089
89.26 %
Bending
2250
2123
94.35 %
Standing
2886
2869
99.41 %
Laying
1334
1334
100 %
N/A *
999
999
100 %
Total
10932
9224
93.95%
Symbol a_en a_wk a_st a_bn a_ly a_si a_ex
Meaning A person come in monitoring area Perform walking action Perform standing action Perform bending action Perform laying action Perform sitting action A person get out from monitoring area
Major symbols consist of 7 symbols starting with ‘a_’. It could directly defined from action recognition result (5 basic action) with 2 additional symbols that is enter and exit from interested area.
The table 1, show the result of action recognition. The average recognition rate is 93.95%. The lowest rate is about 80% that is walking. We found that walking can be wrong recognized when both legs are separated. Separated legs can lead to incorrect centroid position that will make incorrect recognition result. Legs separation problem may can solve by improving tracking method. The best case is laying at 100% recognition rate. For N/A actions mean the actions cannot recognized by our defined model, but it can be identified as the non-definition actions showing as dash-lines in the figure 6.
Minor symbols defined from movement features with some presetting of objects position inside interested area. Minor symbols consist of 7 sup-group including: (1) velocity (start with ‘v_’) (2) acceleration (start with ‘ac_’) (3) direction variation (start with ‘dv_’) (4) action time period (start with ‘t_’) (5) movement direction (start with ‘d_’) (6) current location (start with ‘lo_’) (7) object interaction (start with ‘oi_’).
Our action recognition model still not cover the case that camera is perfectly perpendicular to the actions. This case inapplicable for our action models. However, this limitation maybe eliminated by improving action model definition or use multiple camera. Online result in video version can be found at https://www.youtube.com/watch?v=uzRVd1bRZig.
© The Author(s) 2017. This article is published with open access by the GSTF 46
GSTF Journal on Computing (JoC) Vol.5 No.3, May 2017
a) Walk Through the Scene This activity is the case that person walk through interested area without any object interaction and not act in any action but only walk. We used 6 symbols for model this activity.
Table 3 Minor symbols and meaning. Symbol t_l t_m t_h t_un d_n d_s d_w d_un d_nw d_ne d_sw d_se d_e dv_l dv_m dv_h dv_un v_l v_m v_h v_un ac_ l ac_m ac_h ac_un oi_b oi_l oi_no lo_se lo_sp lo_bd lo_fl
Meaning Act with short time period Act with middle time period Act with long time period Unknown time period for first time appearing Moving to the north Moving to the south Moving to the west Unknown movement direction for first time appearing and no movement action Moving to the north-west Moving to the north-east Moving to the south-west Moving to the south-east Moving to the east Low direction variation Medium direction variation High direction variation Unknown direction variation for first time appearing Low velocity Middle velocity High velocity Unknown velocity for first time appearing Low acceleration Middle acceleration High acceleration Unknown acceleration for first time appearing Move object from the original location Leave unknown object in interested area No interaction with any objects in interested area Person rest on seat Person stay near special object (the object that can have interaction with it) Person rest in bed Person stay on floor
3 major symbols including: ‘a_en’ (enter), ‘a_wk’ (walk) and ‘a_ex’ (exit) that used for describe normal walking pass interested area but we need to use additional 3 minor symbols for distinguish the purpose of walking that try to make an observation that does not a normal walking pass. We assume the person who walking inside interested area with making large difference direction may don’t want to walk pass interested area normally so we used high direction variation level (‘dv_h’) for separating a walking for observation from normal walking pass interested area. Relation between symbols in this activity model show below.
Figure 7 Walk through the scene model b) Observation This activity describe the person act walking (‘a_wk’) and/or standing (‘a_st’) inside interested area with an observation purpose. If the person try to make an observation inside the interested area we can assume the direction variation of this case should be high. Other actions (bending, sitting and laying) are not including in this model because we use those action in others activities that may have much more meaning than an observation. The model detail show below.
A. Finite State Machine (FSM) Recognizer FSM is mathematical model that can use to design sequential logic circuit. We can easily design FSM model with rational condition. The FSM model that defined from specific condition would be represented the identity of some specific logic circuit. Our features are presented in term of symbol sequence and we have hypothesis that the human activity can be described with combination of some simple things so we can test our concept by defining the human activity in term of logic circuit that represent some unique activity then test the unknown sequence with our defined FSM activity model. 1) FSM activity modeling We used FSM to define human activity model through rational logic sequence with our defined symbols. We testing our idea with 5 activity models described below.
Figure 8 Observation model
© The Author(s) 2017. This article is published with open access by the GSTF 47
GSTF Journal on Computing (JoC) Vol.5 No.3, May 2017
c) Rest Rest is the activity that person act sitting (‘a_si’) or laying (‘a_ly’) inside interested area. However, we need to use additional 4 minor symbols that is locations: ‘lo_se’ (seat), ‘lo_bd’ (bed), ‘lo_fl’ (floor) and ‘lo_sp’ (special object). Those symbols can use for separating between normal rest and abnormal rest.
Table 4 Experimental result of FSM recognizer True Activity
Recognized Activity
observation
The normal rest can be recognized when person has sitting or laying on appropriate location like seat or bed. The abnormal rest can be recognized when a person take a rest on unusual location like floor or some special object area. The detail of this model show below.
observation
Accuracy (%)
browse
normal rest
walk through
1
abnormal rest browse normal rest walk through Idle
abnormal rest 3 1
5 1 10
2 33.33
75
100
100
100
Table 4 show result of FSM recognizer that quite good accuracy for walk through the scene, normal rest and browse. Those activities have obvious pattern of action changing and related features so we can well defined those activity models. For observation activity, we use high direction variation (‘dv_h’) as acceptance condition. A person can make an observation with short walk distance that lead to occurrence of error. Walking with short distance will give a low direction variation value that lead to incorrect recognition.
Figure 9 Rest model
For abnormal rest activity, incorrect case appear when sitting occur in special object region. That case show an ambiguous activity between rest and browse. Person can sit for rest near special object without a purpose for browse. This situation show that our model still lack of some importance features like face direction.
d) Browse Browse is the activity that person show interesting on some object inside interested area. We describe this activity by using standing (‘a_st’) and sitting (‘a_si’) with object location (‘lo_sp’). Browse is recognized when person act standing or sitting near object that can browse or interact with it. The model show below.
FSM recognizer can recognize activities with good accuracy but still need more features to improve some activities like browse and rest. Online results in video version can be found at: https://www.youtube.com/watch?v=hZB05FoVScs https://www.youtube.com/watch?v=RbbITB8HdtA https://www.youtube.com/watch?v=9WclVK0HuCI https://www.youtube.com/watch?v=jXqMeW9wGQY B. Hidden Markov Model (HMM) Recognizer FSM recognizer suitable for the action that has obvious features pattern. FSM model is very easy to define, simple to understand and consume low computation cost. However, FSM recognizer model quite hard to define complex features pattern so we could improve this limitation point by apply alternative recognition model that can handle complex features pattern.
Figure 10 Browse model e) Idle Idle is the activity that does not match any above activity models.
Our features are presented in term of sequence that similar to state changing so it reasonable to choose well-known method that based-on state changing like HMM for our improvement. HMM is a statistical Markov model that come from training process so we could apply HMM for complex features pattern without manual define like FSM.
2) Experimental Result of Finite State Machine Recognizer Our experiment tested on CAVIAR dataset that consist of 4 videos for walk, 6 videos for browsing and 4 videos for rest. Those video show 23 activities including: 10 walk through the scene, 5 browse, 5 rest and 3 observation. The experimental result show in table 4 below.
© The Author(s) 2017. This article is published with open access by the GSTF 48
GSTF Journal on Computing (JoC) Vol.5 No.3, May 2017
For model training, we use Baum-Welch algorithm for modeling transition and emission probabilities. We setting training process with 2 hidden state. The initial transition matrix and emission matrix values are set to all equal at the first place.
1) Dataset Preparation and Model Training For consecutive improvement and testing of recognition method, we decided to use some of previous activities and symbols set for modeling and testing on HMM recognizer. We choose 2 FSM activity models that is observation activity and walk through the scene activity. Both activities use action sequence and direction variation sequence for describe the activity so we still use the same sequences for HMM model training but we need to re-manipulate it first because HMM model training need single a sequence of symbols. New symbols can be re-manipulated by matching each symbol with other symbols to create the new one.
2) Experimental Result of Hidden Markov Model Recognizer We choose sensitivity and specificity for measure our HMM recognizer performance. Sensitivity and specificity are statistical measure of binary classification test. Sensitivity show the proportion of correct recognition result for the true noisy feature sequences are recognized as it real activity model. Specificity show the proportion of correct recognition result for false noisy features sequences are recognized as it is not an activity that currently considered activity model.
From 7 actions symbols and 4 direction variation symbols, we can create 28 new symbols (come from matching 7 symbols with 4 symbols: 7x4=28). Both action sequence and direction variation sequence are represented as single sequence with new symbols set but still remain the same order as the old one.
In short, sensitivity tell us the rate of HMM recognizer that can recognize “True Sequences” as “True Activity” while specificity tell us the rate that HMM recognizer can recognize “False Sequences” as “False Activity”.
For observation model, we choose 3 sequences that used in FSM recognizer experiment while walk through the scene model we choose 10 sequences from FSM recognizer experiment and 2 new sequences from other CAVIAR dataset. In short, we have 3 sequences for observation model and 12 sequences for walk through the scene model.
For walk through the scene activity, we had ~92% of sensitivity and ~73% of specificity. Most symbols inside this activity sequences are not much difference (low symbol variation). Our HMM recognizer show best result for sensitivity but worst specificity for this model.
We have a small number of ideal sequence so we need to duplicate our ideal sequence with noise addition for more testing accuracy. In additional, we add noise (20%) with rational condition on action sequences. For direction variation sequences, we also add +/- 20% random value from its previous value. The noise addition will give our model more robust to noise in real situation and give more precise experimental result.
For observation activity, sensitivity (~80%) is lower than previous activity but higher specificity (~84%) (see table 6). Symbol variation in this activity sequence has more variation than previous activity. From experimental result, we have the inference that the factor that has effect to HMM recognizer performance is a symbol variation inside sequences, if sequences has low variation of symbol its will gave a high sensitivity but low specificity while higher variation of symbol will give more balance value between sensitivity and specificity. However, average accuracy still over 80%.
After sequence duplication and rational noise addition, we have 1200 sequences for walk through the scene and 300 sequences for observation. Half of noisy feature sequences used for HMM model training and rest of it used as true noisy feature sequences for testing. We also add 1150 false noisy feature sequences for walk through the scene activity model testing and add 1000 false noisy feature sequences for observation activity model testing. The detail about dataset show in table 5 below.
Table 6 Experimental result of HMM recognizer Activities
Table 5 Dataset for HMM recognizer for training and testing Activities
Walk through the scene Observation
[Training] Ideal Noisy feature sequences feature sequences 12
600
3
150
[Testing] [Testing] True False Noisy Noisy feature feature sequences sequences 600 1150
150
Sensitivity
Specificity
Walk through the scene
~ 92%
~ 73%
Observation
~ 80%
~ 84%
C. Graph Similarity Measurement (GSM) Recognizer Our proposed methods can apply with many features that show in table 2 and table 3. In short, features are including: Major symbols (action) and Minor symbols (action time period, velocity, acceleration, direction, direction variation, location, object interaction).
1000
HMM recognizer used some of our defined features with show ability to manage complex features pattern by model training process. This recognizer also show fair recognition
© The Author(s) 2017. This article is published with open access by the GSTF 49
GSTF Journal on Computing (JoC) Vol.5 No.3, May 2017
result. The activities model under HMM can composed with plenty features that may have different priority but HMM recognizer is not including features priority for recognition process.
When we describe action sequence in term of graph model, we can add “act” subscript to V, A and G. For direction variation sequence can be modelled by graph model with “div” subscript. The graph model of action and direction variation can be detailed below.
We have hypothesis that feature priority should affect to recognition rate so we looking for some statistic model which can combined feature priority to its recognition process. When we consider our previous model, HMM is a statistic model that based-on state changing while FSM also based-on state changing too but the changing of FSM is a rational defined. Both FSM and HMM model are composed of nodes and connection among nodes. The component of both model can be considered as graph and its work under its own related theory which show quite good result on its own context so we choose to use another graph theory for testing our hypothesis.
The graph of actions: Gact = (Vact,Aact) Where Vact = {en, st, wk, si, bn, ly, ex} Aact = Vact x Vact The graph of direction variation: Gdiv = (Vdiv,Adiv) Where Vdiv = {l, m, h, un } Adiv = Vdiv x Vdiv
Basically, graph (G) consist of nodes (V) and connecting edges (A). We can represent our symbol as node and represent symbol changing as connecting edge so we can re-define each symbol sequence as independence graph with pair set of node set (symbols) and edge set (symbol changing).
Both Gact and Gdiv are only graph model of individual feature (individual symbol set). From this individual feature graph model, we can use it to construct more complicate model of activity by combining those individual feature graph model into single model. We called this new single model as “Graph Activity Model” (GAM).
From our defined symbols make us have many symbol sets including: action set: {a_en, a_st, a_wk, a_si, a_bn, a_ly, a_ex} action time period set: {t_l, t_m, t_h, t_un} velocity set: {v_l, v_m, v_h, v_un} acceleration set: {ac_l, ac_m, ac_h, ac_un} direction set: {d_n, d_s, d_e, d_w, d_nw, d_ne, d_sw, d_se, d_un }
GAM can be constructed by all features that we defined before. However, we choose to use only features that use in HMM recognizer for GAM because we want consecutive comparison and testing on recognizer improvement. We also use same dataset that used in HMM recognizer experiment so the features that we use are action (Gact ) and direction variation (Gdiv) only.
direction variation set: {dv_l, dv_m, dv_h, dv_un} location set: {lo_se, lo_sp, lo_bd, lo_fl} object interaction set: {oi_b, oi_l, oi_no} Each above set can be considered as independent node set which has its own possible finite symbol changing set (edge set) so we can said that each symbol set has its own graph model.
The Graph Activity Model (GAM) can then be defined as GAM = (Gact, Gdiv)
When we have independence graph model for each feature (symbol set). We can process each feature data separately. We can measure similarity between graph model separately (single feature similarity) while we can combine similarity among graph models (multiple features similarity) with “weight parameter” that mean is we can put the “feature priority” into similarity measurement process. GSM recognizer apply similarity measurement with weight parameter in recognition process. This method show better result that affect from feature priority factor that will show in experimental result.
2) Graph Modeling Graph modeling is the process that construct statistically graph model from symbol sequences. The process consist of 2 sub-process: 1) For node (symbol), the statistic of symbol occurrence is frequency of each symbol appearing in whole sequence. The frequency of appearing for every symbols are counted, ratio calculated and normalized into value interval between 0 and 1 (show as floating number in gray circle with its symbol in figure 11).
1) Definition of Graph Activity Model Graph model consist of nodes (V) and edges (A) where nodes represent individual symbol with frequency of symbol occurrence in sequence and edges represent transition from node to the others with frequency of its transition appeared in sequence. General form of graph model can be written as
2) For edge (transition), the statistic of transition between nodes and others come from the frequency of transition that happen in whole sequence. Those transitions are counted, ratio calculated and normalized into value interval between 0 and 1 like symbol occurrence statistic but transition statistic is done separately on each symbols (show as floating number with arrow come out from each symbol in figure 11).
G = (V,A)
© The Author(s) 2017. This article is published with open access by the GSTF 50
GSTF Journal on Computing (JoC) Vol.5 No.3, May 2017
To illustrate the graph modeling process, we create instance of direction variation sequence that use for direction variation graph modeling.
0 0.75
0
Instance direction variation sequence = un, l, l, l, l, m, m, m, h, h
1
un (0.1)
Direction variation graph: Gdir = (Vdir,Adir) Where Vdir = {l, m, h, un} Adir = Vdir x Vdir
l (0.4)
0
0
0.25
0
0
0
0.25
0
={ (l,l) , (l,m) , (l,h) , (l,un), (m,l) , (m,m) , (m,h) , (m,un), (h,l) , (h,m) , (h,h) , (h,un), (un,l) , (un,m) , (un,h) , (un,un)}
h (0.2) 1
From the instance direction variation sequence, we obtain: Vdir =
0
m (0.3)
0.33 0.67 0
Adir =
Figure 11 Example of graph model (direction variation) Any feature sequences can be modelled by graph modeling process then we can wrap our desire feature graph models to GAM after graph modeling is done. However in this work, we had interested in action sequence and direction variation sequence only so we can simply define GAM as (Gact, Gdiv).
Vdir consist of 4 symbols including: “l”, “m”, “h” and “un” that the number of each symbol is 4, 3, 2 and 1 sequentially. We can calculate ratio of each symbol by divide each symbol number by total symbol number in whole sequence. For this example, ratio of symbol occurrence for “l”, “m”, “h” and “un” are (4/10), (3/10), (2/10) and (1/10) sequentially so we can put those value into row vector (Vdir ) that show above.
3) Target Activities Modeling Target activity is the activity that we want to recognize. We can model the target activity by applying graph modeling with training dataset that contain only target activity sequences. We use the same training dataset (show in table 5) with HMM model training for target activity modeling.
Adir consist of 16 possible symbol transition that come from Vdir x Vdir . The meaning of pair like (l,l) is a transition from symbol “l” to symbol “l” as same as the other pair in Adir . From instance sequence, we have 9 transition including: (un, l), (l,l), (l,l), (l,l), (l,m), (m,m), (m,m), (m,h), (h,h).
We have 2 target activities: 1) walk through the scene model trained from 600 sequences 2) Observation model trained from 150 sequences. All sequences already have noises (around 20%) so our model can dealing with some amount of noise.
We can calculate frequency of symbol transition on each symbol by counting number of each transition that going out from same symbol then divide by all number of transition that going out from that symbol. For instance, we want to calculate frequency of symbol transition of “l”. We must consider the pair that first symbol is “l” like (l,l), (l,l), (l,l), (l,m). Those 4 transitions can be categorized into 2 groups that is 3 transition of (l,l) and 1 transition of (l,m). From those number, we can get frequency values:
After training process, we obtained 2 target activity models in term of GAM that wrapped Gact and Gdiv inside itself which each GAM has its own Gact and Gdiv that come from trained with its own dataset. 4) Activity Recognition by Graph Similarity Measurement (GSM) Method Target activity model (GAM) is a group of graph models that trained from many target activity sequences so those graph models represent statistical pattern of target activity in term of symbol occurrence (node: V) and symbol changing (transition: A). We can recognize any sequences with some target activity by create new graph models with considered sequences then measure similarity between those new graph modes (new GAM) with target activity model.
0.75 or 3/4 for (l,l) transition 0.25 or 1/4 for (l,m) transition 0 or 0/4 for (l,h) transition 0 or 0/4 for (l,un) transition The above frequency values are shown in Adir matrix at first row. We can repeat this process with rest of transitions then all elements of Adir matrix will be filled. From instance, the direction variation sequence with graph modeling process, we can obtain graph below.
© The Author(s) 2017. This article is published with open access by the GSTF 51
GSTF Journal on Computing (JoC) Vol.5 No.3, May 2017
We also put variable weight (a) for combination of V and A in equation (1). However, we set it to 0.5 in this experiment that mean is the weight is equal in combination.
GAM is wrapper of graph models. GAM can contain many features that represent as graph models. We can measure similarity between GAM by measure similarity of sub-graph models inside each GAM then combined each sub-similarity with weight parameters for calculate overall similarity of GAM. The weight can considered as priority of each features. The applying of weight (feature priority) in recognition process is the advantage over the ordinary HMM that would show in GSM experimental result.
Similarity of each graph model that we described above is the similarity of each feature in GAM. We can call similarity of each feature as sub-similarity. After finish sub-similarity calculation, we can combine all sub-similarity into single similarity value that will become a similarity of graph activity model (similarity of GAM).
Measurement similarity between 2 GAMs have limitation that both GAM must contain same features in term of subgraph models. Each feature in both GAM are measured separately. Overall similarity of GAMs will be calculated after sub-similarities are measured.
The similarity of graph activity model can be calculated as below GAM(ta) = (Gta_act, Gta_div) GAM(ca) = (Gca_act, Gca_div) gmsim(ta,ca) = [Gsim(ta,ca)_act, Gsim(ta,ca)_div] gw = [Gact_w, Gdiv_w] (2) GAMsim(ta,ca)_w = gmsim(ta,ca) gwT Where GAM(ta) is model of target activity GAM(ca) is model of considering activity gmsim(ta,ca) is row vector of similarity between GAM(ta) and GAM(ca) gw is row vector of feature weight GAMsim(ta,ca)_w is weighted similarity between GAM(ta) and GAM(ca)
We will describe similarity of each graph model first. The variable of graph model in target activity model will have “ta” subscript while the variable of graph model in considering activity model will have “ca” subscript. The subscript “sim” means that value is similarity and the subscript “_w” means that value is weighted by some weight value. The similarity measurement between two graphs Gta = (Vta, Ata) and Gca = (Vca, Aca), can be calculated as follow. Gsim(ta,ca) Vsim Asim_w Asim
= aVsim + (1-a)Asim_w = (1- |vta – vca|) avgT = vta Asim = (1-|Ata – Aca|) avgT
(1)
The equation (2) show the similarity between target activity model and considering activity model. The result of similarity is a floating number that has interval 0 to 1. The priority of each feature can be setting in gw which can make the difference result when those weights are changed.
Where Gsim(ta,ca) is similarity between graph Gta and Gca Vsim is similarities between node Vta and Vca Asim is similarities between transition Ata and Aca Asim_w is a weighted similarity of Asim vta is a row vector of node of graph in target activity model vca is a row vector of node of graph in considering activity model Ata is a matrix of transition of target activity model Aca is a matrix of transition of considering activity model a is a weight of similarity combination between V and A avg is a row vector that contain n elements, which n is a number of nodes, and each element value is equal to 1/n.
5) Experimental Result of Graph Similarity Measurement Recognizer The experiment is tested with noisy sequences that used in HMM recognizer experiment. The details of test sequences are shown in table 5. GSM recognizer involve features weight in recognition process. This weigh feature is the significant factor that difference from ordinary HMM. In table 7 below, you can see feature weigh column that show weight ratio between action and direction variation (act : div). We vary weight with 3 level on each activity testing.
Similarity of node (Vsim) and edge (Asim_w) are measured separately then combined in last step that show in equation (1). For Vsim, we can calculate similarity directly but Asim_w calculation would have more reasonable calculation if we use symbol occurrence in target activity as weight. We use that weight with 2 reasons: 1) symbol changing (transition) similarity on node that have higher occurrence should have more weight than the lower one 2) The target activity model come from training with large amount of sequences so it should have more reliable than considered model.
For GSM first activity, walk through the scene activity, the best weight is 90:10. Max sensitivity and specificity are around 78% and 80% sequentially. In this activity experiment, we found that while action feature weigh increase, the accuracy also increase too. This relation shows the obvious effect of feature priority that reflex to accuracy. The GSM second activity, observation activity, the best weight is 50:50 which give best sensitivity and specificity are around 80% and 84%. The weight changing trend on second activity is not the same with first activity. While action feature
© The Author(s) 2017. This article is published with open access by the GSTF 52
GSTF Journal on Computing (JoC) Vol.5 No.3, May 2017
activity because its pattern is difficult to design with FSM method. FSM recognizer is also sensitive to noise.
weight increased to 90:10, the accuracy decreased. From experiment, we found that the feature weight has effect to accuracy (in term of sensitivity and specificity) as same as the experiment in previous activity testing. In addition, we found that the appropriate features weight is not always linear and its appropriate value depend on each activity target.
HMM is statistical model which can handle complex activity and also more robust to noise. HMM recognizer use trained model for recognition process so it is no problem with complex pattern of features in any complex activity. HMM show fair recognition result with noisy testing sequences. However, ordinary HMM in not directly support multiple features so we need to re-manipulate data before use those data with HMM. From that limitation, HMM recognizer cannot utilize the feature priority for maximize accuracy rate.
From GSM experiment show that the weight (feature priority) has effect to recognition result accuracy and the relation between weight and accuracy may not always have same changing trend. When compare best GSM recognizer result with HMM recognizer result, we found that the result of GSM is better than HMM on most measurement. The first activity result, GSM has better specificity (+7%) but worst sensitivity (-14%) while the second activity result, GSM show better result on both sensitivity (+9%) and specificity (+4%). From experiment, the GSM recognizer which involve features weight have better result than the HMM recognizer that does not involve features weight.
GSM is statistical model like HMM but it has much more flexibility. GSM also has ability to dealing with complex activity and robust to noisy data. This method allow us to combine feature priority with GSM recognition process. From those reason, GSM can overcome the ordinary HMM by involving feature priority in GSM recognition method and show better accuracy rate on most accuracy measurement (the correct recognition rate is ~84%).
Table 7 Experimental result of GSM recognizer compared to HMM recognizer Activity
Walk through the scene
GSM Feature Weight Sensitivity and act : div Specificity 10:90 50:50 90:10 10:90
Observatio n
50:50 90:10
Sens: ~50% Spec: ~51% Sens: ~73% Spec: ~72% Sens: ~78% Spec: ~80% Sens: ~87% Spec: ~88% Sens: ~89% Spec: ~88% Sens: ~86% Spec: ~85%
ACKNOWLEDGMENT
HMM Sensitivity and Specificity N/A
This research was funded by the Graduate School, Prince of Songkla University. REFERENCES
N/A [1] Sens: ~92% Spec: ~73% N/A [2] Sens: ~80% Spec: ~84% N/A [3]
V. CONCLUSION
[4]
This paper proposed the complete concept of human activity recognition system from basic data (images) to human understandable information (activities) through many submethods that proved fair result on experiments.
[5]
Humans in image sequence are reconstruct to simple structure then tracked through frame by frame. The internal structure and movement features from tracking process can be used for human action recognition which applied model-based technique. An average accuracy for human action recognition is up to 93%.
[6]
[7]
The sequence of recognized action with additional features can be used to recognize more complex things like human activity through various methods. FSM is the first method that used for recognize human activity through rational model defined with sequential logic circuit condition. FSM model is human readable model and easy to design while require low computation cost. However, FSM is not good for complex
[8] [9]
Bakar, S.A.; Ismail, R.; Harish, N.A., “Graph dynamics representation of chemical reactions of a boiler,” Business Engineering and Industrial Applications Colloquium (BEIAC), 2013 IEEE , vol., no., pp.906,910, 79 April 2013. Kyrtsos, C.R.; Baras, J.S., “A graph theoretic mathematical model for Alzheimer's disease: Using a systems biology approach,” Bioinformatics & Bioengineering (BIBE), 2012 IEEE 12th International Conference on , vol., no., pp.472,477, 11-13 Nov. 2012. Ingyu Lee, “Analyzing characteristics of information propagation on social network graphs,” Southeastcon, 2013 Proceedings of IEEE , vol., no., pp.1,4, 4-7 April 2013. Yegnanarayanan, V.; Umamaheswari, G.K.; Lakshmi, R.J., “On a Graph Theory Based Approach for Improved Computer Vision,” 2009 International Conference on Signal Processing Systems , vol., no., pp.660,664, 15-17 May 2009. Schmidt, F.R.; Toppe, E.; Cremers, D., “Efficient planar graph cuts with applications in Computer Vision,” Computer Vision and Pattern Recognition, 2009. CVPR 2009. IEEE Conference on , vol., no., pp.351,356, 20-25 June 2009. Brendel, W.; Todorovic, S., “Learning spatiotemporal graphs of human activities,” Computer Vision (ICCV), 2011 IEEE International Conference on , vol., no., pp.778,785, 6-13 Nov. 2011. Anh-Phuong Ta; Wolf, C.; Lavoué, G.; Baskurt, A., “Recognizing and Localizing Individual Activities through Graph Matching,” Advanced Video and Signal Based Surveillance (AVSS), 2010 Seventh IEEE International Conference on , vol., no., pp.196,203, Aug. 29 2010-Sept. 1 2010. Yang Wang and G. Mori, “Human action recognition by semilatent topic models,” PAMI, vol. 31, no. 10, pp. 1762–1774, 2009. A. Kovashka and K. Grauman, “Learning a hierarchy of discriminative space-time neighborhood features for human action recognition,” in CVPR, pp. 2046–2053, 2010.
© The Author(s) 2017. This article is published with open access by the GSTF 53
GSTF Journal on Computing (JoC) Vol.5 No.3, May 2017
[22] Ping Guo; Zhenjiang Miao, “Multi-person activity recognition through hierarchical and observation decomposed HMM,” Multimedia and Expo (ICME), 2010 IEEE International Conference on , vol., no., pp.143,148, 19-23 July 2010. [23] Uddin, M.Z.; Nguyen Duc Thang; Tae-Seong Kim, “Human Activity Recognition via 3-D joint angle features and Hidden Markov models,” Image Processing (ICIP), 2010 17th IEEE International Conference on , pp.713,716, 26-29 Sept. 2010.
[10] Ju Sun, Xiao Wu, Shuicheng Yan, Loong-Fah Cheong, Tat-Seng Chua, and Jintao Li, “Hierarchical spatio-temporal context modeling for action recognition,” in CVPR, pp. 2004–2011, 2009. [11] I.N. Junejo, E. Dexter, I. Laptev, and P. Pe?rez, “View-independent action recognition from temporal self-similarities,” PAMI, vol. 33, no. 1, pp. 172–185, 2011. [12] A. Fathi and G. Mori, “Action recognition by learning mid-level motion features,” in CVPR, pp. 1–8, 2008. [13] Liu, C., & Yuen, P. C. , “Human action recognition using boosted EigenActions,”. Image and Vision Computing, 28(5), pp. 825–835, 2010. [14] Makris, D., & Ellis, T., “Learning semantic scene models from observing activity in visual surveillance”, in IEEE Transactions on Systems, Man and Cybernetics, 35(3), pp. 397–408. 2005. [15] González, J.; Rowe, D.; Varona, J.; & Roca, F. X. , “Understanding dynamic scenes based on human sequence evaluation”, in Image and Vision Computing, 27(10), pp. 1433–1444, 2009. [16] Jan, T.; Piccardi, M.; Hintz, T., “Detection of suspicious pedestrian behavior using modified probabilistic neural network”, In Proceedings of Image and Vision Computing, pp. 237–241, 2002. [17] Antonio, F. C.; José, C. C.; José, M. R., “Human activity monitoring by local and global finite state machines,” Expert Systems with Applications, Volume 39, Issue 8, pp. 6982-6993, 15 June 2012. [18] L. Rodriguez-Benitez; C. Solana-Cipres; J. Moreno-Garcia; L. JimenezLinares, “Approximate reasoning and finite state machines to the detection of actions in video sequences,” International Journal of Approximate Reasoning, Volume 52, Issue 4, pp. 526-540, June 2011. [19] Chun Yuan; Wei Xu, “Multi-object events recognition from video sequences using extended finite state machine,” Image and Signal Processing (CISP), 2011 4th International Congress on , vol.1, no., pp.202,205, 15-17 Oct. 2011. [20] Trinh, H.; Quanfu Fan; Jiyan Pan; Gabbur, P.; Miyazawa, S.; Pankanti, S., “Detecting human activities in retail surveillance using hierarchical finite state machine,” Acoustics, Speech and Signal Processing (ICASSP), 2011 IEEE International Conference, pp.1337-1340, 22-27 May 2011. [21] Kang Li; Yun Fu, “ARMA-HMM: A new approach for early recognition of human activity,” Pattern Recognition (ICPR), 2012 21st International Conference on , vol., no., pp.1779,1782, 11-15 Nov. 2012.
AUTHORS’ PROFILE Nattapon Noorit is currently the doctorate candidate at faculty of engineering, Prince of Songkhla University (PSU), Hatyai, Thailand. He received the bachelor and master degrees in computer engineering from PSU, Thailand. His research interests include computer vision, image processing and pattern recognition.
Asst. Prof. Dr. Nikom Suvonvorn is currently a lecturer at Department of Computer Engineering (CoE), Prince of Songkla University (PSU), Hatyai, Thailand. In 2006, He received a PhD in computer science from l’Université de Paris Sud (XI), Orsay, France. In 2003, He obtained a DEA (Diplôme d’Etudes Approfondies), Master’s degree on Electronic System and Information Processing (SETI), from l’Institute d’Electronique Fondamontale (IEF) at l’Université de Paris Sud (XI). In the same year, He also got the Master’s Degree on Computer Engineering from Ecole Supérieure de Mécanique et d’Electricité (ESME)-Sudria engineering school at Paris.
© The Author(s) 2017. This article is published with open access by the GSTF 54