May 11, 2017 - on skeleton data extracted from a depth camera is presented. ... Its goal is to automatically detect and
International Journal of
Environmental Research and Public Health Article
Multilevel Safety Climate and Safety Performance in the Construction Industry: Development and Validation of a Top-Down Mechanism Ran Gao *, Albert P.C. Chan, Wahyudi P. Utama and Hafiz Zahoor Department of Building and Real Estate, The Hong Kong Polytechnic University, Hung Hom, Kowloon, Hong Kong 999077, China;
[email protected] (A.P.C.C.);
[email protected] (W.P.U.);
[email protected] (H.Z.) * Correspondence:
[email protected]; Tel.: +852-5168-7254; Fax: +852-2764-5131 Academic Editor: Paul B. Tchounwou Received: 22 September 2016; Accepted: 3 November 2016; Published: 8 November 2016
Abstract: The character of construction projects exposes front-line workers to dangers and accidents. Safety climate has been confirmed to be a predictor of safety performance in the construction industry. This study aims to explore the underlying mechanisms of the relationship between multilevel safety climate and safety performance. An integrated model was developed to study how particular safety climate factors of one level affect those of other levels, and then affect safety performance from the top down. A questionnaire survey was administered on six construction sites in Vietnam. A total of 1030 valid questionnaires were collected from this survey. Approximately half of the data were used to conduct exploratory factor analysis (EFA) and the remaining data were submitted to structural equation modeling (SEM). Top management commitment (TMC) and supervisors’ expectation (SE) were identified as factors to represent organizational safety climate (OSC) and supervisor safety climate (SSC), respectively, and coworkers’ caring and communication (CCC) and coworkers’ role models (CRM) were identified as factors to denote coworker safety climate (CSC). SEM results show that OSC factor is positively related to SSC factor and CSC factors significantly. SSC factor could partially mediate the relationship between OSC factor and CSC factors, as well as the relationship between OSC factor and safety performance. CSC factors partially mediate the relationship between OSC factor and safety performance, and the relationship between SSC factor and safety performance. The findings imply that a positive safety culture should be established both at the organizational level and the group level. Efforts from all top management, supervisors, and coworkers should be provided to improve safety performance in the construction industry. Keywords: construction safety; safety climate; safety performance; structural equation modeling
1. Introduction The construction industry is recognized as one of the most dangerous industries in the world [1]. The complexity of the construction procedures and the temporary character of the projects exposes front-line workers to dangers and accidents, and makes safety a rather complex issue [2]. At a rough estimate, the construction industry accounts for 30%–40% of fatal injuries, although it employs only 7% of the world’s workforce [3]. A large aggregation of studies have focused on construction safety and contributed to the improvement of safety performance [4]. A literature review summarized four key topics about construction safety over the last three decades, which are causes of construction accidents, the influence of management on accidents and accident prevention, safety in design, and safety climate and safety culture [2]. Safety climate is derived from organizational climate, and describes workers’ perceptions of the value of safety in their work environment [5]. Originally defined by Zohar in 1980, safety Int. J. Environ. Res. Public Health 2016, 13, 1100; doi:10.3390/ijerph13111100
www.mdpi.com/journal/ijerph
Int. J. Environ. Res. Public Health 2016, 13, 1100 Int. J. Environ. Res. Public Health 2016, 13, 1100
2 of 14 2 of 14
climateas is derived from andthe describes workers’ofperceptions of the climateSafety is described “a unified setorganizational of cognitionsclimate, regarding safety aspects the organization”, value of safetyemployees’ in their work environment [5]. Originally defined by Zohar in 1980, safety climate is which “reflects shared perceptions about the relative importance of safe conduct in their described as “a unified set of cognitions regarding the safety aspects of the organization ”, which occupational behavior”. Safety climate has been confirmed to be a predictor of safety performance employees’ shared perceptions the relative importance of safe conduct in climate their in “reflects substantial studies [6–8]. Desai et al. [9]about identified a positive relationship between safety occupational behavior”. Safety climaterelationship has been confirmed to be a predictor safetyclimate performance in and minor accidents, and no significant was discovered betweenofsafety and major substantial studies [6–8]. Desai et al. [9] identified a positive relationship between safety climate and accidents. Clarke [6] conducted a meta-analysis with 32 published papers and identified a positive minor accidents, and no significant relationship was discovered between safety climate and major relationship between safety climate and safety behaviors. In the construction industry, insufficient accidents. Clarke [6] conducted a meta-analysis with 32 published papers and identified a positive safety precautions and weak safety climate are also deemed to be major causes of the high industrial relationship between safety climate and safety behaviors. In the construction industry, insufficient accident rates and unsafe behaviors [7,10]. The complicated characteristics of construction provide safety precautions and weak safety climate are also deemed to be major causes of the high industrial rather complex conditions for the consideration of safety climate and pose challenges to safety climate accident rates and unsafe behaviors [7,10]. The complicated characteristics of construction provide research within this particular industry [11]. rather complex conditions for the consideration of safety climate and pose challenges to safety climate Melia within et al. [12] up safety climate research thissplit particular industry [11].in the construction sector into multilevel variables (i.e., the organizational safety response, the supervisors’ safety response, safety response, Melia et al. [12] split up safety climate in the construction sector the intocoworkers’ multilev el variables (i.e., and the workers’ safety response), and examined a psychosocial sequence of relationships among the organizational safety response, the supervisors’ safety response, the coworkers’ safety response, these responses with regression to regression the structural andsafety the workers’ safety response), and analysis. examined Compared a psychosocial sequence ofanalysis, relationships among equation modeling (SEM)with method could analyze data with consideration of their structural complexity these safety responses regression analysis. Compared to regression analysis, the structural and permission of study on relationships each factors [13]. on a similar equation modeling (SEM) method couldamong analyze data withconcurrently consideration of Based their structur al framework toand the permission study of Melia et al.on[12], Brondino among et al. [13] used the concurrently SEM method[13]. to test a model complexity of study relationships each factors Based on similar framework to the study of Melia et and al. [12], Brondino al. [13]and usedsafety the SEM method to test onathe relationships between organizational group safetyet climate performance in the a model on industry. the relationships between organizational and group safety climate and safety manufacturing performance in the manufacturing industry. Similar to Brondino et al. [13], the current study seeks to explore the underlying mechanisms of Similar to Brondino et al. [13], current study seeks to explore the underlying mechanisms of the relationship between multilevelthe safety climate and safety performance using the SEM method, between multilevel safetyfrom climate and safety using the SEM method, butthe inrelationship the construction industry. Distinct Brondino et al.performance [13], different safety climate factors but in the construction industry. Distinct from Brondino et al. [13], different safety climate factors even from the same level are considered to be different constructs in the current study. To be specific, even from the to same levelhow are considered to be different in the current study. specific, this paper aims study particular safety climate constructs factors of one level affect thoseTo ofbe other levels, this paper aims to study how particular safety climate factors of one level affect those of other levels, and then affect safety performance from the top down. A model unveiling underlying mechanisms and then affect safety performance from the top down. A model unveiling underlying mechanisms of the relationship between multilevel safety climate and safety performance would be useful for of the relationship between multilevel safety climate and safety performance would be useful for safety professionals to evaluate, supervise, and improve safety performance in construction projects. safety professionals to evaluate, supervise, and improve safety performance in construction projects. This model supposes sequent effects of safety climate factors of the organizational level on safety This model supposes sequent effects of safety climate factors of the organizational level on safety performance through safety climate factors at the supervisors’ and coworkers’ level. The following performance through safety climate factors at the supervisors’ and coworkers’ level. The following hypotheses were proposed Meliaetetal. al.[12] [12]and andBrondino Brondino [13], and hypotheses were proposedaccording accordingto tothe theresearch research of of Melia et et al.al. [13], and thethe proposed relationships 1. proposed relationshipsamong amongfactors factorsare areshown shown in in Figure Figure 1. H1: Organizational safety climate (OSC) factors are positively related to supervisor safetysafety climate H1: Organizational safety climate (OSC) factors are positively related to supervisor (SSC) factors and coworker safety climate (CSC) factors. climate (SSC) factors and coworker safety climate (CSC) factors. H2: SSC OSCfactors factorsand andCSC CSCfactors. factors. H2: SSCfactors factorsmediate mediatethe therelationship relationship between between OSC H3: SSC OSCfactors factorsand andsafety safetyperformance performance (SP). H3: SSCfactors factorsmediate mediatethe therelationship relationship between between OSC (SP). H4: CSC OSCfactors factorsand andSP. SP. H4: CSCfactors factorsmediate mediatethe therelationship relationship between OSC H5: CSCfactors factorsmediate mediatethe therelationship relationship between between SSC H5: CSC SSCfactors factorsand andSP. SP.
Figure Re se arch modeand l andhypotheses. hypothe se s.OSC: OSC:organizational organizationalsafety safe tyclimate, climate ,SSC: SSC:supervisor supervisorsafety Figure 1. 1.Research model safety climate , CSC: coworke r safety climate, SP: safety pe rformance. climate, CSC: coworker safety climate, SP: safety performance.
Int. J. Environ. Res. Public Health 2016, 13, 1100
3 of 14
2. Literature Review 2.1. Safety Climate in Construction Among studies on safety climate, many scholars have conducted factor analyses to identify its distinct structures and dimensions [1,11,14,15]. In the construction industry, the number of safety climate dimensions varies from two [15] to fifteen [14]. Management’s commitment to safety, workers’ involvement in safety, and safety rules and procedures are the three most frequent safety climate factors in the construction industry [16]. Many studies have considered safety climate as a multilevel concept [12,13,17–19]. Zohar himself extended the original definition of safety climate in a longitudinal manner, by adding a group-level safety climate to the previous organizational safety climate [18]. The basic proposition of this development was that regulations were formulated at the organization level and implemented at the group level, and thus, safety climate could be formed from top management’s policy actions as well as front-line supervisors’ practical actions. In the construction industry, employees work in small groups and report to an appointed supervisor. Communication with supervisors represents to workers the real priority of safety through the practices supervisors implement regarding company safety regulations and the resolution of conflicts between safety and productivity [11], and the supervisor’s safety climate is thus formed. Lingard et al. [20] confirmed the existence of supervisor’s safety climate within the road construction and maintenance organization, and discovered that supervisory personnel, such as foremen and gangers, played a major role in affecting safety performance in workgroups. Besides supervisor’s safety climate, another potential dimension of group-level safety climate is coworkers’ safety climate, which is the extent to which workers care about their coworkers’ safety [12,13,21]. Coworkers give information, provide care, and act as role models in the work environment. Their behaviors influence workers’ task performance beyond supervisors’ behaviors [13]. Compared to managers and supervisors, coworkers are closer and larger in number. Workers tend to develop clear safety beliefs through exchanges with coworkers. 2.2. Safety Performance Safety performance mainly includes two categories: safety outcomes and safety behaviors [22]. Safety outcomes provide historical information on bottom-line indicators of safety performance, which is traditionally measured by statistical data such as accidents and injuries [23,24]. Safety performance is also described as the actual safety behaviors that individuals performed at work, and is classified into safety compliance and safety participation [5,25]. Safety compliance describes safety-related behaviors required by the organization to be carried out by individuals to keep the workplace safe. Safety participation depicts voluntary safety-related behaviors that may not directly work on personal safety but help to develop an organizational context to support safety [5,26,27]. 2.3. Relationship between Safety Climate and Safety Performance The relationship between safety climate and safety performance has been learnt in substantial studies [12,13,26,28–30]. Morrow et al. [31] explored the relationship between different facets of safety climate and safety behaviors. Three facets including work-safety tension, management, and coworkers were considered, and the former one was found to be most strongly related to unsafe behaviors when compared with the latter two. Siu et al. [28] investigated the relations among safety climate, psychological strains, and accident rates, and found that psychological strains is a mediator of the relationship between safety climate and accident rates. Huang et al. [29] discovered that employee safety control was a mediator of the relationship between safety climate and self-reported injury. Griffin and Neal [26] identified that safety knowledge and safety motivation mediated the link between safety climate and safety performance (i.e., safety compliance and safety participation). Guo et al. [30] extended Griffin and Neal’s research and tested an integrative model in the construction industry to understand the mechanisms that explain how particular safety climate factors affect workers’ safety performance through individual factors (i.e., safety knowledge and safety motivation).
Int. J. Environ. Res. Public Health 2016, 13, 1100
4 of 14
3. Research Methods 3.1. Questionnaire Design To test the proposed hypotheses, a questionnaire survey approach was applied for data collection. The questionnaire was composed of three parts. The first part consisted of 19 questions asking the personal particulars of the participants. The second part was a 38-item multi-level safety climate scale based on a similar structure to Melia et al. [12] and Brondino et al. [13]. To conduct data analysis of different levels separately, as well as to carry out an integrated study of the relationships among them, the workers’ perceptions of safety climate from various levels including top management level, supervisor level and coworker level were measured in this study. The safety climate related to top management was evaluated with the organizational safety climate scale developed by Zohar and Luria [19] with 16 items which focus on the attitudes and activities of top management regarding safety management. For example, a sample item was “Top management is strict about working safely when work falls behind schedule”. The safety climate related to supervisor was measured with a 10-item scale derived from Zohar [18]. For example, a sample item was “My supervisor says a good word whenever he sees a job done according to the safety rules”. The safety climate related to coworkers was measured with a 12-item safety climate scale revised from Brondino et al. [13]. For example, a sample item in this scale was “My coworkers emphasize safety procedures when we are working under pressure”. The third part of the questionnaire was the safety performance scale. Safety performance in this study was considered to be the actual safety behaviors that individuals perform at work. A six-item safety performance scale developed from Neal and Griffin [25] was employed to measure these actual safety behaviors. Within the six items, three items were related to safety compliance, which were “I use all the necessary safety equipment to do my job”, “I use the correct safety procedures for carrying out my job”, and “I ensure the highest levels of safety when I carry out my job”. The other three items were related to safety participation, which were “I promote the safety program within the organization”, “I put in extra effort to improve the safety of the workplace”, and “I voluntarily carry out tasks or activities that help to improve workplace safety”. A five-point Likert scale was adopted to measure the response to each item from 1 to 5, in terms of strongly disagree, disagree, neutral, agree, and strongly agree, respectively. The questionnaire was initially designed in English. Chinese versions and Vietnamese versions were obtained through translation. To guarantee semantic reliability, non-English versions had subsequently been translated back into English by a different translator team. Ambiguous translations were discussed and revised by the two translator teams. A panel of experts, comprising seven scholars and nine practitioners, were invited to make some suggestions to assure that the research content were exactly expressed and in line with practice situations. Several minor revisions were consequently made to the expression of the questions and the structure of the questionnaire. 3.2. Participants and Procedure The data were collected from six construction sites in Vietnam in May 2015. All these projects were contracted by Chinese international contractors. To guarantee accurate responses from front-line workers and to encourage widespread participation from the investigated projects, the researchers went to the aforesaid construction sites and coordinated with the workers face-to-face with the help of interpreters. The research aims and objectives were conveyed to the participants clearly. The workers were assured that their participation was voluntary, all replies were anonymous and confidential, and no information would be disclosed to their supervisors or coworkers. 3.3. Data Analysis In the current study, the exploratory factor analysis (EFA) was used to identify the potential multilevel safety climate factors. These factors were further verified and relationships among these factors were investigated by the SEM. Data were randomly split in two parts in the SPSS 17.0 (IBM,
Int. J. Environ. Res. Public Health 2016, 13, 1100
5 of 14
New York, NY, USA) for Windows software package. Approximately half of the data were used to conduct EFA in the SPSS 17.0 for Windows software package and the remaining data were submitted to SEM in the Analysis of Moment Structures (AMOS) version 17.0 (IBM, New York, NY, USA). 3.3.1. Exploratory Factor Analysis EFA and confirmatory factor analysis (CFA) are two discrete kinds of factor analysis. The originally defined factor analysis has now come to be called EFA. It is a powerful method to reduce variable complexity to greater simplicity by summarizing a larger quantity of variables to a smaller quantity of factors [32]. EFA allows the analysis to be concentrated on the principal components in order to acquire knowledge about dynamics of their relationships. In the current study, EFA was used to identify the factor structure of safety climate firstly. With understanding of the factor structure, SEM was then conducted in order to investigate the relationship among different safety climate factors and safety performance. Before EFA, both the Kaiser-Mayer-Olkin (KMO) measure of sampling accuracy and Barlett’s test of sphericity were conducted to evaluate the appropriateness of using the EFA method in this study. As a frequently-used extraction method whenever EFA are conducted, principal component analysis (PCA) was selected for data extraction in the current research. In this method, variables are put together according to their mutual correlations and then combined to a certain number of components [33]. To find out the number of factors that should be extracted and interpreted, parallel analysis was conducted in addition to Kaiser’s criterion and scree test. According to Pallant [34], parallel analysis is more accurate for determining the number of factors to be interpreted as the other two methods have a tendency to overrate the number of factors. The Oblimin oblique rotation method was used to interpret latent variables underlying a factor due to the potential correlations among these factors. The threshold of 0.50 was considered to be the minimum factor loading when determining an item to load on a latent factor [35]. 3.3.2. Structural Equation Modelling SEM was conducted to test the potential theoretical relationships among different safety climate factors and safety performance in the current study. SEM usually contains a measurement model that defines latent variables with several observed variables, and a structural model that studies the relationships between latent variables. The SEM method was chosen because it could estimate the theoretical relationships among latent variables more accurately by considering measurement error, and examine several interdependent multiple regressions concurrently. In the current study, safety climate and safety performance factors are latent variables that could not be directly observed. With SEM, a proposed measurement model composed of several safety climate and safety performance factors was examined, and a hypothetical structural model considering their relationships was developed and examined. AMOS version 17.0 was used in the current study. For model estimation, maximum likelihood method was applied. The SEM model was tested in two stages of verifying the measurement model and verifying the structural model. Internal validity and reliability of the model was assessed with calculating average variance extracted (AVE) and construct reliability (CR). A value over 0.50 of AVE and a value over 0.70 of CR suggest good validity and reliability, respectively [36]. Because of the model complexity, internal validity and reliability was firstly accessed within every construct, and then in an aggregated measurement model [37]. For model evaluation, a number of frequently-used fit indices were adopted in the current study, including the ratio of model chi-square to the degrees of freedom (χ2 /df), root mean square error of approximation (RMSEA), goodness-of-fit (GFI), adjusted goodness-of-fit (AGFI), Tucker–Lewis index (TLI) and comparative fit index (CFI). A χ2 /df value less than 5 indicates an acceptable model fit to the data. RMESA values of less than 0.05 indicate a good fit, whereas values ranging from 0.05 to 0.08 are acceptable. GFI, AGFI, TLF, and CFI all range from 0 to 1. Values over 0.80 are considered to be acceptable model fit to the data. Mediations were also considered in SEM. The bootstrap method was selected in AMOS version 17.0. The mediation effect exists if the
Int. J. Environ. Res. Public Health 2016, 13, 1100
6 of 14
bias-corrected interval for the indirect effect does not include zero. If the bias-corrected interval for the direct effect includes zero, full mediation effect exists; if not, partial mediation effect exists [38]. 4. Results 4.1. The Samples A total of 1490 questionnaires were distributed; 1120 completed questionnaires were returned for a response rate of 75.2%. After deleting the extreme and missing values, 1030 questionnaires were used for analysis. Overall, approximately 20.4% of the participants were Chinese while the others were Vietnamese (79.6%). Approximately 83.7% of the participants were male and 71.0% were married. The largest group among the participants in terms of age was individuals from 21 to 30 years old (62.2%), while the most common number of family members supported was two (26.0%). Most of the participants had a junior middle school level (31.4%). The range of 1 to 5 years was generally common (64.0%) for the participants’ job tenure. Approximately 39.0% of the participants had a smoking habit, while 42.5% had a drinking habit. 4.2. Exploratory Factor Analysis Around half of the data were used to conduct EFA in the SPSS 17.0 for Windows software package. For EFA on safety climate, the results showed that Kaiser-Mayer-Olkin (KMO) measure of sampling accuracy was 0.891 and Barlett’s test of sphericity was significant (p < 0.001), indicating that the data were appropriate for factor analysis [39]. The 38 safety climate items were subjected to a factor analysis with PCA extraction and Oblimin rotation method. This yielded an interpretable result of four factors using the parallel analysis and explained 56.93% of variance. Factors 1, 2, 3, and 4 explained 23.19%, 16.09%, 10.84% and 6.81% of the variance, respectively. As shown in Table 1, the final result includes 27 items with factor loadings above 0.50 on one of these factors. The factor loadings of each item and the percentage of variance explained by each factor are also shown in this table. The first factor was interpreted as top management commitment (TMC) and it consisted of 10 items from OSC indicating the attitude to safety of top management level in the organization. The explanation of the second factor was coworkers’ caring and communication (CCC) and it included eight items from CSC which reflect coworkers’ opinion on communicating with other workers and their willingness to help other workers. The third factor was explained as coworkers’ role models (CRM) since it comprised four items from CSC indicating coworkers’ safety behaviors that could provide a fine example to other workers. The interpretation of the fourth factor was supervisors’ expectation (SE) and it contained five items from SSC focusing on supervisor’s attitude to construction safety. All the factors included more than four items, and the Cronbach’s alpha coefficients for these four factors were 0.961, 0.887, 0.897, and 0.890, respectively, which were all above 0.70 and considered to be acceptable [40,41]. In summary, TMC and SE were identified to be factors that represent OSC and SSC, respectively, while CCC and CRM were identified as factors to denote CSC. That is to say, OSC and SSC were explained by one factor each, while CSC was explained by two factors. Table 1. Exploratory factor analysis of safety climate. Construct
Code
Factor Loading
Cronbach’s Alpha
Variance Explained (%)
Top Management Commitment (TMC)
OSC2 OSC1 OSC6 OSC15 OSC12 OSC7 OSC16 OSC3 OSC8 OSC5
0.886 0.873 0.872 0.866 0.853 0.852 0.850 0.846 0.809 0.807
0.961
23.19
Int. J. Environ. Res. Public Health 2016, 13, 1100 Int. J. Environ. Res. Public Health 2016, 13, 1100
7 of 14 7 of 14
CSC11 0.780 CSC6 Table0.749 1. Cont. CSC7 0.745 Coworke rs’ Caring and CSC9 0.745 Construct Code Factor Loading Cronbach’s Alpha Variance Explained (%) Communication (CCC) CSC4 0.728 CSC10 0.795 CSC11 0.780 CSC5 0.726 CSC6 0.749 CSC3 0.662 Coworkers’ Caring and CSC7 0.745 0.887 16.09 CSC8 0.834 Communication (CCC) CSC9 0.745 0.728 CSC2 0.830 Coworke rs’ Role Mode ls CSC4 0.897 10.84 CSC5 0.726 (CRM) CSC12 0.814 CSC3 0.662 CSC1 0.699 CSC8 0.834 SSC9 0.874 CSC2 0.830 Coworkers’ Role Models (CRM) 0.897 10.84 SSC10 0.869 CSC12 0.814 Supe rvisors’ Expe ctation CSC1 0.699 SSC6 0.799 0.890 6.81 (SE) SSC9 0.874 SSC8 0.786 SSC10 0.869 SSC7 0.701 Supervisors’ Expectation (SE) SSC6 0.799 0.890 6.81 OSC: organizational safe ty climate , CSC: coworke r safe ty climate , SSC: supe rvisor safe ty climate . SSC8 0.786 SSC7
0.701
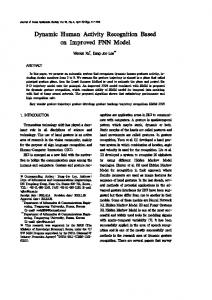
OSC: safety climate, coworker safety climate, SSC: supervisor(KMO) safety climate. For EFA on organizational safety performance, the CSC: results showed Kaiser -Mayer-Olkin measureofsampling accuracy was 0.860 and Barlett ’s test of sphericity was significant (p < 0.001). The safety performance For EFA onalso safety performance, resultswith showed Kaiser-Mayer-Olkin (KMO) measure of (SP) items were subjected to a factorthe analysis PCA extraction and Oblimin rotation method. sampling accuracy was 0.860result and Barlett’s test and of sphericity significant (p < As 0.001). The safety This yielded an interpretable of one factor explainedwas 56.04% of variance. shown in Table 2, performance items six were alsowith subjected to a factor analysis with PCA extraction and Oblimin the final result(SP) includes items factor loadings above 0.50 on this factor. rotation method. This yielded interpretable result of one factor and explained of variance. As CCC and CRM are two an separate safety climate factors on the CSC level, the56.04% proposed research As shown in Table 2, the be final resultdeveloped includes six model in Figure 1 could further asitems Figurewith 2. factor loadings above 0.50 on this factor. As CCC and CRM are two separate safety climate factors on the CSC level, the proposed research Table 2. Exploratory factor of safe ty pe rformance . model in Figure 1 could be further developed asanalysis Figure 2.
Construct Code Factor Loading Variance Explained (%) Table 2. Exploratory factor analysis of safety performance. SPart.1 0.777 Construct
Code
SComp.3
SPart.1 SComp.2 SComp.3 Safe ty Pe rformance (SP) SComp.2 SComp.1 Safety Performance (SP) SComp.1 SPart.3 SPart.3 SPart.2
SPart.2
Factor Loading
0.777
Variance Explained (%)
0.777
0.759 0.777 0.759 0.758
0.758 0.743 0.743 0.673
56.04 56.04
0.673
Figure 2. Further development of research model and hypotheses. TMC: top management Figure 2. Furthe r de ve lopme nt of re se arch mode l and hypothe se s. TMC: top manage me nt commitment, SE: supervisors’ expectations, CRM: coworkers’ role models, CCC: coworkers’ caring commitme nt, SE: supe rvisors’ e xpe ctations, CRM: coworke rs’ role mode ls, CCC: coworke rs’ caring and communication, SP: safety performance. and communication, SP: safety pe rformance.
Int. J. Environ. Res. Public Health 2016, 13, 1100
8 of 14
4.3. Measurement Model Assessment A proposed measurement model composed of TMC, SE, CCC, CRM, and SP was examined in the current study. The remaining half of the data was submitted to SEM in the Analysis of Moment Structures (AMOS) version 17.0. Table 3 shows the empirically tested results of the multilevel safety climate and safety performance measurement model with standardized parameter estimates. The analysis retained items with factor loadings larger than 0.50 [36]. OSC1, OSC6, OSC7, and OSC15 were thus removed from the factor of TMC. CSC7 and CSC3 were removed from the factor of CCC, and CSC1 was removed from the factor of CRM. SPart. 2 and SPart. 3 were removed from the factor of SP. The results showed that all values of CR for the four constructs were more than 0.70, thereby advising a satisfactory level of construct reliability. The values of AVE were all around or higher than 0.50, suggesting a satisfactory level of construct validity [36]. According to Table 4, the selected model fit indices were all at the acceptable level for the measurement model (χ2 /df = 4.091, GFI = 0.879, AGFI = 0.849, RMSEA = 0.073, TLI = 0.898, and CFI = 0.911). All paths from the observed variables to the latent factors were significant. Table 3. Measurement model evaluation. Construct
Code
Loading
AVE (Average Variance Extracted)
Composite Reliability
TMC (OSC)
OSC2 OSC3 OSC5 OSC8 OSC12 OSC16
0.743 0.873 0.863 0.868 0.845 0.836
0.704
0.934
SE (SSC)
SSC6 SSC7 SSC8 SSC9 SSC10
0.651 0.699 0.805 0.877 0.919
0.635
0.895
CCC (CSC-Factor 1)
CSC4 CSC5 CSC6 CSC9 CSC10 CSC11
0.696 0.709 0.708 0.679 0.736 0.729
0.504
0.859
CRM (CSC-Factor 2)
CSC2 CSC8 CSC12
0.793 0.602 0.765
0.525
0.766
SP
SComp. 1 SComp. 2 SComp. 3 SPart. 1
0.677 0.727 0.766 0.627
0.492
0.794
Table 4. Goodness-of-fit indexes for measurement and structural models. Model
χ2
χ2 /DF
GFI
AGFI
RMSEA
TLI
CFI
Measurement Structural
989.918 1116.697
4.091 4.595
0.879 0.864
0.849 0.833
0.073 0.079
0.898 0.882
0.911 0.896
DF: degrees of freedom, GFI: goodness-of-fit, AGFI: adjusted goodness-of-fit, RMSEA: root mean square error of approximation, TLI: Tucker–Lewis index, CFI: comparative fit index.
4.4. Structural Model Assessment According to Table 4, the model fit indices of the whole structural model were at the acceptable level (χ2 /df = 4.595, GFI = 0.864, AGFI = 0.833, RMSEA = 0.079, TLI = 0.882, and CFI = 0.896).
Int. J. Environ. Res. Public Health 2016, 13, 1100 Int. J. Environ. Res. Public Health 2016, 13, 1100
9 of 14 9 of 14
The testing results of themodel structural model were shown3.inNumbers Figure 3. on Numbers on the arrows represent results of the structural were shown in Figure the arrows represent the path the path coefficients, which indicate the strength of the relationships among latent variables. coefficients, which indicate the strength of the relationships among latent variables. The OSC factor was related to SSC factor andand CSCCSC factors. H1 was H1: The wasconfirmed confirmedtotobebepositively positively related to SSC factor factors. H1 supported. TMC had a strong statistically significant positive relationship with SE (β = 0.27, p < 0.001). was supported. TMC had a strong statistically significant positive relationship with SE (β = 0.27, p < In addition, TMC was confirmed to havetoahave significantly positive relationship with thewith twothe CSC factors: 0.001). In addition, TMC was confirmed a significantly positive relationship two CSC CCC (β CCC = 0.30, 0.001) CRM = 0.15, 0.01). factors: (βp=