Human Detection and Ranging at Long Range and Through Light Foliage Using a W-Band Noise Radar With an Embedded Tone Kyle A. Gallagher and Ram M. Narayanan The Pennsylvania State University, University Park, PA 16802, USA ABSTRACT This paper describes a millimeter-wave (mm-wave) radar system that has been used to range humans concealed in light foliage at 30 meters and range exposed humans at distances up to 213 meters. Human micro-Doppler is also detected through light foliage at 30 meters and up to 90 meters when no foliage is present. This is done by utilizing a composite signal consisting of two waveforms: a wide-band noise waveform and a single tone. These waveforms are summed together and transmitted simultaneously. Matched filtering of the received and transmitted noise signals is performed to range targets with high resolution, while the received single tone signal is used for Doppler analysis. The Doppler measurements are used to distinguish between different human movements using characteristic micro-Doppler signals. Using hardware and software filters allows for simultaneous processing of both the noise and Doppler waveforms. Our measurements establish the mm-wave system’s ability to range humans up to 213 meters and distinguish between different human movements at 90 meters. The radar system was also tested through light foliage. In this paper, we present results on human target ranging and Doppler characterization of human movements. Keywords: Noise radar, Millimeter-wave radar, Multifunctional waveform, Human detection
1. INTRODUCTION The ability to detect human targets and identify their movements at long range and through light foliage is increasingly important in today’s world. To address this need, a covert multi−modal millimeter wave radar system has been developed at The Pennsylvania State University’s Radar and Communications Laboratory. This radar system utilizes a composite waveform consisting of a noise signal used for ranging targets and a single tone for identifying target movements. The details of the system design for the radar system are explained in Reference[1]. Utilizing noise and noise like waveforms for radar systems has been theorized since the 1950s and Cooper2,3 began building some of the first noise radars systems in the mid to late 1960s. After this, noise waveforms began gaining popularity for many reasons. First, noise waveforms are relatively easy and inexpensive to generate compared with other wide band signals. Noise waveforms also exhibit high resistance to jamming and have a low probability of intercept due to their featureless nature.4 These are very desirable traits for applications in hostile environments. Radar systems using noise waveforms can also be used in urban scenarios where interference with other radar and communication systems may be an issue. This is because the total power transmitted is spread over a wide range of frequencies causing the power spectral density at any given frequency to be low. Traditional wide band radar systems do not possess this attribute because of the deterministic nature of their waveforms. The fact that noise radar systems transmit low power at any given frequency, coupled with the fact that external background noise in uncorrelated, allows multiple different noise radar systems to operate over the same frequency band at the same time with little interference. Embedding a single tone within the noise waveform allows one to monitor the human movements by observing the micro-Doppler frequency characteristics of the reflected signal. Over the past 15 years, researchers Further author information: (Send correspondence to R.M.N.) R.M.N.: E-mail:
[email protected], Telephone: 814 863 2602 K.A.G.: E-mail:
[email protected], Telephone: 301 742 9926
Radar Sensor Technology XVII, edited by Kenneth I. Ranney, Armin Doerry, Proc. of SPIE Vol. 8714, 871402 © 2013 SPIE · CCC code: 0277-786X/13/$18 · doi: 10.1117/12.2016647
Proc. of SPIE Vol. 8714 871402-1 Downloaded From: http://proceedings.spiedigitallibrary.org/ on 08/31/2014 Terms of Use: http://spiedl.org/terms
have studied and analyzed micro-Doppler phenomena from mathematical, simulations, and experimental perspectives.5, 6, 7, 8, 9 This paper is structured as follows. Section 2 describes background information on noise radar and Doppler. Section 3 describes the ranging and Doppler experimental results. Section 4 provides a conclusion and recommendations for future work. The work presented in this paper is a continuation of work that was presented in Reference[1] which provides information on the radar system.
2. BACKGROUND 2.1 Noise Radar 2.1.1 Target Ranging and Matched Filtering Let Xt (t) represent the band limited transmitted noise waveform with bandwidth B. An expression for Xt (t) is shown in (1) Xt (t) = Xc (t) cos(2πfo t) − Xs (t) sin(2πfo t)
(1)
where Xc and Xs are uncorrelated zero-mean Gaussian in-phase (I) and quadrature (Q) components of the noise waveform. They have the same variance σ 2 and fo is the center frequency of the noise waveform. After the signal is reflected off an object, the received signal Xr (t) is compared with a time delayed replica of the transmitted waveform Xd (t). Expressions for Xr (t) and Xd (t) are shown in (2) and (3). Xr (t) = kr (Xc (t − τo ) cos(2πfo t) − Xs (t − τo ) sin(2πfo t))
(2)
Xd (t) = kd (Xc (t − τd ) cos(2πfo t) − Xs (t − τd ) sin(2πfo t))
(3)
Here, τd is the internal delay and k1 and k2 represent the amplitude scaling due to the scattering from the target and loss due to range. If R is the range to the target, then the round-trip time delay in (2) is given by τo = 2R/c, where c is the speed of wave propagation. The cross-correlation between signals Xr (t) and Xd (t), assuming that Xr (t) and Xd (t) are uncorrelated wide-sense stationary processes, and defining the delay difference τ = τd − τo , can be derived as Φrd (τ ) = k1 k2 E{Φcc (τ ) cos(2πfo τ )}
(4)
where Φxy () denotes the auto or the cross correlation function and E{} denotes expected value. The autocorrelation function in (4) shows a peak when τ = 0, i.e., when τo = τd . Thus, measurement of the appropriate delay at which the correlation function shows a peak provides target range information. The correlator thus acts as a matched filter.
2.2 Doppler Identifying human movements via their Doppler signatures to infer possible intent is an area of active interest. Any movement of the human will yield a Doppler frequency shift fd of the transmit signal given by 10 fd =
2v 2vfo = λo c
(5)
where v is the speed of the limb or the body part in motion, and fo and λo are the frequency and wavelength of the probing signal. Since different body parts will have different speeds, the corresponding Doppler frequencies will be spread over a range of frequencies containing possible information on the full range of motion.
Proc. of SPIE Vol. 8714 871402-2 Downloaded From: http://proceedings.spiedigitallibrary.org/ on 08/31/2014 Terms of Use: http://spiedl.org/terms
3. EXPERIMENTAL RESULTS 3.1 Ranging 3.1.1 Long Range Ranging The maximum range of any radar system is an important characteristic to know. The factors that affect the maximum range are apparent from the well known radar range. Because the goal of this project is to identify humans, a human target was used to establish the maximum range of our radar system. The maximum detection range has been experimentally tested and found to be at least 213 m (700 ft), at which a signal-to-noise ratio (SNR) of 13 dB was achieved. This is the furthest we were able to test our system due to constraints caused by the physical limits of our outdoor testing range. This leads to the conclusion that if the minimum SNR required for detection is less than 13 dB, our maximum range will be further than the 213 m established thus far. As seen in the radar range equation, the received power falls off as R4 , so if the target distance doubles, the receive power will drop 16 times (or by 12 dB). This means that if we only need 1 dB SNR, the radar can theoretically detect a human 426 m (1400 ft) away.
12
12
10
10
Correlation Value
Correlation Value
Range plots of a human target located at 183 m and 213 m are shown in Figure 1. Figure 1 shows the raw correlation of the reference and receive signals without any extra processing. These plots show the antenna coupling and clutter in the test scene. The human targets can also be seen, but this response is not dominant.
8
6
4
2
0
8
6
4
2
0
50
100
150
200
0
0
50
Distance [meters]
100
150
200
Distance [meters]
(a)
(b)
Figure 1: Raw correlation plot of human at (a) 183 m (600 ft) and (b) 213 m (700 ft). In order to make the detection process easier, background subtraction is implemented. To do this a range plots of the background scene, i.e. scenes with no human target, are averaged to generate an average range plot of the background. This average background plot is then subtracted from the scene with the human targets. The results of background subtraction are shown in Figure 2(a) for the human at 183 m and Figure 2(b) for the human at 213 m. As seen in these plots, the background subtraction helps to emphasize the response from the human by reducing the background responses.
Proc. of SPIE Vol. 8714 871402-3 Downloaded From: http://proceedings.spiedigitallibrary.org/ on 08/31/2014 Terms of Use: http://spiedl.org/terms
1.4
1 0.9
1.2
Correlation Value
Correlation Value
0.8 1
0.8
0.6
0.4
0.7 0.6 0.5 0.4 0.3 0.2
0.2 0.1 0
0
50
100
150
0
200
0
50
Distance [meters]
100
150
200
Distance [meters]
(a)
(b)
Figure 2: Correlation plot of human at (a) 183 m (600 ft) and (b) 213 m (700 ft) with background subtraction. This background subtraction technique does a good job of reducing background objects, but as seen in Figure 2, there are still background peaks of comparable amplitudes to that of the human. These peaks are much close to the radar so even though these peaks are as high as the human peak, we can take into consideration the fact that power falls off as R4 and correct for it by scaling appropriately. Figure 3 shows the distance-corrected ranging plots. In these plots, the peaks from the humans can be clearly identified. 8
x 10
Distance Corrected Correlation Value
Distance Corrected Correlation Value
8
8 7 6 5 4 3 2 1 0
0
50
100
150
200
9
x 10
8 7 6 5 4 3 2 1 0
0
50
Distance [meters]
100
150
200
Distance [meters]
(a)
(b)
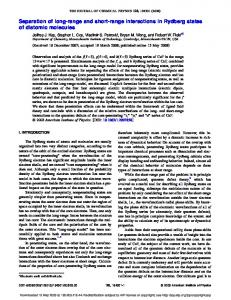
Figure 3: Raw correlation plot of human at (a) 183 m (600 ft) and (b) 213 m (700 ft) with background subtraction and distance correction. 3.1.2 Foliage Penetration Ranging In addition to exploring the maximum range of our radar system, we explored the radar systems ability to detect targets through light foliage. To do this, we aimed the radar at a Forsythia Intermedia bush with dimensions 2 m x 2 m x 10 m and placed different targets behind it. We also took data of the targets behind the bush when it had leaves and also after the leaves fell off to see the effect the leaves have on the system’s ability to identify targets behind it. A diagram of experimental setup is shown in Figure 4.
Proc. of SPIE Vol. 8714 871402-4 Downloaded From: http://proceedings.spiedigitallibrary.org/ on 08/31/2014 Terms of Use: http://spiedl.org/terms
Target Radar R
2m
Figure 4: Geometry of the foliage penetration experiment setup. For this experiment, we used two targets, a corner reflector and a human. We kept the radar at a standoff distance of 30 m from the bush and each target was placed 2 m behind the bush during its trial. Correlation data were taken and averaged over 100 looks to get an average response. Figures 5(a) and 5(b) show baseline data for the bush with no leaves and corner reflector respectively. The average correlation value of the bush with no leaves is 0.09 and 5.0 for the corner reflector. When the corner reflector is placed behind the bush, its average correlation value drops to 0.92. This corresponds to a two way loss of 7.4 dB for the bush with no leaves. It should also be noted that the reflection from the bush in this scene is consistent with the baseline data. Data were taken when the bush had leaves on it and the corner reflector was placed behind it. The correlation plot is shown in Figure 5(d) and it shows that the reflection from the bush has doubled to 0.18 and the response from the corner was reduced to 0.12. This corresponds to a two way loss through the bush with leaves of 16.2 dB. 0.09
6
0.08
Correlation Value
Correlation Value
5 0.07 0.06 0.05
Bush No Leaves
0.04 0.03
4
Corner Reflector
3
2
0.02 1 0.01 0 20
25
30
35
0 20
40
25
Distance [meters]
30
(a) 1
0.18 0.16
0.7
Corner Reflector
0.5 0.4
Bush No Leaves 0.3
Correlation Value
Correlation Value
0.8
Corner Reflector
0.14 0.12
Bush With Leaves 0.1 0.08 0.06 0.04
0.2
0.02
0.1 0 20
40
(b)
0.9
0.6
35
Distance [meters]
25
30
35
40
0 20
25
Distance [meters]
30
35
40
Distance [meters]
(c)
(d)
Figure 5: Correlation plot of (a) the bush with no leaves and no target, (b) the corner reflector alone in the scene, (c) the bush with no leaves with the corner reflector behind it, and (d) the bush with leaves with the corner reflector behind it.
Proc. of SPIE Vol. 8714 871402-5 Downloaded From: http://proceedings.spiedigitallibrary.org/ on 08/31/2014 Terms of Use: http://spiedl.org/terms
In addition to taking data with the corner reflector behind the bush, a human target was used. The data taken with the human behind the bush with no leaves is plotted in Figure 6. This figure shows that the response of the human behind the bush with no leaves about 0.04. This is 25 times less than the response of the corner reflector for the same setup. The response of the corner reflector behind the bush with leaves is about 8 13 times less the the response without leaves. This means that the response of the human behind the bush with leaves should be about 0.005, and this is on the order of the noise floor. This show the limitation of the radar system in detecting human targets behind foliage. These result are consistent with the measured data where a human target cannot be detected in range when the bush has leaves on it. 0.09
Correlation Value
0.08 0.07
Human 0.06 0.05
Bush No Leaves 0.04 0.03 0.02 0.01 0 20
25
30
35
40
Distance [meters]
Figure 6: Correlation plot of human behind the bush with no leaves.
3.2 Doppler As stated in the introduction, the ability to discriminate a human target from clutter and identify the human’s movement is of great interest. Several experiments have been conducted that test the system’s ability to identify different human movements in different situations. In these experiments, human targets are standing a set distance from the radar and perform movements while stationary. There are four movement that were chosen for investigation. The first motion is the human breathing, which consists of the human standing still and only breathing. The second motion used is the human swinging his/her arms. When the person swings his/her arms, he/she is stationary and both arms swing in sync. The third motion we investigated is a person bending over to pick up an object. The person bends over to pick up an object and then stands back up. The last motion studied is a human starting from a crouching position and standing up. In the first experiment, a human is placed at 30 m and data are taken of all the motions. Using a relatively close range of 30 m yields high SNR and the data can be used as a baseline comparison in the other experiments. The second experiment tests the radar system’s ability to identify the same movements at further distances; 90 m is used and all four motions are performed. The last experiment conducted tests the radar system’s ability to detect the Doppler from the a human through light foliage. The setup for this experiment is scene in Figure 4 and here the target is a human. All motions are performed during the foliage penetration test except breathing; the reason for this will be explained in Section 3.2.3. For all three experiments, high-gain dielectric horn antennas were used and the plot scales are held constant in each experiment to make comparison easier. 3.2.1 Human Activity at 30 Meters The data presented in this section show the Short-Time Fourier Transform (STFT) of the Doppler data for each motion preformed at 30 m. Figure 7(a) shows the STFT of the Doppler response of the background. This is important know because it will determine the system’s minimum detectable signal. Figure 7(b), shows the Doppler response of the human breathing. The human is located at 30 m (100 ft) from the radar. From this plot, it is evident that breathing produces Doppler frequency shifts on the order of a few tens of Hz. Comparing the data of breathing to the background shows that the breathing Doppler is more then 26 dB higher than the background.
Proc. of SPIE Vol. 8714 871402-6 Downloaded From: http://proceedings.spiedigitallibrary.org/ on 08/31/2014 Terms of Use: http://spiedl.org/terms
10 l0
0.14
1=1 0.14
- 0.12
0.12
- 0.1
0.1
- 0.08
0.08
0.06
0.06
0.04
0.04
0.02
0.02
l0
Ñ 8 l0 2 >+
7 l0
N
6 l0
O-
5 l0
U
4)
LL
l0
4)
Q 300 C-
0O
200 100
°O
0.5
1
1.5
2
2.5
3
3.5
4
4.5
0
0.5
5
1.5
Time [Seconds]
2
2.5
3
3.5
4
4.5
Time [Seconds]
(a)
(b)
Figure 7: (a) STFT of the background, and (b) Doppler response of a human breathing at 30 meters (100 feet). The next motion tested is the person swinging his/her arms, The STFT is plotted in Figure 8(a). This plot shows that the arm swinging motion is periodic every 12 second or so. The STFT also shows that there are multiple components of the body moving while the arms are swinging. The Doppler frequencies lower than 100 Hz correspond to the larger, slower torso swaying while the smaller, faster Doppler response from the arms swinging go up to 900 Hz. The next motion tested is person bending over to pick up an object. The STFT plot for this motion is found Figure 8(b). In this motion, there are two distinct high frequency pulses that correspond to the person first bending over then standing back up. These pulses last about 1 second, and within each pulse there are multiple components to the Doppler relating to different parts of the body. The higher frequency, lower amplitude component corresponds to the motion of the head and reach frequencies up to 800 Hz. This is because the pivot point is at the waist the head is the fasting moving object when bending over and standing back up and the head is smaller is physical size then the torso and shoulders. The lower frequency, higher amplitude components correspond to the high RCS torso, arms and shoulders moving slower because they are close to the pivot point. These motions produce Doppler frequencies up to 400 Hz. 1000
1000
0.14
Ñ 2
0.12 800 0.1
600 C7
400
o
0.1
600 C7
0.06
0.12 800
>. 700 U
0.08
5) 00
m
Q Q
Ñ 2
>, 700 U
4 LL
0.14
900
900
4 LL
0.08
5) 00
0.06
400
m 300
0.04
Q Q o
200
300
0.04
200
0.02 100
0
0.02 100
0.5
1
1.5
2
2.5
3
3.5
Time [Seconds]
4
4.5
5
0
0.5
1
1.5
2
2.5
3
3.5
4
4.5
5
0
Time [Seconds]
(a)
(b)
Figure 8: (a) STFT of the Doppler response of a human swinging his/her arms at 30 meters (100 feet), and (b) STFT of the Doppler response of a human picking up an object at 30 meters (100 feet). The last motion tested is the human starting in a crouching position and and standing up. The STFT plot for this motion is found in Figure 9. For this motion, there is one high frequency pulse that last about 1 second and tapers off into lower frequency swaying. The lower frequency swaying is caused by the human being slightly unstable from the process of standing from the crouch position. This motion does not have a pivot point so all body parts move at the same time with similar speed, this makes it difficult to identifying different body part
Proc. of SPIE Vol. 8714 871402-7 Downloaded From: http://proceedings.spiedigitallibrary.org/ on 08/31/2014 Terms of Use: http://spiedl.org/terms
based on speed. The highest Doppler frequencies reached in this motion are about 300 Hz and the low speed swaying causes Doppler frequencies of < 100 Hz. 1000
0.14
900 0.12
Ñ
800
>
700
2
0.1
U 600
0.08
500 0.06
400
aQ
300
0.04
po 200 0.02 100
0
0.5
1
1.5
2
2.5
3
3.5
4
4.5
0
5
Time [Seconds]
Figure 9: STFT plot of the Doppler response of a human going from a crouching position to standing 30 meters (100 feet). 3.2.2 Human activity at 90 meters For this experiment, the same motions are performed as the previous section but they are now done with the human at 90 m range from the radar. The intensity axis is changed from the the last section but it is held constant in this section. The first two plots show the STFT of the background and breathing data in Figure 10(a) and 10(b) respectively. When comparing these plots, it is clear that the breathing data has higher intensity at the lower frequencies than the background data; however because of the increased distance from the radar, the breathing data is not as clearly different from the background as it was in the 30 m data. 1000
1000 0.02
900
Ñ 2
0.018
800
0.016
>, 700 U 4)
0.014
0.02
900
Ñ 2
0.018
800
0.016
>, 700 U
0.014 600
600
0.012
0.012 C7
4 LL
500
5) 00
0.01
Q Q O
0.008
300
0.006
200 100
%0
0.01
LL
400
m
0.5
i47RL1'il 1
1.5
2
2.5
3
3.5
Time [Seconds]
4
4.5
5
400
0.008
m
Q 300 CO
0.006
0.004
200
0.002
100
0.004
,
N1 0 0
0,ásKnutlr°
i
0.5
1
1.5
2
2.5
3
3.5
4
4.5
0.002
5
Time [Seconds]
(a)
(b)
Figure 10: STFT plots of the Doppler response from (a) the background and (b) a person breathing at 90 meters (300 feet). Figure 11(a) shows the STFT of a human swinging his/her arms at 90 m. In this figure, it is clear that the higher frequencies of the arm swinging motion are above the background and can be identified as periodic motion repeating every 12 second or so. It is also clear that this periodic motion creates frequency up to 900 Hz. These are the same characteristics as the 30-m arm swinging data. Figures 11(b) shows the STFT of a human picking up an object at 90 m. Like the 30-m data of the human picking up an object, two distinct high frequency pulses can be identified with frequencies up to 400 Hz. Unlike the 30-m data, the response from the human’s head cannot be identified. This is likely because of the lower RCS.
Proc. of SPIE Vol. 8714 871402-8 Downloaded From: http://proceedings.spiedigitallibrary.org/ on 08/31/2014 Terms of Use: http://spiedl.org/terms
1000
1000 0.02
900
0.018
Ñ 800
2
> U
0.016
700
0.014
2
CT 500 0.01
400
0.008
4)
o
0.016
U
0.014 600
0.012
Q Q
0.018
800
>, 700
600
LL
0.02
900
Ñ
300
0.006
200
0.004
100
0.002
0.012 C7
d
LL
5 00
0.01
400
0.008
m
Q Q o
300
0.006
200
0.004
100
0.002
0 0
0.5
1
1.5
2
2.5
3
3.5
4
4.5
5
0
0.5
1
1.5
2
2.5
3
3.5
4
4.5
5
Time [Seconds]
Time [Seconds]
(a)
(b)
Figure 11: STFT plots of the Doppler response from (a) a person swinging his/her arms and (b) a person picking up an object, both at 90 meters (300 feet). The last motion performed at 90 m is the human starting in a crouching position and standing up. The STFT of this data is shown in Figure 12. In this figure, one high frequency pulse is present which last about one and a quarter second and has frequencies up to about 250 Hz. The pulse lasting longer indicates that in this case the person took longer to perform the motion. If the motion took longer to perform, that means that it was done slower, so these data are consistent with the crouching to standing data taken at 30 m, but it was performed slower and for a longer time. 1000 0.02
900
0.018
I>, 700
Ñ 800 U Ç d
0.016 0.014
600
7
O"
d
LL
0.012 500 0.01
400
0.008
m
Q Q
300
0.006
O
a 200
0.004
100
0.002
Figure 12: STFT plot of the Doppler response from the a person starting in a crouching position and standing up at 90 meters (300 feet). 3.2.3 Human Activity Through Foliage In the final experiment, the radar’s ability to detect human Doppler through light foliage is tested. The test setup is the same as Section 3.1.2 and is shown in Figure 4. The received signal contains Doppler signatures of both the wind-influenced foliage as well the activity behind it. For this section, the background Doppler data are very important. This is because unlike the ranging data, the Doppler background cannot be averaged or subtracted out. In this case, filtering out the dominant frequencies produced by the foliage is needed. When filtering is performed, it consequently filters out some of our desired signal, but in many cases there is enough information remaining to identify human motion. Figure 13(a) shows the STFT of the background Doppler data from the foliage. As seen in STFT, the majority of the background Doppler is present in the frequencies less than 50 Hz, which is much lower than the Doppler from the human activity (except for the breathing). For this reason, a high pass filter is applied to reduce the effect of the foliage. A 10th order Butterworth filter with a cutoff frequency of 50 Hz is used. Figure 13(b) shows
Proc. of SPIE Vol. 8714 871402-9 Downloaded From: http://proceedings.spiedigitallibrary.org/ on 08/31/2014 Terms of Use: http://spiedl.org/terms
4. CONCLUSION AND FUTURE WORK A multi-modal radar system has been developed in the millimeter wave range for the detection and ranging of human targets. Ranging data has been presented that identifies human targets up to 213 m (or 700 ft) from the radar and the system can theoretically range humans up to 426 m (or 1400 ft). It has been explained that the noise waveform utilized for the ranging is covert and resistant to jamming. Using a noise waveform also allows for multiple noise radar systems to operate simultaneously at the same location. Remote sensing of human movements has also been investigated using a single tone to observe Doppler responses. Data have been presented showing Doppler responses from human targets up to 90 m (or about 300 ft) from the radar system. Both the ranging and humans Doppler detection has been shown to work through light foliage. Future work consist of modifying the radar system and testing the advantages of coherent, I and Q, demodulation for the Doppler response. This will allow the direction of motion to be known. More future work will be to use multiple receive antennas to calculating the direction of arrival of targets. This can be used for tracking human targets in both range and Doppler.11 In addition, testing different types of foliage is required. Testing different types of foliage will provide a larger sample size and this information can be used to address the goal of reducing its effects and emphasizing the response of human targets.
ACKNOWLEDGMENTS This work was supported by the U.S. Army ARDEC National Small Arms Center (NSAC) under Contract #W15QKN-09-C-0116. We appreciate fruitful discussions with E. Beckel, W. Luk, J. Patel, and G. Gaeta.
REFERENCES [1] Gallagher, K. A. and Narayanan, R. M., “Simultaneous human detection and ranging using a millimeterwave radar system transmitting wideband noise with an embedded tone,” Proc. SPIE Conference on Radar Sensor Technology XVI 8361, 836119–1 –836119–10 (April 2012). [2] Grant, M., Cooper, G., and Kamal, A., “A class of noise radar systems,” Proceedings of the IEEE 51, 1060–1061 (July 1963). [3] Cooper, G. R., “Random signal radar,” paper 366, Purdue University (June 1967). [4] Narayanan, R. M. and Dawood, M., “Doppler estimation using a coherent ultrawide-band random noise radar,” IEEE Transactions on Antennas and Propagation 48, 868–878 (June 2000). [5] Chen, V., [The Micro-Doppler Effect in Radar], Artech House Remote Sensing Library, Artech House (2011). [6] Chen, V., “Spatial and temporal independent component analysis of micro-Doppler features,” in [Proc. 2005 IEEE International Radar Conference], 348–353 (2005). [7] Chen, V., “Doppler signatures of radar backscattering from objects with micro-motions,” IET Signal Processing 2(3), 291–300 (September 2008). [8] Chen, V., Li, F., Ho, S.-S., and Wechsler, H., “Analysis of micro-Doppler signatures,” IEE Proceedings Radar, Sonar and Navigation 150(4), 271–276 (August 2003). [9] Chen, V., “Analysis of radar micro-Doppler with time-frequency transform,” in [Proceedings of the Tenth IEEE Workshop on Statistical Signal and Array Processing ], 463–466 (August 2000). [10] Richards, M.A., S. J. and Holm, W., [Principles of Modern Radar: Basic Principles ], SciTech Publishing (2010). [11] Lin, A. and Ling, H., “Doppler and direction-of-arrival (DDOA) radar for multiple-mover sensing,” IEEE Transactions on Aerospace and Electronic Systems 43(4), 1496–1509 (October 2007).
Proc. of SPIE Vol. 8714 871402-12 Downloaded From: http://proceedings.spiedigitallibrary.org/ on 08/31/2014 Terms of Use: http://spiedl.org/terms
1000
0.09
Ñ 800
0.08
>, 700
0.07
2
d LL
Ñ 2
0.01
900
0.009
800
0.008
700
0.007
V
U C7
1000
0.1
900
600
0.06
600
0.006
5 00
0.05
500
0.005
400
0.04
400
0.004
300
0.03
Q. 300
0.003
200
0.02
pO 200
0.002
100
0.01
100
0.001
LL,_
m
Q Q o
VTf1 hir. Yti^WM^Y1/.ti 0^'1fT71YMh^"^^1NhY1Mr^^^Y,'1 rtifir. 0
0.5
1
1.5
2
2.5
3
3.5
4
4.5
°O
5
0.5
1
1.5
2
2.5
3
3.5
4
4.5
0 5
Time [Seconds]
Time [Seconds]
(a)
(b)
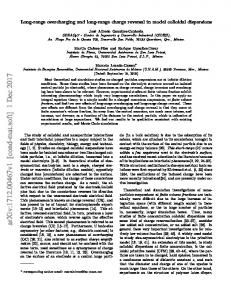
Figure 15: Doppler responses from a person picking up an object behind the bush with leaves at 30 m (100 ft). (a) raw STFT, and (b) filtered STFT. The last motion that can be identified behind the bush is a person starting from a crouching position and standing up. The unfiltered STFT Doppler data is plotted in Figures 16(a). This plot shows that the primary Doppler response is from the bush and produces frequencies of less than 50 Hz. Once the high pass filter is applied, the single high frequency pulse representing the crouching to standing motion can be identified. The pulse last for about one second and reaches about 300 Hz. This is consistent with the crouching to standing Doppler data from 30 m plotted in Figure 16(b). 1000
0.09
Ñ 800
0.08
2 )
1000
0.1
900
Ñ 2
0.01
900
0.009
800
0.008
700
0.007
700
0.07
600
0.06
600
0.006
500
0.05
a 500
0.005
400
0.04
400
0.004
Q 300
0.03
72. 300 c_
0.003
200
0.02
200
0.002
0.01
100
V
C)
LL
LL
d
Q o
o
100
0
0.5
1
1.5
2
2.5
3
3.5
Time [Seconds]
4
4.5
5
°O
0.001
0.5
1
1.5
2
2.5
3
3.5
4
4.5
5
0
Time [Seconds]
(a)
(b)
Figure 16: Doppler responses from a starting in a crouching position and standing up behind the bush with leaves at 30 m (100 ft). (a) raw STFT, and (b) filtered STFT. This section shows the radar system’s ability to detect human movements through light foliage. The motions include a person swinging his/her arms, picking up an object, and crouching to standing. The Doppler response from a human breathing behind the foliage was not detectable. This is because the Doppler frequency response from the human breathing falls within the range of Doppler frequencies created from the foliage.
Proc. of SPIE Vol. 8714 871402-11 Downloaded From: http://proceedings.spiedigitallibrary.org/ on 08/31/2014 Terms of Use: http://spiedl.org/terms
4. CONCLUSION AND FUTURE WORK A multi-modal radar system has been developed in the millimeter wave range for the detection and ranging of human targets. Ranging data has been presented that identifies human targets up to 213 m (or 700 ft) from the radar and the system can theoretically range humans up to 426 m (or 1400 ft). It has been explained that the noise waveform utilized for the ranging is covert and resistant to jamming. Using a noise waveform also allows for multiple noise radar systems to operate simultaneously at the same location. Remote sensing of human movements has also been investigated using a single tone to observe Doppler responses. Data have been presented showing Doppler responses from human targets up to 90 m (or about 300 ft) from the radar system. Both the ranging and humans Doppler detection has been shown to work through light foliage. Future work consist of modifying the radar system and testing the advantages of coherent, I and Q, demodulation for the Doppler response. This will allow the direction of motion to be known. More future work will be to use multiple receive antennas to calculating the direction of arrival of targets. This can be used for tracking human targets in both range and Doppler.11 In addition, testing different types of foliage is required. Testing different types of foliage will provide a larger sample size and this information can be used to address the goal of reducing its effects and emphasizing the response of human targets.
ACKNOWLEDGMENTS This work was supported by the U.S. Army ARDEC National Small Arms Center (NSAC) under Contract #W15QKN-09-C-0116. We appreciate fruitful discussions with E. Beckel, W. Luk, J. Patel, and G. Gaeta.
REFERENCES [1] Gallagher, K. A. and Narayanan, R. M., “Simultaneous human detection and ranging using a millimeterwave radar system transmitting wideband noise with an embedded tone,” Proc. SPIE Conference on Radar Sensor Technology XVI 8361, 836119–1 –836119–10 (April 2012). [2] Grant, M., Cooper, G., and Kamal, A., “A class of noise radar systems,” Proceedings of the IEEE 51, 1060–1061 (July 1963). [3] Cooper, G. R., “Random signal radar,” paper 366, Purdue University (June 1967). [4] Narayanan, R. M. and Dawood, M., “Doppler estimation using a coherent ultrawide-band random noise radar,” IEEE Transactions on Antennas and Propagation 48, 868–878 (June 2000). [5] Chen, V., [The Micro-Doppler Effect in Radar], Artech House Remote Sensing Library, Artech House (2011). [6] Chen, V., “Spatial and temporal independent component analysis of micro-Doppler features,” in [Proc. 2005 IEEE International Radar Conference], 348–353 (2005). [7] Chen, V., “Doppler signatures of radar backscattering from objects with micro-motions,” IET Signal Processing 2(3), 291–300 (September 2008). [8] Chen, V., Li, F., Ho, S.-S., and Wechsler, H., “Analysis of micro-Doppler signatures,” IEE Proceedings Radar, Sonar and Navigation 150(4), 271–276 (August 2003). [9] Chen, V., “Analysis of radar micro-Doppler with time-frequency transform,” in [Proceedings of the Tenth IEEE Workshop on Statistical Signal and Array Processing ], 463–466 (August 2000). [10] Richards, M.A., S. J. and Holm, W., [Principles of Modern Radar: Basic Principles ], SciTech Publishing (2010). [11] Lin, A. and Ling, H., “Doppler and direction-of-arrival (DDOA) radar for multiple-mover sensing,” IEEE Transactions on Aerospace and Electronic Systems 43(4), 1496–1509 (October 2007).
Proc. of SPIE Vol. 8714 871402-12 Downloaded From: http://proceedings.spiedigitallibrary.org/ on 08/31/2014 Terms of Use: http://spiedl.org/terms