Human Vision, Visual Processing, and Digital Display, eds. ... An algorithm is described for learning image interpolation functions for sensor arrays whose sensor positions ..... A. Yonas (Ed.), Perceptual Development in Infancy; The Minnesota ...
Human Vision, Visual Processing, and Digital Display, eds. B.E. Rogowitz and J. Allebach, Proc. Vol. 1249, 124-134, SPIE, Bellingham, WA. Learning receptor positions from imperfectly known motions Albert J. Ahumada, Jr. and Jeffrey B. Mulligan NASA Ames Research Center, Human Interface Branch MS 239-3, Moffett Field, California, 94035 ABSTRACT An algorithm is described for learning image interpolation functions for sensor arrays whose sensor positions are somewhat disordered. The learning is based on failures of translation invariance, so it does not require knowledge of the images being presented to the visual system. Previously reported implementations of the method assumed the visual system to have precise knowledge of the translations. We demonstrate here that translation estimates computed from the imperfectly interpolated images can have enough accuracy to allow the learning process to converge to a correct interpolation. 2. INTRODUCTION The human visual system has the capability of making fine geometric estimates even though the receptor array is disordered,1 variable in density,2 and changes after birth as the eye grows and the fovea becomes tightly packed.3 The calibration of this system presumably occurs without the presentation of known test images. We have been trying to develop algorithms that can perform such tasks in a biologically plausible manner. Understanding such calibration algorithms should be useful for the understanding of biological systems and the development of self-calibrating remote image acquisition systems. Several recent presentations have described a method for correctly calibrating irregularly sampled images where the image content and the sampling positions are both unknown.4-9 The method is based on an error signal derived by viewing the same unknown image from two different eye positions. The error is the difference between the system's current estimate of the image in one position and the estimate of the image in the second position translated by the known difference in eye positions. The error signal is used to update the estimator. Investigations into the required precision of the knowledge of the position difference have suggested that the final accuracy of the image estimation would be of the same order as the accuracy of the translation estimation.6 This made the model questionable for human development, where it is difficult to imagine that the eye movement system could have precision in the range of the cone spacing (30 arc sec in the central fovea). The question naturally arose as to whether the system might be able to estimate the translation from the incorrect output images well enough to improve its estimates of the images and then "bootstrap" its way to a correct image estimator.6 We report here that when the original receptor position disorder is not too great, this procedure seems to be stable and converge to correct solutions. The rest of the paper comprises two main divisions. The first division (3) reviews the concepts
behind the learning of receptor positions based on translation invariance. The first section (3.1) of this division introduces notation and some notions of image sampling and reconstruction. In previous presentations of the method, the interpolation and re-sampling processes have been simply represented by a linear transformation. Here we make these processes explicit as they are in our computer simulations. In the next section (3.2) the LMS (Least Mean Square) or delta learning rule is described as a way the learning could proceed if the image were known to the system. Finally, the first division ends (3.3) with a presentation of a learning rule that does not assume knowledge of the image: the translation-invariance learning algorithm with known image displacements. In the next main division (4), the unknown displacement version is described and simulation results are presented which demonstrate that the method can work. 3. BASIC CONCEPTS 3.1. Linear image reconstruction and interpolation We will let s represent an image, a scalar function of a two-dimensional position row vector, s(x) = s(x, y).
(1)
The image s will represent the image at the level of the receptors, already filtered by the optics and the receptor aperture. The receptor array is then characterized by a position array X, a column vector of input sample points, X = ( x i ) , i = 1 , ... , n .
(2)
Sampling the image at the receptor positions provides a column vector s of sampled image values, s( X ) = ( s ( x i ) , i = 1, ... , n ) .
(3)
Inside the visual system, the image will be regarded as having been sampled at a set of known positions, X*. In order to estimate s( X*), the image s sampled at the positions X*, the system uses a linear transformation W of s( X), the image samples from the actual positions. We use r to represent the system's estimate of s( X*), where r = W s( X*) .
(4)
The system uses r to generate a reconstructed image s ( x ) using a column vector f of reconstruction r functions, f (x) = ( f j (x) , j = 1, ... , n ) .
(5)
The reconstructed image sr (x) is computed as the inner product of the vector of reconstruction functions and the transformed sampled image, sr (x) = f T r ,
(6)
where the T symbol represents the matrix transpose operation.
If we make the assumption that the reconstruction functions can correctly reproduce an image that was sampled at X*, that s (x) = f T s( X* ) ,
(7)
then the reconstruction will be accurate if r ( X ) = W s( X ) = s( X* ) .
(8)
that is, if W is the transformation W* which computes the sample points at X* from the sample points at X. If the images can be reconstructed as in Equation (7) from samples taken at the positions of X*, then by substituting the sample points of X into (7) in place of x, we see that the image values at the sample points X are a linear transformation of the sample points at X*, s( X ) = F s( X*),
(9)
where the rows of the transformation F are the interpolation functions evaluated at positions of X, F = (f i, j) = (f j (x i ) ) .
(10)
If F is invertible then the interpolation problem is solved by setting the connection matrix W equal to the inverse of F, a solution we call W*, W = F -1 = W*.
(11)
3.2. The LMS rule. If the visual system knew the images and hence knew s( X*), it could easily learn W* even though it had no information about X other than s( X ). This problem, to find a linear transformation which gives a known output for each input, is that for which the Widrow-Hoff, Delta, or LMS rule learning rule was developed.10-12 The rule assumes a sequence of learning trials, which we shall index by t. On each trial there is an input s t = s t ( X ) and a corresponding desired output s t * = s t ( X* ). The current estimate of the desired transformation is given by W and the adjustment for this trial will t be represented by ∆W t , that is on the next trial W t will become W t+1 = W t + ∆W t .
(12)
For the LMS rule, the adjustment is proportional to the outer product of the input and the error, ∆W t = λ e t s t T ,
(13)
where the error e t is given by e t = s t* - W t s t . If λ is a small positive number,
(14)
0 < λ < 2 / max t | s t | 2 ,
(15)
and if the sequence of s t is chosen so that all subspaces of the space spanned by the s t are represented infinitely often, then the sequence will converge to W*.13 3.3. Calibration from image translation invariance. Of course, the human visual system does not know what the images are supposed to look like at the sample points X*. We have found that a system can find W* if it uses in the above algorithm an output image that it saw in a different position in place of the correctly sampled image.9 Suppose now that we consider only one basic image and that on each trial we translate it rigidly to a new position by a displacement vector d t, so that s t (x) = s t-1 (x - d t ) .
(16)
On trial t our estimate of the correctly sampled image, s t ( X* ) is W t s t and the estimate of the image is s r, t (x) = f T W t s t .
(17)
To obtain an estimate from the previous trial, we translate the reconstructed image from the previous trial forming s d, t (x) = s r, t-1 (x - d t ) ,
(18)
and then sample it at the reconstruction positions X* to obtain what we shall call s t *, s t* = s d, t ( X* ) ,
(19)
since it will play the role that s t ( X* ) played in the LMS learning algorithm. We then use Equation (13) to train the system. This training algorithm is no longer the LMS rule. It is not searching for a W t which gives the correct answer, it is looking for one that gives a translation invariant answer. Translation invariance does not force a unique solution. We ordinarily force one by requiring that one of output points x* j be at one of the input points x i , and hence that w j, i = 1 , w j, k = 0 , k ≠ i.
(20)
We usually set j = 0, without loss of generality. In simulations, this algorithm has always found W* when it did uniquely exist. 4 UNKNOWN MOTIONS. 4.1. Translation estimation. Although it is possible to imagine cases in which known translations could be generated to calibrate a vision system, it seems likely that during the development of the human visual system and in other
situations the visual system would not know the amount of the translation. We have included in our simulation programs the simplest possible estimator of the amount of translation, the translation which maximizes the correlation or the covariance between the estimates of the samples, that is we take as our estimate of d t , the value which maximizes { st * T Wt st } / { | st * | | Wt st | } .
(21)
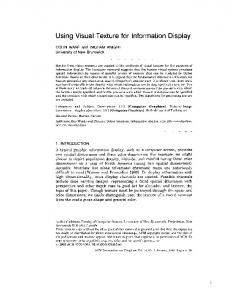
It is possible to show that for equally spaced X*, the denominator is not a function of d t, so the result is the same as finding the d t which minimizes | e t |. 4.2. Simulations. To study these algorithms, we have written programs for some idealized situations. We have assumed that the image is m by m and that the possible translations are integer steps with wrap-around. We have also assumed that the sampling array X has n1 by n1 points (n = n12), that m is an integer multiple of n1 and that the output array points X* are rectangularly and equally spaced and fall on image points. The input points X are randomly jittered with uniform distributions in both dimensions about these values with a jitter parameter ρ which is 1 when the jitter range in one dimension equals the one dimensional sample spacing. The input points are also constrained to fall on image points and not to fall on another input point. Figure 1 shows an example set of sample positions for m = 20 and the X* and X positions with n1 = 5 and ρ = 1.
Figure 1. Example sample positions for a rectangular sampling grid of reconstruction positions jittered by a uniform distribution having a range equal to the grid spacing. The lower left position was fixed at its correct position. For the interpolators, we use the ideal interpolators for low pass images in this domain, f j (x) = g(x - x* j ) g(y - y* j ) ,
(22)
where g ( z ) = 0.5 + Σ i = 1< n/2 cos (2π i z).
(23)
Figure 2 shows g(z) for the sampling grid of Figure 1. It plays the role of the more common sinc function interpolator in our periodic domain.
Figure 2. The ideal interpolation function for the perfectly rectangular sampling grid of Figure 1. For the image, we use a sample of low-pass white noise, synthesized from n12 random amplitude Fourier components. We require that the image space under translation keep its dimensionality to n = n12. This is most easily ensured by requiring that n1 be odd. (When n1 is even, the Nyquist frequency components which only have cosine phase components translate into sine and cosine components. If an arbitrary half of these are dropped, a stimulus space of dimension n will result.) In the present simulations we used a learning rate of λ = 0.5 / | s t | 2.
(24)
Figure 3. Relative RMS errors for learning sequences for the positions of Figure 1. The bottom solid curve (CORRECT) shows the performance with correct feedback. The solid curves above it are for a known-translation sequence. It has two error curves. The middle solid curve (INTERNAL) is the internally generated error. The highest solid curve (TRUE) shows the true errors. The dotted lines are the corresponding internal and true errors for the estimated-translation case.
Figure 3 shows the RMS (Root Mean Square) errors for a learning sequence with known motions and one with estimated motions. The bottom curve, with the smallest average error, shows the performance of the LMS algorithm with correct feedback obtained by sampling the image at the desired positions. The solid curves above it are for the case of unknown image but known amount of translation. There are two error curves for this sequence. The lower curve is for the translation errors e t which are used by the algorithm to correct the weights. It is the average RMS value of the error based on the internally generated feedback. They appear to be converging asymptotically towards zero. The highest solid curve shows average RMS values of the true errors of reconstruction at the output sample points, s t ( X* ) - W t s t .
(25)
The dotted lines just above these two solid lines are the corresponding internal and true errors for the case where the translation has been estimated from the two output images by cross correlation. Despite the fact that neither the image nor the translations are known, the program is learning to compute the values of the input images at the output sample points. The lack of knowledge of the translations only retards performance in the early trials. Later there is no error in the translation estimation. The learning curve for the error in the translation estimation is shown in Figure 4. It also shows errors in translation estimates for other values of n1 and ρ, with other parameters as above. Note that as n1 gets larger, the performance is better, a result expected from the decreased effects of fixed amounts of jitter on the sample cross correlation as the sampled image size increases.
Figure 4. Average position estimation error learning curves. The first parameter is the onedimensional size of the sampling array, n1, the second is the jitter parameter, ρ.
5. DISCUSSION Last year at this meeting we presented a developmental model for geometric calibration of the visual system.14 That model depended on gradients of activity in the retina to measure the relative distances among receptors. Such a model could not have the geometric accuracy of the present model, but such a model may be necessary to give the present model enough accuracy at the beginning to allow the distance estimation to work. One question that frequently arises is why do the positions have to be known? Although direct experience supports this notion and hyperacuity experiments also support it, the strongest evidence comes from the work showing that the orientation of super Nyquist frequency gratings can be correctly perceived,15 and Yellott's analysis showing that knowledge of the actual positions in a jittered array is necessary for this performance.16 The present work provides another use for the interpolation functions that Barlow proposed.17 Here we use interpolation functions to enable the sampling of an internal image at the possible positions corresponding to an estimated translation. Although this model was originally conceived as an attempt to solve a computational problem of the human visual system using mechanisms that would be available to it, the algorithms are also relevant to self-calibration problems that may occur in machine vision. Although present sensor arrays have accurately positioned elements, it is conceivable that future highly dense arrays may not. The algorithms also provide a method for calibrating remote arrays experiencing loss of individual sensor elements. Finally, the methods are suitable for calibrating the gains of sensor elements from overlapping images both for future acquisition and as a post-acquisition image enhancement technique. 6. REFERENCES 1. J. Hirsch and W. H. Miller, Does cone positional disorder limit resolution? Journal of the Optical Society of America A 4, 1481-1492, 1987. 2. C. A. Curcio, K. R. Sloan, O. Packer, A. E. Hendrickson, and R. E. Kalina, Distribution of cones in human and monkey retina: individual variability and radial asymmetry, Science 236, 579-582, 1987. 3. M. S. Banks, Visual recalibration and the development of contrast and optical flow perception, in A. Yonas (Ed.), Perceptual Development in Infancy; The Minnesota Symposia on Child Psychology, vol. 20, Erlbaum, Hillsdale, New Jersey, 1988. 4. L. T. Maloney, Spatially irregular sampling in combination with rigid movements of the sampling array, Investigative Ophthalmology and Visual Science ARVO Supplement 29, 58(A), 1988. 5. L. T. Maloney, Learning algorithm that calibrates a simple visual system, Optical Society of America Technical Digest Series 11, 133(A), 1988. 6. L. T. Maloney, Calibrating a linear visual system by comparison of inputs across camera/eye movements, Applied Vision: Optical Society of America Technical Digest Series, 16, 28-31, 1989. 7. A. J. Ahumada, Jr. and J. B. Mulligan, "Learning in interpolation networks for irregular sampling:
Some convergence properties, Applied Vision: Optical Society of America Technical Digest Series 16, 24-27, 1989. 8. A. J. Ahumada, Jr. and J. M. Pavel, "Receptor position learning from known motions," Optical Society of America Technical Digest Series, vol. 18, p. 142(A), 1989. 9. L. T. Maloney and A. J. Ahumada, Learning by Assertion: Two Methods for Calibrating a Linear Visual System, Neural Computation 1, 392-401, 1989. 10. B. Widrow and M. E. Hoff, Adaptive switching circuits, Institute of Radio Engineers, Western Electronic Show and Convention Record, Part 4, pp. 96-104, 1960. 11. G. O. Stone, An analysis of the delta rule and the learning of statistical associations," in D. E. Rumelhart and J. L. McClelland, eds., Parallel Distributed Processing, vol. I, MIT Press, Cambridge, Mass., chapt. 11, 444-459, 1986. 12. T. Kohonen, Self-Organization and Associative Memory, Third Edition, Springer, New York, 1989. 13. R. R. Bitmead, Persistence of excitation conditions and the convergence of adaptive schemes, IEEE Transactions on Information Theory 30, 183-191, 1984. 14. A. J. Ahumada, Jr. and J. I. Yellott, Jr., Reconstructing irregularly sampled images by neural networks. Proceedings of the SPIE Conference on Human Vision, Visual Processing, and Digital Display 1077, 228-235, 1989. 15. D. J. Williams and N. Coletta, Cone spacing and the visual resolution limit, Journal of the Optical Society of America A 4, 1514-1523, 1987. 16. J. I. Yellott, Consequences of spatially irregular sampling for reconstruction of photon noisy images. Journal of Investigative Ophthalmology and Visual Science 24, (ARVO Supplement), 137, 1987. 17. H. B. Barlow, "Reconstructing the visual image in space and time," Nature 279, 189-190, 1979.