University ofMichigan Transportation Research Institute (UMTRI). Ann Arbor ... Training. 5 visual demand while drivers perform in-vehicle tasks, namely reading. Baseline. 16 ..... Warrendale, PA: Society of Automotive Engineers driving, the ...
1586
PROCEEDINGS
of the HUMAN FACTORS AND ERGONOMICS
SOCIETY 45th ANNUAL MEETING-
VISUAL DEMAND OF DRIVING AND THE EXECUTION OF DISPLAY-INTENSIVE IN-VEHICLE
2001
TASKS
Omer Tsimhoni and Paul Green University of Michigan Transportation Research Institute (UMTRI) Ann Arbor, Michigan ABSTRACT To gain insight as to when telematics can be distracting, 16 participants drove a simulator on roads with long curves of several different radii. Participants read electronic maps displayed in the center console while both parked and driving. In separate trials, the visual demand/workload of the same straight and curved sections was measured using the visual occlusion technique. Visual demand was correlated with inverse curve radius. As visual demand increased, driving performance declined. Participants made shorter glances at the display, made more of them, but waited longer between glances. Overall, task completion time increased when the task was performed while driving (versus while parked), except for short duration tasks (a single glance or under 3 seconds timed while parked), where task time decreased. While driving, task completion times were relatively unaffected by the driving workload. INTRODUCTION Recently, there has been a proliferation of in-vehicle telematics systems and functions. This proliferation should continue into the future (Richardson and Green, 2000), though to a large degree, continued growth depends upon successfully addressing concerns of the safety and usability of telematics. The performance of telematics tasks while driving must be examined and understood in detail, Important aspects include minimizing the distraction potential of the interfaces to telematics and managing information flow to the driver (Michon, 1993). These topics have been the focus of considerable prior research (e.g., Wierwille, Antin, Dingus, and Hulse, 1988; Parkes and Franzen, 1993" Noy, 1997; Wakita, and Terashima, 1999). This paper describes the second in a series of studies to identify the effects of the visual demand of driving on in-vehicle task performance and associated driving performance. In contrast to other research, this series has quantified the visual demand of driving using the visual occlusion technique (Senders, Kristofferson, Levison, Dietrick, and Ward, 1967). In its simplest form, participants drive and close their eyes as often as possible. The fraction of time their eyes are open indicates the visual demand of a road segment. In the first study of this series (Tsimhoni and Green, 1999) participants pressed a switch to request 500 msec glimpses of the road (a typical glance duration), a procedure easier to implement than monitoring eyelid closure. The key finding of the study was a linear relationship betweenthemeanvisualdemandfor a curve(thefractionoftimethe roadwasvisible)andthe inverseradiusof curvature. The current study (Tsimhoni, Yoo, and Green, 1999) builds uponfindingsandmethodsfromthepreviousstudyusinglong constantradiuscurvesto providestable andmeasurablelevelsof visual demand while drivers perform in-vehicle tasks, namely reading maps. The followingquestionswereaddressed: 1) How does the visual demand of driving affect driving performancewhileconcurrentlycompletinga display-intensive in-vehicle task? 2) How does visual demand affect the time to complete the in3)
vehicle task? How do visual demand and task duration affect glance behavior?
TEST PLAN Test Participants Sixteen licensed drivers participated in this experiment, 8 younger (21-28 years old, mean of 25) and 8 older (66-73 years old, mean of 70). Within each age bracket there were 4 men and 4 women. Participants were recruited via an advertisement in the local newspaper and from the UMTRI participant database. All were paid $35 for their participation. Test Activities and their Sequence Participants completed 3 different map-reading tasks with 3 mean durations (short, medium, and long) under 5 different driving workload levels (parked, straight road, easy curve, moderate curve, and sharp curve). All participants participated in all conditions. After completing a biographical form, consent form, and a vision test, participants were seated in a driving simulator. They were familiarized with all street names and icons that would appear on the maps and the 3 types of questions about maps to be answered. The test activities and their sequence are summarized in Table 1. Table 1. Summary of test activities and their sequence Test activity Mapreading Driving Drivingandmapreading
Mapreading Driving with visual occlusion
Training
Time Maps [min] 16 24
Baseline1 Training Baseline Training Test block 1 Testblock 2 Break Test block 3
5 5 16 8 16 16 5 16
12
Baseline 2 Training Test block 1
5 10 16
12
12 24 24 24 .,
PROCEEDINGS
of the HUMAN FACTORS AND ERGONOMICS
Test Materials and Equipment The experiment was conducted using the UMTRI Driver Interface Research Simulator, a low-cost driving simulator based on a network of Macintosh computers [http://www.umich.edu/~driving/sim.html]. The projection screen, offering a field of view of 33 degrees horizontal by 23 degrees vertical, was 6 m (20 ft) in front of the driver, effectively at optical infinity. Testtest roads (2 lanes, 3.66 m with [12 feet] wide) consisted of 1 straight section and curves 3 different radii, connected by short straight sections, for which data were not collected. The straight section and 3 curve radii (582 m, 291 m, and 194 m; or 3, 6, and 9 degrees of curvature, respectively) were identical in width and radius to those in Tsimhoni and Green (1999). Since Tsimhoni and Greenfoundvisual demandto stabilizeat approximately150m past the curve entry point, the map-reading task of this study was initiated 200 m after the entrypoint. To providea constantworkloadof sufficient duration for all tasks in each block (80 s), the test curves were longer than in the prior research..J_,-_ The apparatus for occluding the road-scene consisted of a
SOCIETY 45th ANNUAL MEETING-
-- EMILY
_ _
"
and 1 railroad track. The street names were taken from a list of 100 most popular first names in the U.S. The 16-point font translated to 17 rain of visual angle (0.005 radians), consistent with results from Nowakowski & Green (1998), which recommended 14-point text for similar map displays viewed at a similar distance, Also appearing on the maps were 9 icons from 3 categories (hotels, fast food restaurants, and gas stations) likely to be found on real maps. The icons were chosen so that they were familiar to U.S. drivers and were easily discriminated. The participants practiced identifying the icons and their corresponding categories prior to the actualtrials, Thus, the map reading task involved reasonable questions that could be asked while driving. It used stimuli that were legible, understood by drivers, and representative of real in-vehicle maps in terms of their size, location, and content. This task was performed in a driving simulator whose dynamics and cab were reasonable for a real vehicle, using roads whose geometry was reasonable for real roads.
mr_'°' _8
JACOB--m MARK_ _, EVAN
_
:l>
o "¢ i
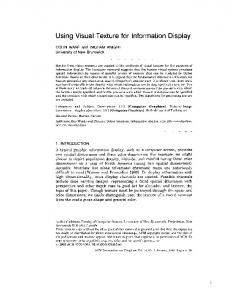
/, CHARLES MOLLY _..... Short Duration Task: "What street are you on?" (Nicole) Medium Duration Task: "what street is the fast food restaurant on?" (Cody) Figure 1 Example of map for short and medium :asks .
Note: The same map graphic could be used for either question. . BRIAN "'_ HANNAH
_.
:'
_ _ on> _ oz JESSE JARED
the road scene with a gray screen for as long as the switch was depressed (except for a control condition in which the road scene was
To simulate a 16 cm (6.25 in.) diagonal monitor (4:3 aspect ratio), the electronic maps were displayed on an unmasked portion of a 13 in. color monitor mounted in the center console of the simulator cab. The center of the monitor was positioned 27+_2degrees below the horizontal line of sight and 28_+2degrees to the fight of the center. In the map-reading task, participants verbally responded to questions about maps shown on the center console. Questions and their responses were grouped into 3 duration categories (short, medium, and long, approximately 2, 4, and 8 s) (Figures 1 and 2). Each map consisted of 12 streets (6 horizontal and 6 vertical), 1 fiver,
DEREK'
r"
switch, mounted on the participant's index finger and connected to the driving simulator. In blocks that assessed the demand of driving, a gray screen replaced the simulator scene for 500 ms whenever the switch was depressed. In blocks that involved reading maps while driving, pressing the switch turned on the map display and replaced
not grayed out to examine if any road information was absorbed when drivers were looking inside the vehicle at a map).
"%_._., ._ :_'_
JASON
z _ o
1587
2001
_ _k I_ I ¢>
_
"_!-,i
L
_ ALIClA z
g o_
_i ,I, //,j^ >..._
/ ...... _ >-
Long Duration Task: "What street intersects with Vanessa at a gas station?" (Jared) Figure 2. Example of map for long task RESULTS
Driving Performance For each block in which participants performed the mapreading task while driving, 12 samples of 5 s of driving data were analyzed (1 sample for each map). The sampled section began after the question had been asked and ended 5 s later. For the driving baseline and the occlusion blocks, the sampled section began at the same location in the curve where the question would be asked and ended 5 s later. (An interval of 5 s was chosen as a compromise that allowed comparison between tasks of different durations.) Figure 3 presents the standard deviation of lateral position (sampled at 30 Hz) in the 3 tested conditions. In the driving baseline, thevariabilityin lateralpositionincreasedby 75%asa functionof curvature. The pattern of driving performance as a function of curvature while performing the secondary task was similar but the magnitude was 80% higher. Interestingly, driving performance in the visual occlusion condition and while performing the secondary task was essentially identical.
1588
PROCEEDINGS
of the HUMAN FACTORS AND ERGONOMICS
0.36 E 0.30
_o
._ 0.24
_\o o_6_._
a. O. 18 m0.12 '*-' "6 a 0.06 co 0.00 straight
6_._xix_ua
2001
'_'14 ._E 12
driving condition
t'-
SOCIETY 45th ANNUAL MEETING-
I
-
,--10 ._o _. E 6 o 0 4
] [
I-o_ 2 0
582 291 194 L curve radius[m]-j
onary ,
_' Stationary , , I Short Long
Task Short Long durationI Medium I
Figure3. The effectof curvatureon thevarianceof lanekeeping
I
Young
The rate of lane departures followed a different pattern. For the
Medium
I
Old
Figure 4. Task completion time by task duration and age
secondary task condition, the rate increased from no departures on straight sections to approximately 1 departure per minute on the sharp curve. In the driving baseline it remained 0, but in the occlusion block (no secondary task), it decreased from about 1.5 departures per
For these tasks, the total glance duration (total eyes-off-theroad time) was significantly shorter when driving (2.9 vs. 3.5 s, p