Hybrid threshold optimization between global image and local regions in image segmentation for melasma severity assessment Yunfeng Lianga , Lei Sunb,a,∗, Wee Sera , Feng Linc , Evelyn Yuxin Tayd , Emily Yiping Gand , Tien Guan Thngd , Zhiping Lina a School
of Electrical and Electronic Engineering, Nanyang Technological University, Singapore 639798, Singapore of Information and Electronics, Beijing Institute of Technology, Beijing 100081, PR China c School of Computer Engineering, Nanyang Technological University, Singapore 639798, Singapore d National Skin Center, Singapore 308205, Singapore
b School
Abstract Melasma image segmentation plays a fundamental role for computerized melasma severity assessment. A method of hybrid threshold optimization between a given image and its local regions is proposed and used for melasma image segmentation. An analytic optimal hybrid threshold solution is obtained by minimizing the deviation between the given image and its segmented output. This optimal hybrid threshold comprises both local and global information around image pixels and is used to develop an optimal hybrid thresholding segmentation method. The developed method is firstly evaluated based on synthetic images and subsequently used for melasma segmentation and severity assessment. Statistical evaluations of experimental results based on real-world melasma images show that the proposed method outperforms other state-of-the-art thresholding segmentation methods for melasma severity assessment. Keywords: Image segmentation, Thresholding segmentation method, Melasma severity assessment
1. Introduction Melasma is a common skin pigment disorder disease that affects millions of people around the world [1, 2, 3, 4]. Since melasma pigments normally appear on the face of a patient, melasma brings huge negative impact on life quality of the patient [5]. In order to properly treat the melasma disease, ∗ Corresponding
author, e-mail:
[email protected] Email addresses:
[email protected] (Yunfeng Liang),
[email protected] (Lei Sun),
[email protected] (Wee Ser),
[email protected] (Feng Lin),
[email protected] (Evelyn Yuxin Tay),
[email protected] (Emily Yiping Gan),
[email protected] (Tien Guan Thng),
[email protected] (Zhiping Lin)
Preprint submitted to Multidimensional systems and signal processing
March 8, 2016
a precise severity assessment is critical to evaluate the effect of a treatment solution. However, melasma assessment has to be conducted by a dermatologist and the assessment result is therefore dermatologist-experience dependent and subjective. Recently, attempts have been made in using computer image analysis for melasma severity assessment by our group [6, 7]. Briefly, we tackle this problem by using digital image processing in first segmenting the computerized images into melasma areas and normal skin areas and then estimating the darkness of the obtained melasma areas. In this procedure, a computerized modified Melasma Area and Severity Index (mMASI) [7] score can be obtained based on the percentage and the darkness of the melasma areas, in a way similar to the assessment procedure conducted by a dermatologist. While some preliminary results have been obtained and presented in [6, 7], the problem of using computers to do melasma severity assessment has not yet been fully solved. Our experience shows that the main difficulty is in segmenting the given images containing melasma due to the following factors. One is that the illumination of a face image is non-uniformly distributed because of lighting or aberration of an imaging system. Another factor is that the intensity differences between the melasma foreground and the normal skin background are obscure in many face images. These problems are especially serious for those face images with shadowing effects caused by lighting on craniofacial organs. Hence, a major challenge is to develop a more effective image segmentation method than the ones in [6, 7] for melasma severity assessment. While there are many image segmentation methods in the literature [8, 9, 10, 11, 12, 13], in our research experiences in melasma severity assessment, we have tested several recent segmentation methods, e.g., [14, 15] and found that a thresholding method is the most suitable one for our application. Hence, we will focus on this category of methods only in the following. Regarding the threshold determination procedures, thresholding segmentation methods can be divided into two types: global thresholding methods and local thresholding methods. The global thresholding methods use a fixed global threshold and the segmentation results suffer from variation of illumination as seen in Otsu’s method (Otsu) [16], entropy based method [17], noise distribution based method [18], etc. For a local thresholding method, in general, the thresholds are pixel-specific and the impact of local illumination variation is expected to be alleviated. Niblack’s method [19] and Sauvola’s method (Sauvola) [20] are two examples of local thresholding methods. However, a local threshold cannot use the information outside a constrained local region around a pixel and segmentation could fail when global information is useful. It is natural to explore the combination of global
2
and local thresholding methods. For example, a combination of the global Otsu threshold and local Otsu thresholds is addressed in [21]. Our group has also recently studied a method [6] which equally treats a global threshold and local thresholds. These examples showed that robust segmentation results with moderate computational complexity can be achieved when local and global information are properly treated. In this paper, by carefully studying the thresholding methods [20, 22, 21, 6], we observe that a proper criterion is desired to guide threshold optimization between global image information and local region information to obtain a robust thresholding segmentation method. Motivated by this observation, we study the optimization between local regions and a global threshold to optimally determine a hybrid segmentation threshold. Our contributions are listed as follows. (i) An optimal hybrid segmentation threshold determination criterion is proposed by means of optimization using an Euclidean distance based deviation between a given image and its segmentation. (ii) Based on the obtained optimal hybrid threshold, an optimal hybrid thresholding segmentation method is developed. (iii) The developed segmentation method is used for melasma severity assessment and is statistically evaluated based on real-world images.
2. Thresholding segmentation methods and an optimal hybrid method In this section, thresholding segmentation methods are briefly reviewed followed by evaluations using synthetic images. A new optimization criterion formulated between a given image and its local regions is proposed. An optimal hybrid threshold is obtained and is used to develop an optimal hybrid thresholding segmentation method. 2.1. Thresholding segmentation methods and evaluations using synthetic images The segmentation model of thresholding methods is simply formulated as { B(x, y) =
0,
I(x, y) ≤ T (x, y)
1,
I(x, y) > T (x, y)
(1)
where B(x, y) is the resultant segmentation label, 0 or 1, for a pixel at location (x, y), I(x, y) denotes its pixel intensity (or brightness) and T (x, y) denotes a decision threshold for this pixel. Based on this segmentation model, each pixel is sequentially operated and foreground objects are finally segmented out from a given image.
3
The thresholding segmentation model shown in (1) is mathematically simple. However, a thresholding segmentation performance depends on the setting of thresholds T (x, y) and therefore the determination of these thresholds is critical to segmentation performance. Several well-known threshold determination methods are listed in Table 1. In this table, Otsu and Sauvola are well-known representatives for global thresholding methods and local thresholding methods, respectively. Otsu [16] uses a fixed global threshold for all pixels while Sauvola [20] uses a separate local threshold for each pixel. Similar to the global threshold determination procedure of Otsu but with thresholds being determined by local regions instead of one global region, AdOtsu is recently proposed in [21] which tries to employ both global region information and local region information. The method of eHybrid is used in [6] and it is another example of using both global region information and local region information. For all the above mentioned methods that using local region information, the range of local region is generally controlled by a window size parameter. It has been noted [21] that a variant scheme using multi-scale window sizes instead of a fixed window size could improve local region adaptation capability. By using multi-scale window sizes, multi-scale Sauvola (mSauvola) and multiscale AdOtsu (mAdOtsu) methods are proposed in [21] where improved segmentation outputs are observed. However, since threshold determination for the two multi-scale methods can hardly be analytically represented, the two multi-scale methods are not included in Table 1. Nevertheless, we will shortly use the multi-scale versions (mSauvola and mAdOtsu), instead of Sauvola and AdOtsu, for performance evaluations due to their improved performance. In order to show segmentation performance of these thresholding methods, experiments are implemented on synthetic images. In Table 1, Otsu’s method adopts a fixed global threshold and it is obvious that this fixed threshold cannot adapt to image background with variant illuminations. This deficiency is a common problem for all global thresholding methods and it has been well discussed in the literature [11]. For this reason, Otsu’s method is not included in our experiments. All the other methods listed in Table 1 are evaluated and their segmentation results are shown in Fig. 1 where Sauvola and AdOtsu are replaced by their improved versions mAdOtsu and mSauvola, respectively. In this figure, synthetic images are shown in the first row and these images represent variant relationships between image foreground and image background. Specifically, in each image there are two circles representing foreground objects to be segmented out from the image background. Among all these images, a small circle is of a fixed circle size while a large circle is of a variant
4
Table 1: Threshold determination methods
Methods
Determination equations
Otsu
TO = arg min(w1 σ12 + w2 σ22 )† T ( ) TAdO (x, y) = Θ |TO −TRO (x,y)| − 1
AdOtsu
×(TO,1−I (x, y) − TO (x, y)) + TO (x, y)‡
†:
Sauvola
− 1)]∗ TSau (x, y) = µ(x, y) · [1 + k( σ(x,y) R
eHybrid
Teh (x, y) = 12 Tl (x, y) + 12 Tg⋆
wi and σi2 are the probability and variance of ith (i = 1, 2) class respectively [16].
‡:
TO (x, y) is the Otsu’s threshold constrained by a local window centered at (x, y). Subscript 1 − I in TO,1−I denotes the inverse of the input image. Θ is a step function (Θ(x) = 0 if x ≤ 0 and Θ(x) = 1 if x > 0) and R is a constant. See [21] for more details.
∗:
µ and σ are respectively a local mean and a local variance. k is a user defined positive value and R is the dynamic range of the standard deviation. See [20] for more details.
⋆:
Tl and Tg are thresholds obtained from global and local methods respectively. Tl is the intensity mean of local region around a pixel and Tg is a chosen global value corresponds to the intensity distribution of a given image. See [6] for more details.
circle size. It is seen that there are illumination variations in all these images. The variant large circles combined with illumination variations demonstrate variant relationships between the image foreground and background which have to be properly treated by the image segmentation methods.
5
Figure 1: Thresholding segmentations on synthetic images.
6
In Fig. 1, images in the second row show the “ground truth” of segmentations. Compared with the ground truth, it can be seen that each of these evaluated segmentation results has some deviations from the ground truth. Specifically, mSauvola considers only local thresholds and its segmentation output deviates from the ground truth with increment of image large circle size. That is, if the segmentation object size exceeds the scope of the local region controlled by the largest window size in mSauvola [21], the segmentation would fail because local thresholds determined in mSauvola cannot utilize information beyond their local regions. mAdOtsu is developed based on Otsu by combining both global and local versions of Otsu’s method. However, mAdOtsu cannot provide a satisfactory result and its segmentation results are even worse than those of mSauvola in several cases. The eHybrid method equally combines local thresholds and a global threshold and its segmentation results are unsatisfactory either with increment of image large circle size. The above experiments on synthetic images indicate that the local thresholds and the global threshold are required to be properly treated to get a satisfied segmentation result. 2.2. Threshold optimization and an optimal hybrid thresholding segmentation method It is interesting to note that for multi-scale based methods like mSauvola and mAdOtsu, there are generally two parameters to consider: one is a window size parameter controlling the scope of a local region around pixels to extract image local information, and the other is a trade-off parameter compromising local region information and global image information. The window size parameter is application specific where prior knowledge is generally required. As our major interest is to find an optimal combination of the local region information and the global image information, the window size parameter is empirically selected and is fixed in this work. We leave discussions of the window size parameter as our future works and interested readers can also refer to [22] for a related discussion. As shown in the segmentation results of eHybrid in Fig. 1, the eHybrid method works well when the large circle size is small (for the 2 most left images). Since eHybrid equally combines each local threshold and a global threshold, it implies that a trade-off between each local threshold Tl (x, y) and the global threshold Tg , instead of treating them equally, is necessary to match variant relationships between the image foreground and background. Based on this observation, a generalization of the equally hybrid thresholding method eHybrid is now proposed by adding a trade-off parameter λ to compromise each local threshold Tl (x, y) and the global threshold Tg (namely wHybrid to denote a
7
weighted hybrid method): Twh (x, y, λ) = (1 − λ)Tl (x, y) + λTg
(2)
where parameter λ ∈ [0, 1] denotes a trade-off parameter which compromises between the global threshold Tg and the local thresholds Tl (x, y). The global threshold Tg and the local thresholds Tl (x, y) in (2) are required to be calculated to obtain a hybrid output Twh (x, y, λ). Like the one used in eHybrid method, calculation of Tg relies on prior knowledge provided by an application. For example, a patch of image background can be selected to obtain Tg by averaging over the selected ∑ patch: Tg = 1/Ns (x,y)∈Sn I(x, y), where Sn is the set of pixels in the selected patch and Ns is the size of this set. For calculation of the local thresholds Tl (x, y), the local threshold determination method of Sauvola [20] is adopted here (see Table. 1). With the obtained global threshold Tg and local threshold Tl (x, y), hybrid threshold Twh (x, y, λ) is calculated from (2) for each given parameter λ. Now, it is interesting to discuss the impact of parameter λ on the hybrid threshold. Particularly when λ = 0, (2) becomes Twh (x, y, λ) = Tl (x, y) and this resultant hybrid threshold is identical to the local threshold of each pixel. Consequently, this hybrid threshold considers only the local information around a pixel as the case in Sauvola’s method. For the case of λ = 1, (2) becomes Twh (x, y, λ) = Tg and this output hybrid threshold is identical to the global threshold Tg . For the general case that 0 < λ < 1, each output Twh (x, y, λ) is a weighted sum of the global threshold and one local threshold. As a result, both local and global information are incorporated into the hybrid threshold Twh (x, y, λ) via the weighted sum. It is noted that λ compromises the importance of the global threshold and each local threshold for the resultant weighted hybrid threshold. Particularly, eHybrid is a special case of wHybrid when λ = 0.5 which corresponds to equal treatment of the local threshold and global threshold. To get a better picture of the impact of parameter λ on segmentation results, experiments are implemented by setting λ at several values and the experimental results are shown in Fig. 2. From this figure particularly when λ = 0.2, it is clearly seen that the segmented objects in image are comparable to the ground truth (Fig. 2 (b)). With λ deviating from 0.2, it is observed that the segmented objects are deforming from the ground truth. This figure shows that segmentation performance is changing with respect to λ which implicates a proper setting of λ is inevitable. From the above discussions, we notice that there is a need to find a criterion guiding the determination of λ. In (2), it is noted that the threshold Twh (x, y, λ) is a linear combination of 8
(a) Original image
(b) Ground truth
(c) λ = 0
(d) λ = 0.2
(e) λ = 0.4
(f) λ = 0.6
(g) λ = 0.8
(h) λ = 1
Figure 2: Weighted hybrid thresholding segmentation with respect to λ
Tl (x, y) and Tg . Noting that the final goal of an obtained threshold Twh (x, y, λ) is to segment a given image, an optimally selected threshold should lead to a segmentation result that well represents the given image. Therefore, we propose to use a deviation between the segmented outputs and the given image to evaluate the effectiveness of the obtained threshold Twh (x, y, λ) and the parameter λ. When the Euclidean distance is adopted, the deviation is formulated as D(λ) =
M ∑ N M ∑ N ∑ ∑ (I(i, j) − Twh (i, j, λ))2 = [I(i, j) − (1 − λ)Tl (i, j) − λTg ]2 , i=1 j=1
(3)
i=1 j=1
where (M, N ) is the size of a given image. Since D(λ) is convex with respect to λ, there exists a unique solution to the optimization problem: λopt = arg min D(λ).
(4)
λ∈[0 1]
Specifically, λopt can be obtained by setting the first derivative of D(λ) to zero and we get ∇λ D(λ) = 2
M ∑ N ∑ [I(i, j) − (1 − λ)Tl (i, j) − λTg ](Tl (i, j) − Tg ) = 0 i=1 j=1
9
(5)
By a straightforward calculation, the optimal parameter λ is obtained: ∑M ∑N i=1 j=1 (I(i, j) − Tl (i, j))(Tl (i, j) − Tg ) λopt = − . ∑M ∑N 2 i=1 j=1 (Tl (i, j) − Tg )
(6)
With this λopt , an optimal weighted hybrid threshold is obtained from (2) and denoted by Toh (x, y, λopt ). Remark: Although there were thresholding determination methods compromising between local and global information for segmentation, to the best of our knowledge, there has been no rule for optimal trade-off parameter determination. The analytic trade-off parameter solution given in (6) distinguishes our method from the multi-scale methods [21] as their threshold determinations can hardly be analytically represented. Algorithm 1 Determination of optimal weighted hybrid threshold Toh (x, y, λopt ) Input: I(x, y) Output: Toh (x, y, λopt ) Initialization Select local window size, Set N eus = 0, Dens = 0 Get Tg for i = 1 to M do for j = 1 to N do Get Tl (i, j) N eu(i, j) = (I(i, j) − Tl (i, j))(Tl (i, j) − Tg ) Den(i, j) = (Tl (i, j) − Tg )2 N eus = N eus + N eu(i, j) Dens = Dens + Den(i, j) end for end for λopt =
N eus Dens
return Toh (x, y, λopt ) = (1 − λopt )Tl (x, y) + λopt Tg The thresholding determination procedure for the optimal hybrid threshold Toh (x, y, λopt ) is given in Algorithm 1. With the obtained optimal trade-off parameter λopt and threshold Toh (x, y, λopt ), an optimal hybrid thresholding segmentation method (denoted as oHybrid) is subsequently developed. 10
2.3. Statistical evaluation of proposed method on synthetic images For comparison, our proposed oHybrid is included in the synthetic image evaluation and its results are shown in the bottom row of Fig. 1. By comparing the oHybrid results with results of other methods in this figure, it is seen that the proposed oHybrid achieves visually better segmentation
1
1
0.8
0.8 RECALL
PRECISION
outputs than those by the compared methods for the synthetic images.
0.6 0.4 mSauvola mAdOtsu eHybrid oHybrid
0.2 0 100
200
300 CIRCLE SIZE
400
0.6 0.4 mSauvola mAdOtsu eHybrid oHybrid
0.2 0 100
500
200
(a) Precision
300 CIRCLE SIZE
400
500
(b) Recall
0.9 0.8
F−MEASURE
0.7 0.6 0.5 0.4
mSauvola mAdOtsu eHybrid oHybrid
0.3 0.2 0.1 100
150
200
250
300
350
400
450
500
CIRCLE SIZE
(c) F-measure Figure 3: Statistical evaluation.
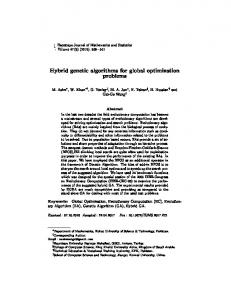
To theoretically evaluate the segmentation results of our proposed method, we use several statistics for performance evaluation: Precision (P ), Recall (R) and F-measure (F ). These statistics
11
are defined as P =
TP ; TP + FP
R=
TP ; TP + FN
F =2
P ×R P +R
where T P, F P, F N represents true positive, false positive and false negative, respectively. T P is the number of correctly detected foreground pixels, F P is the number of background pixels that are wrongly detected as foreground pixels and F N is the number of foreground pixels that are wrongly detected as background pixels. Evaluation results upon the segmentation outputs based on the synthetic images are shown in Fig. 3. In this figure, it is observed that the proposed thresholding method attains the most statistically stable and relatively better results than the other competing thresholding methods. Specifically, both Precision and F-measure of the proposed method approach the best among all compared methods with increment of circle size. Although Recall score of the proposed method takes the second rank in Fig. 3 (b), it is noted that Precision and F-measure scores of mAdOtsu largely fluctuate even its Recall score ranks first in Fig. 3 (b).
3. Melasma severity assessment using optimal hybrid thresholding segmentation In this section, the computerized procedure for melasma severity assessment is firstly reviewed. Our proposed optimal hybrid thresholding segmentation is adopted for melasma image segmentation and melasma severity assessment. Statistical evaluation indexes are given by using severity assessment scores based on real-world samples. 3.1. Computerized procedure for melasma severity assessment In order to remove redundant noise and artifacts from a given image, image preprocessing techniques such as non-face area removing [23] and contrast enhancement [24] are adopted before implementing image segmentation. Subsequently, RBG-color of the processed image is converted to Lab-color by which human perception uniformity is maintained [25, 6, 7]. mMASI is a score function for computerised melasma severity assessment [6, 7]. This melasma assessment score mMASI is defined as [26] mMASI = 0.3Af Df + 0.3Alm Dlm + 0.3Arm Drm + 0.1Ac Dc
12
(7)
(a) mMASI score
(b) Frontal view
(c) Left view
(d) Right view
Figure 4: mMASI score and side views of a face image.
where A and D denote area and darkness values of melasma pigment involvement of a patient, respectively. The subscripts denote four parts of a face region as shown in Fig. 4: forehead region (f ), right malar region (rm), left malar region (lm) and chin region(c). Both the area A and the darkness D in (7) depend on the result of melasma image segmentation. Specifically, D is estimated √ ∑ by [6, 23] D = N1f (x,y)∈Sf ∆L(x, y)2 + ∆a(x, y)2 + ∆b(x, y)2 where Sf is the set of foreground pixels and Nf is the number of samples in Sf . ∆L(x, y) = L(x, y) − µlnorm (x, y) where µlnorm (x, y) is the mean gray value of normal skin pixels in the local region centered at (x, y). In summary, 13
using the mMASI score defined in (7), it is obvious that precise melasma segmentation plays a fundamental role for melasma severity assessment.
(a) Input image
(b) Mask
(c) Gray level image
Figure 5: Image preprocessing for melasma segmentation.
As an illustration, Fig. 5 shows image preprocessing procedures for melasma image segmentation. In Fig. 5, (a) shows a right malar sample image. This image is processed by using a mask image (shown in Fig. 5 (b)) to extract the interested face region. The extracted image is contrast enhanced using retinex method [24] and then transformed into gray level through the Lab-color scheme. The image shown in Fig. 5 (c) is the preprocessed image which is the input for subsequent image segmentation and melasma severity assessment. Our goal is to evaluate the proposed oHybrid segmentation method for melasma severity assessment. For this goal, the proposed method is compared with several state-of-the-art thresholding segmentation methods: mSauvola, mAdOtsu, and eHybrid. For the given input image shown in Fig. 5 (a), its segmentation outputs by using these competing methods are shown in Fig. 6, where the highlighted yellow-block region in (a) is selected as normal skin region for obtaining the global threshold Tg . It is seen that the input image shown in Fig. 6 (a) is with a severe melasma condition because there is one large melasma area together with many small lesion patches. Compared with the input image, there are under-segmented parts within the large melasma area where there are many discontinuities in both the segmentation outputs of mSauvola and mAdOtsu (regions highlighted by cyan ellipses in Fig. 6 (b) and Fig.6 (c)). Under-segmentation in these two methods is in line with the fact that when the foreground size is larger than the muximum local window size, these 14
(a) Input image
(b) mSauvola
(d) eHybrid
(e) oHybrid
(c) mAdOtsu
Figure 6: Melasma segmentation results using several thresholding methods.
two local thresholding segmentation methods fail to extract desired thresholds. Consequently, the foreground pixels could be mis-segmented in such cases. Moreover, mAdOtsu has a problem in dealing with background objects with illumination variations. This problem can be observed in Fig. 6 (c) where there are many background pixels around the face boundaries mis-segmented as foreground pixels (region in the yellow ellipse in Fig. 6 (c)). On the contrary, the segmentation outputs of eHybrid is shown in Fig. 6 (d) and it is observed that this output is likely to be oversegmented by segmenting normal skin pixels as melasma patterns (region in the yellow ellipse in Fig. 6 (d)). As a comparison, the output by using our proposed oHybrid (see Fig. 6 (e)) seems reasonable since it is clearly seen that this output compromises between the under-segmented case and the over-segmented case.
15
3.2. Statistical evaluation of oHybrid thresholding segmentation based melasma severity assessment In this subsection, a set with images obtained from 29 melasma patients is used as benchmark input for melasma segmentation and severity assessment. Each patient takes two measurements at different time points: one is taken before a treatment (baseline) and the other is taken after the treatment (post-treatment). This image set is also adopted in our previous studies [6, 7]. One goal of melasma severity assessment is to evaluate the treatment impact on a patient by a comparison between the two measurement scores. Since there is no objective assessment rule and in order to obtain a convincing evaluation result, each image is separately examined by three dermatologists and an average score obtained from them is used as our benchmark. In the following, the estimated score obtained from the proposed oHybrid is denoted as oMASI to differentiate from mMASI defined earlier in (7). The scores from the baseline and post-treatment in mMASI and oMASI are denoted as mMASIb and mMASIp , oMASIb and oMASIp , respectively. As one goal of melasma severity assessment is to extract score changes between checking points, we use four statistical indexes to assess the changes. The first one is the number of errors (Nt ) in ∑29 the changes: Nt = i=1 Ei , where Ei = 1 if (oMASIp,i − oMASIb,i )(mMASIp,i − mMASIb,i ) < 0 or Ei = 0 otherwise. The other statistical indexes are Spearman’s correlations calculated from baseline (Sb ) results, post-treatment (Sp ) results and difference (Sd ) results. Spearman’s correlation is defined as [27] ρ = 1 −
∑ 2 6 di n(n2 −1) ,
where n is the number of samples
in experiments and di is the difference between the ranks of mMASI scores obtained from dermatologists and the ranks of oMASI scores obtained by using computerised methods. To obtain Sb , we firstly sort both the baseline dermatologist generated scores (denoted by mMASIb ) and the computer generated scores (denoted by oMASIb when using oHybrid) in a descending order over all 29 image sets. The rank of mMASIb and the rank of oMASIb are recorded by Rbm and Rbo , respectively. Correlation index Sb = 1 −
6
∑29
(Rbm,i −Rbo,i )2 29(292 −1)
i=1
is subsequently calculated by using
the ranks. Sp is obtained in a similar way as Sb by ranks obtained from the post-treatment sores mMASIp and oMASIp . Similarly, Sd is calculated by using the ranks of score changes from the baseline to post-treatment: mMASIp − mMASIb and oMASIp − oMASIb . With the above statistical indexes obtained from severity assessment scores in experiments, the performance of melasma severity assessment regarding each segmentation method is statistically evaluated. Moreover, we use τ =
Sb +Sp +Sd Nt
as an overall performance index which takes into account
all the 4 indexes, Sb , Sp , Sd and Nt . The statistical evaluation results are shown in Table 2. 16
Table 2: Comparison of thresholding methods for melasma severity assessment
Nt
Sb
Sp
Sd
τ
mSauvola
7
0.743
0.719
0.603
0.295
mAdOtsu
8
0.656
0.589
0.594
0.230
eHybrid
2
0.735
0.608
0.622
0.983
oHybrid
2
0.869
0.651
0.667
1.093
Boldface indicates the best score among the evaluated methods.
From Table 2, it can be observed that the performance of mAdOtsu is the worst. This result is in line with our previous experimental results on synthetic images since mAdOtsu cannot adapt to illumination variations. mSauvola achieves relatively higher correlation scores. However, its number of the error of changes is 7 which is large among the compared results and is unacceptable. An error of change detection means a wrong evaluation of a therapy treatment. One reason for the large change detection error number may be that mSauvola tends to underestimate the severe cases. The method of eHybrid is a particular case of the weighted hybrid method as mentioned earlier. Hence, its results could not exceed those by the proposed oHybrid. Particularly, oHybrid attains the best τ -score among all the competing methods. To give a better picture of the statistical evaluation results, scatter plots of the baseline scores, post-treatment scores, and change scores between the benchmark mMASI and the computerized scores obtained from oHybrid are shown in Fig 7 (a), Fig. 7 (b) and Fig. 7 (c), respectively.
4. Conclusion A proper compromise between local region thresholds and a global threshold was shown to be critical to image thresholding segmentation methods. Based on this observation, we proposed an optimal threshold determination criterion by means of optimization using Euclidean distance between a given image and its segmented output. This criterion was shown convex and hence an analytic solution was available. By using this criterion, an optimal hybrid thresholding segmentation method (oHybrid) was proposed and the resultant segmentation outputs were shown statistically
17
14
12
12
10
Correlation coefficient=0.651
p
8
8
oMASI
oMASIb
10
6
4
4
2
Correlation coefficient=0.869
2 0 0
6
2
4
6 8 mMASIb
10
12
0 0
14
(a) Baseline. 4
2
4
6 mMASIp
8
10
12
(b) Post-treatment. Correlation coefficient=0.667
oMASIp − oMASIb
2 0 −2 −4 −6
−4
−2 0 mMASI − mMASI p
2
b
(c) Changes Figure 7: Correlation scores
better than those of the state-of-the-art thresholding methods over synthetic images. The developed oHybrid thresholding segmentation method was adopted for computerized melasma severity assessment. Statistical evaluation of melasma assessment scores by experiments on real-world images showed significant improvement of using the developed optimal hybrid thresholding segmentation method and validated the proposed method.
Acknowledgement We wish to acknowledge the funding support by A*STAR-NHG-NTU Skin Research Grant 2014 (SRG\14011). 18
References [1] P. E. Grimes, Melasma: Etiologic and therapeutic considerations, Archives of dermatology 131 (12) (1995) 1453–1457. [2] V. M. Sheth, A. G. Pandya, Melasma: A comprehensive update, Journal of the American Academy of Dermatology 65 (4) (2011) 689–714. [3] A. d. Tamega, L. Miot, C. Bonfietti, T. Gige, M. Marques, H. Miot, et al., Clinical patterns and epidemiological characteristics of facial melasma in Brazilian women, Journal of the European Academy of Dermatology and Venereology 27 (2) (2013) 151–156. [4] A. Handel, P. Lima, V. Tonolli, L. Miot, H. Miot, Risk factors for facial melasma in women: A case-control study, British Journal of Dermatology 171 (3) (2014) 588–594. [5] R. Balkrishnan, A. McMichael, F. Camacho, F. Saltzberg, T. Housman, S. Grummer, S. Feldman, M.-M. Chren, Development and validation of a health-related quality of life instrument for women with melasma, British Journal of Dermatology 149 (3) (2003) 572–577. [6] Y. Liang, Z. Lin, J. Gu, W. Ser, F. Lin, E. Y. Tay, E. Y. Gan, V. W. D. Tan, T. G. Thng, Melasma image segmentation using extreme learning machine, in: Proceedings of ELM-2014 Volume 2, Springer, 2015, pp. 369–377. [7] E. Tay, E. Gan, V. Tan, Z. Lin, Y. Liang, F. Lin, S. Wee, T. Thng, Pilot study of an automated method to determine Melasma Area and Severity Index, British Journal of Dermatology 172 (6) (2015) 1535–1540. [8] N. R. Pal, S. K. Pal, A review on image segmentation techniques, Pattern recognition 26 (9) (1993) 1277–1294. [9] D. L. Pham, C. Xu, J. L. Prince, Current methods in medical image segmentation, Annual review of biomedical engineering 2 (1) (2000) 315–337. [10] M. Silveira, J. C. Nascimento, J. S. Marques, A. R. Mar¸cal, T. Mendon¸ca, S. Yamauchi, J. Maeda, J. Rozeira, Comparison of segmentation methods for melanoma diagnosis in dermoscopy images, IEEE Journal of Selected Topics in Signal Processing 3 (1) (2009) 35–45.
19
[11] I. Maglogiannis, C. N. Doukas, Overview of advanced computer vision systems for skin lesions characterization, IEEE Transactions on Information Technology in Biomedicine 13 (5) (2009) 721–733. [12] C. Li, C. Xu, C. Gui, M. D. Fox, Distance regularized level set evolution and its application to image segmentation, IEEE Transactions on Image Processing 19 (12) (2010) 3243–3254. [13] K. Korotkov, R. Garcia, Computerized analysis of pigmented skin lesions: A review, Artificial intelligence in medicine 56 (2) (2012) 69–90. [14] L. K. Lee, S. C. Liew, W. J. Thong, A review of image segmentation methodologies in medical image, in: H. A. Sulaiman, M. A. Othman, M. F. I. Othman, Y. A. Rahim, N. C. Pee (Eds.), Advanced Computer and Communication Engineering Technology, Vol. 315 of Lecture Notes in Electrical Engineering, Springer International Publishing, 2015, pp. 1069–1080. [15] W. Wen, C. He, Y. Zhang, Z. Fang, A novel method for image segmentation using reaction– diffusion model, Multidimensional Systems and Signal Processing (2015) published online, DOI 10.1007/s11045–015–0365–0. [16] N. Otsu, A threshold selection method from gray-level histograms, Automatica 11 (285-296) (1975) 23–27. [17] J. N. Kapur, P. K. Sahoo, A. K. Wong, A new method for gray-level picture thresholding using the entropy of the histogram, Computer vision, graphics, and image processing 29 (3) (1985) 273–285. [18] H.-S. Don, A noise attribute thresholding method for document image binarization, International Journal on Document Analysis and Recognition 4 (2) (2001) 131–138. [19] W. Niblack, An introduction to digital image processing, Strandberg Publishing Company, 1985. [20] J. Sauvola, M. Pietik¨ainen, Adaptive document image binarization, Pattern recognition 33 (2) (2000) 225–236. [21] R. F. Moghaddam, M. Cheriet, A multi-scale framework for adaptive binarization of degraded document images, Pattern Recognition 43 (6) (2010) 2186–2198. 20
[22] I.-J. Kim, Multi-window binarization of camera image for document recognition, in: Proceedings of the Ninth International Workshop on Frontiers in Handwriting Recognition, 2004, pp. 323–327. [23] A. R. Robertson, The CIE 1976 color-difference formulae, Color Research & Application 2 (1) (1977) 7–11. [24] D. J. Jobson, Z.-u. Rahman, G. A. Woodell, Properties and performance of a center/surround retinex, IEEE Transactions on Image Processing 6 (3) (1997) 451–462. [25] R. S. Hunter, Photoelectric color difference meter, Journal of The Optical Society of America 48 (12) (1958) 985–993. [26] A. G. Pandya, L. S. Hynan, R. Bhore, F. C. Riley, I. L. Guevara, P. Grimes, J. J. Nordlund, M. Rendon, S. Taylor, R. W. Gottschalk, et al., Reliability assessment and validation of the Melasma Area and Severity Index (MASI) and a new modified MASI scoring method, Journal of the American Academy of Dermatology 64 (1) (2011) 78–83. [27] W. Pirie, Spearman rank correlation coefficient, Wiley Online Library, 1988.
21