T.R. Neelakantan et al. / International Journal of Engineering and Technology (IJET)
Hydropower Reservoir Operation using Standard Operating and Standard Hedging Policies T.R. Neelakantan #1, K. Sasireka #2 #1
Associate Dean (Research) and L&T ECC Chair Professor
[email protected] #2 Assistant Professor
[email protected] School of Civil Engineeering, SASTRA University, Thanjavur 613401, India. Abstract— Standard operating policy and hedging policies are commonly used for reservoir operation for municipal or irrigation water supply. Application of these policies to hydropower reservoir operation is complex. In this paper, new standard operating policies and standard hedging policy are proposed for hydropower reservoir operation. The newly proposed policies were applied to the operation of Indira Sagar reservoir in India and demonstrated. Keyword-Reservoir operation, hydropower, hedging policy, standard operating policy, simulation I. INTRODUCTION River water flow varies with time and hence water is stored in reservoirs when available in plenty and used later. Reservoir operation studies aim for reliable supply of water for various uses like municipal requirement, irrigation requirement, hydropower generation requirements, flood control and recreation storage requirement in the reservoir. Basically the reservoir operation studies answer the questions ‘when to release?’ and ‘how much to release?’. Reservoir operations studies can be used for planning or real-time operation. A planning model can help to make decisions like fixing the reservoir size, maximum demand and changing the cropping pattern. For this historical time-series of inflow from the river is collected and through a mass balance simulation model along with certain reservoir operation rules, the performance of the operation is evaluated. Reservoir operation studies use many performance indicators including the economical indicators and release based statistics. Whenever possible, the performance is measured in terms of money benefits. However, the water resources management goals cover the intangible benefits like social justice, equivity and environmental protection also. Hence, if converting the performance in terms of money is difficult, release based statistics are used for measuring the performance [1]. There are many release-policies used in different situations. Standard Operating Policy (SOP) is one of the simplest policies considered in planning models, which aims to release a quantity of water equal to the water demand, if possible, and does not preserve water for future requirements [2]. There are many other rules like hedging rule, space rule, pack rule, linear decision rule etc. In a water deficit system, hedging rule is often used as this rule attempts preserving some water for future use. When preserving for future use, the normal supply may need to be reduced in the current period; however, it helps to brings down severe deficits in the future. In the cases of operation of reservoir for municipal or irrigation supply, the demand is fixed and release is based on availability and demand. In the case of municipal requirements, the demand does not vary with time. In the case of irrigation requirements, the demand varies from season to season depending on weather conditions, and in most cases, the annual demand pattern is repeated year after year. However, in the case of operation of reservoir for hydropower generation, the water demand is a variable though the power demand is constant. The hydropower P is estimated by the equation P = γQh where γ unit weight of water, Q is the water discharge and h is head of water. It is to be noted that the head increases when the storage increases in a non-linear manner. When the storage in the reservoir is more, the head is also more and hence a smaller discharge from reservoir may be sufficient to produce the power. However, if the storage is less, to produce the same power, a large quantity of water is to be discharged. Thus, the water demand for hydropower production is a variable and depends on the water head or storage availability. Hence, simulation of reservoir operation for hydropower generation is complex. II. BACKGROUND ON HEDGING RULES Hedging rule became popular by Maass et al. [3] as they described the concept in their book. In 1990, Bayazit and Unal [4] proposed a two-point linear hedging rule. Shih and ReVelle [5] developed a one point hedging rule, which is special case of two-point hedging rule. Modifying the two-point hedging rule, Srinivasan and
ISSN : 0975-4024
Vol 5 No 2 Apr-May 2013
1191
T.R. Neelakantan et al. / International Journal of Engineering and Technology (IJET)
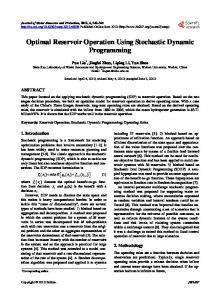
Philipose ([6], [7]) presented a three-point linear hedging rule later this was again modified and used by Shiau [8]. Claiming a closer practical operation, Shih and ReVelle ([5], [9]) introduced Discrete phased hedging rule. Neelakantan and Pundarikanthan ([10], [11]) developed a different discrete phased hedging rule in which they considered beginning storage to trigger the hedging instead of available-water which is beginning storage plus inlow in current period. Later Tu et al. [12] demonstrated the use of discrete phased hedging rule for a multi reservoir systems in which the beginning storage was used to trigger the hedging as suggested by Neelakantan and Pundarikanthan ([10], [11]). The discrete rules are more realistic as the water managers do not usually have the option of a continuous gradation [13], as they need to declare the rationing to the public in a simple manner. While Neelakantan and Pundarikanthan ([10], [11]) and Tu et al. [12] triggered the hedging only based on the beginning storage of a time step, all others used the available-water, which includes the current period inflow, that is, the current-period inflow was assumed known or predicted and used. Shiau [8] extended this further assuming multi-period inflows were assumed known or predicted. In 2011, Shiau [14] reported yet another special type of two-point hedging rule, which he named as ‘type II two-point hedging rule’ in which when the water availability is too less no release is made and that availability is stored as reserve for the next period. In 2004 Draper and Lund [15] published an analytical work on two-period (periods t and t+1) reservoir operation model with an objective of maximization of sum of benefits due to current water delivery and carryover storage value. Extending this work, You and Cai ([16], [17]) addressed implications of the start and end of hedging, the extent of hedging with respect to the demand, inflow uncertainty, and evaporation loss. Later, Zhao et al. [18] continued to study the optimality conditions for SOP and hedging rule. In some reservoir operation studies ([19]-[22]), drought indices based on meteorological and hydrological conditions were employed. Using such drought indicators may represent the reality closer than the triggers based on beginning storage or water availability. In the recent past, Karamouz and Araghinejad [23] and Zhao et al. [18] used non-linear benefit functions instead of release-based statistics. Encouraging use of such economic indicators will lead the research to the next level of using realistic economics based hedging. Though considerable number of literatures is available on reservoir operation for hydropower generation [24]-[26], direct application of hedging rules for hydropower reservoir operation is almost not seen except [27]. Rittima [27] used the same form of hedging policies that are considered for municipal or irrigation reservoir operation. It may be convenient to use a different form of hedging where the nonlinear relationship between demand and storage (and head) is utilized. Hence, the objectives of the present work are (a) to present standard operating policy in a new form and (b) to introduce a newly developed standard hedging policy suitable for hydropower generation reservoirs. III. PROPOSED STANDARD OPERATING POLICIES FOR HYDROPOWER GENERATION The existing SOP used for municipal water supply is presented in figure 1. The x-axis is representing available-water and the y-axis is representing the sum of release and spill. D is the demand and K is the capacity of the reservoir. The available-water is defined as the sum of beginning storage in the reservoir and the inflow during the period minus the evaporation loss during the period. In this case, demand is constant and if the available-water is less then demand all the available-water is released. At the point P1(P1x, P1y), the availablewater is equal to the demand and at P2(P2x, P2y), the available water is sum of capacity of the reservoir and the demand. If the available storage is between P1x and P2x, the release is equal to demand. The line between P0 and P1 makes an angle of 45° with the horizontal.
Release +Spill
P0
P1
P2
D
K+D
D
Available water Fig. 1. Standard operating rule used for municipal water supply
ISSN : 0975-4024
Vol 5 No 2 Apr-May 2013
1192
T.R. Neelakantan et al. / International Journal of Engineering and Technology (IJET)
In the case of hydropower operation, the demand is a function of storage (and head) and is not a constant. Two different hedging models are presented as in figures 2 and 3. This model presented in Fig. 2 is similar to the SOP presented in Fig.1 except that the demand is a considered as a variable and the y-axis represents only the release. Assume the target power, which is to be produced in a period, is TP. There is a quantity of availablewater in the reservoir at which releasing all the available-water produces the target power. This quantity of available-water is named as S. The product of mean head (due to S and zero available storage), S and unit weight of water should provide the TP as power production. This S is to be estimated for a given reservoir using the relationship between head and storage. As the available-water increases more than S, the release required to produce TP will keep decreasing as the head increases. However, after reaching the full reservoir level, the head cannot increase. Hence, during the calculations when the available-water is more than the available-water at full reservoir, the release required to produce TP is taken as constant Rc. Thus, between P1 and P2, the demand and release are falling as the head is increasing and after P2, the demand and release become constant. If an equation is set for the curve between P1 and P2, the usual iterative procedure for estimating the discharge required can be avoided. This is the advantage of presenting the SOP as in Fig. 2 over as in Fig. 1. This rule allows releasing water to produce either the target power or less depending on the available storage. Hence, the rule is referred as ‘Continuous SOP’ henceforth. Release
P1
P2
R0=S
Rc
S
K
P0=(0,0)
Available Water Fig. 2. Standard operating rule for hydropower generation
Sometimes, the managers of the hydropower operation may not like to release the available-water if the power that can be generated is less than the target power and they may like to save the water for future use. This may be preferred as the economic value of the low-head water is low and saving it for future use with future inflows with higher water head may economically benefit more. For such cases, the SOP may be presented as shown in Fig. 3. This rule allows releasing water to produce either the target power or zero power and no partial power production is possible. Hence, the rule is referred as ‘Binary SOP’ henceforth. Release
P1
P2 R0=S
P0=(0,0)
Rc
S
K
Available Water Fig. 3. Modified standard operating rule for generating only the target power
ISSN : 0975-4024
Vol 5 No 2 Apr-May 2013
1193
T.R. Neelakantan et al. / International Journal of Engineering and Technology (IJET)
IV. PROPOSED STANDARD HEDGING RULE FOR HYDROPOWER GENERATION Use of more than one turbine for hydropower generation is very common. When available-storage is less, it is good to operate lesser number of turbines with full discharge load rather than partial discharge in many turbines. Assume a hydropower reservoir system with four turbines of equal power generation capacity, 25% each of full capacity. Figure 4 shows a typical hedging rule for hydropower operation. S1 is the quantity of available-water at which releasing all the S1 will produce the 25% of the full power generation capacity. S2 is the quantity of available-water at which releasing all the S2 will produce the 50% of the full power generation capacity. S3 is the quantity of available-water at which releasing all the S3 will produce the 75% of the full power generation capacity. Similarly, S4 is the quantity of available-water at which releasing all the S4 will produce the 100% of the full power generation capacity. The straight line connecting P0, P1, P2, P3 and P4 is a 45° line. Release P4 P4’
P3 P3’
P2 P2’
P1 P1’ P0=(0,0)
S1
S2
S3
S4
K
Available Water Fig. 4. Standard hedging rule for hydropower generation
If the available-water is less than S1, no turbine is to be operated which means the power production is zero. If the available-water between S1 and S2, only one turbine is to be operated which means the power production is 25% of full capacity. Since the head is increasing between S1 and S2, the release to produce 25% power will be falling and thus the release rule line P1 to P1’ is a curve as shown in figure 4. If the available-water between S2 and S3, two turbines are to be operated which means the power production is 50% of full capacity. If the available-water between S3 and S4, three turbines are to be operated which means the power production is 75% of full capacity. If the available-water more than or equal to S4, all the four turbines are to be operated which means the power production is 100% of full capacity. For a given target power, release is a function of available-water and head. However, beyond full reservoir capacity, the head is constant and hence the release is a function of available-water alone. Thus the rule line beyond P4’ is a horizontal line. V. DEMONSTRATION Indira Sagar reservoir (22º17’00” N, 76º 28’00” E) across river Narmada in India is mainly a hydropower generation reservoir. The salient features of the reservoir are given in table 1. The operation rules developed were applied to the operation of this reservoir and demonstrated. Thirty-two years of inflow data into the reservoir was used in the simulation model that uses the principle the law of conservation of mass. Monthly period was used and hence for the 32 years the total number of periods is 384. The evaporation loss was calculated by multiplying water spread area and rate of evaporation. In a monthly step, the average storage ((beginning storage +end storage)/2) was worked and corresponding water spread area was found using the storage-water spread area relationship. VI. RESULTS AND DISCUSSIONS The proposed continuous and binary SOP models and standard hedging model were applied to the operation of Indira Sagar Reservoir. The results are presented in tables 2, 3 and 4. Though the installed capacity of all the 8 turbines together is 1000 MW, four different target powers were considered at 250, 500, 750 and 1000 MW for the analysis. The application of continuous and binary SOP indicates that as the target power increases, the number of periods in which the target power produced is decreasing. However, the total power production in all the periods together is increasing and this is due to the higher head advantage. Increasing the target from 250 to 500 MW per period increases the total power production by about 45%. However, this percentage increase reduces to about 12% and 3% when increasing the target from 500 to 750 MW and 750 to 1000 MW respectively.
ISSN : 0975-4024
Vol 5 No 2 Apr-May 2013
1194
T.R. Neelakantan et al. / International Journal of Engineering and Technology (IJET)
Standard hedging allows producing either zero or 250 or 500 or 750 or 1000 MW power per period. Table 4 shows that more number of 250 and 1000 MW power productions and less number of 500 and 750 MW power productions. During the normal periods of the year 250 MW production is often possible and during the flood season of the year 1000 MW production is often possible. The S1, S2, S3 and S4 values (refer Fig. 4) used for standard hedging of Indira Sagar reservoir are presented in table 1. These values may be adjusted or optimized for a given objective function. For example, the S1 values may be fixed any value higher than or equal to 1954.87 106 m3 and the S2 should be greater than S1 and higher than or equal to 3656.60 106 m3 and so on. TABLE I Salient Features of Indira Sagar Reservoir
Item Full reservoir level (FRL) (m) Capacity at FRL (million m3) Minimum drawdown level (MDL) (m) Capacity at MDL (million m3) Power house level (m) Number of turbines Power generation capacity of each turbine Overall efficiency of the turbines Storage (S in 106 m3) – Water spread area (WSA in 106 m2) relationship Mean monthly inflow from July to June (106 m3)
Quantity 262.13 12,212 237.70 1357 196.6 8 125 MW 85%
WSA = (−2 ×10⁻⁶ × S 2 ) + (0.0972 × S ) 3931.44
9086.93
7360.77
1635.81
2022.06
1560.04
1079.93
966.88
813.60
641.13
513.73
1553.19
Mean monthly evaporation rate from July to June (m)
0.1524
0.1270
0.1397
0.1397
0.1016
0.1016
0.1016
0.1270
0.2032
0.3302
0.4572
0.2794
Power in (Mega Watts) and Minimum available-storage required S (million m3)
P
0
250
500
750
1000
S
0
1954.87
3656.60
5233.67
6750.92
TABLE II Results of Reservoir Operation Using Continues SOP
Target Power (MW) Quantity Mean release per month (106 m3) Mean spill per month (106 m3) Number of months in which power generated is equal to target Number of months in which power generated is less than the target Total power generated in 384 months (x 1010 kWh)
250
500
750
1000
1301.52
2185.38
2363.77
2487.78
1164.70
381.89
225.09
110.20
371 13
216 168
137 247
89 295
6.87
9.98
10.09
11.30
TABLE III Results of Reservoir Operation Using Binary SOP
Target Power (MW) Quantity Mean release per month (106 m3) Mean spill per month (106 m3) Number of months in which power generated is equal to target Number of months in which no power generated Total power generated in 384 months (x 1010 kWh)
ISSN : 0975-4024
250
500
750
1000
1299.23
2075.02
2232.10
2316.79
1165.99
464.57
312.29
207.27
376
267
200
155
8
117
184
229
6.86
9.75
10.95
11.32
Vol 5 No 2 Apr-May 2013
1195
T.R. Neelakantan et al. / International Journal of Engineering and Technology (IJET)
TABLE IV Results of Reservoir Operation Using Standard Hedging Rule
Item Mean release per month (106 m3) Mean spill per month (106 m3) Number of months in which 250 MW generated Number of months in which 500 MW generated Number of months in which 750 MW generated Number of months in which 1000 MW generated Number of months in which no power generated Total power generated in 384 months (x 1010 kWh)
Quantity 2448.53 131.89 121 23 16 99 125 11.15
VII. CONCLUSIONS Significant research was reported in the past three decades on reservoir operation rules. Hedging rule application for municipal and irrigation water supply was focused by many researchers. However, application of hedging rule or SOP for hydropower reservoir operation was not researched in depth. This paper opens a new research field with few basic rules for hydropower generation. The demonstration also indicates that there is good scope for further research and development in this field. REFERENCES [1] [2] [3] [4] [5] [6] [7] [8] [9] [10] [11] [12] [13] [14] [15] [16] [17] [18] [19] [20] [21] [22] [23] [24] [25] [26] [27]
K. Srinivasan, T.R. Neelakantan, P.S. Narayan, C. Nagarajukumar, “Mixed-integer programming model for reservoir performance optimization”, Journal of Water Resources Planning and Management, 125(5), 298-301, 1999. J.R. Stedinger, “Performance of LDR models for preliminary design and reservoir operation”, Water Resources Research, 20(2), 215224, 1984. A. Maass, M.M. Hufschmidt, R. Dorfman, Jr.H.A.Thomas, S.A. Marglin, G.M. Fair, “Design of Water Resources Systems”, Harvard University Press, Cambridge, Mass., U.S.A., 1962. M. Bayazit, E. Unal, “Effects of hedging on reservoir performance”, Water Resources Research, 26(4), 713–719, 1990. J.S. Shih, C. ReVelle, “Water-supply operations during drought: Continuous hedging rule”, Journal of Water Resources Planning and Management, 120(5), 613–629, 1994. K. Srinivasan, M.C. Philipose, “Evaluation and selection of hedging policies using stochastic reservoir simulation”, Water Resources Management, 10(3), 163–188, 1996. K. Srinivasan, M.C. Philipose, “Effect of hedging on over-year reservoir performance”, Water Resources Management, 12(2), 95–120, 1998. J.T. Shiau, “Optimization of reservoir hedging rules using multiobjective genetic algorithm”, Journal of Water Resources Planning and Management”, 135(5), 355-363, 2009. J.S. Shih, C. ReVelle, “Water supply operations during drought: A discrete hedging rule”, European Journal of Operational Research, 82, 163– 175, 1995. T.R. Neelakantan, N.V. Pundarikanthan, “Hedging rule optimization for water supply reservoirs system”, Water Resources Management, 13, 409-426, 1999. T.R. Neelakantan, N.V. Pundarikanthan, “Neural network-based simulation-optimization model for reservoir operation”, Journal of Water Resources Planning and Management, 126(2), 57-64, 2000. M.Y. Tu, N.S. Hsu, W.W.G. Yeh, “Optimization of reservoir management and operation with hedging rules”, Journal of Water Resources Planning and Management, 129(2), 86-97, 2003. D.K. Srivastava, A. Awchi, “Storage-yield evaluation and operation of Mula reservoir, India”, Journal of Water Resources Planning and Management, 135(6), 414-425, 2009. J.T. Shiau, “Analytical optimal hedging with explicit incorporation of reservoir release and carryover storage targets”, Water Resources Research, 47, W01515, 2011. A.J. Draper, J.R. Lund, “Optimal hedging and carryover storage value”, Journal of Water Resources Planning and Management, 130(1), 83-87, 2004. J.Y. You, X. Cai, “Hedging rule for reservoir operations: 1. A theoretical analysis”, Water Resources Research, 44, W01415, 2008. J.Y. You, X. Cai, “Hedging rule for reservoir operations: 2. A numerical model”, Water Resources Research, 44, W01416, 2008. J. Zhao, X. Cai, Z. Wang, “Optimality conditions for a two-stage reservoir operation problem”, Water Resources Research, 47, W08503, 2011. W.-C. Huang, L.-C. Yuan, “A drought early warning system on real-time multireservoir operations”, Water Resources Research, 40, W06401, 2004. W.-C. Huang, C.-C. Chou, “Drought early warning system in reservoir operation: Theory and practice.” Water Resources Research, 41, W11406, 2005. H.I. Eum, Y.O. Kim, R.N. Palmer, “Optimal drought management using sampling stochastic dynamic programming with a hedging rule”, Journal of Water Resources Planning and Management, 137(1), 113-122, 2011. M. Karamouz, S. Imen, S. Nazif, “Development of a demand driven hydro-climatic model for drought planning”, Water Resources Management, 26(2), 329-357, 2012. M. Karamouz, S. Araghinejad, “Drought mitigation through long-term operation of reservoirs: Case study”, Journal of Irrigation and Drainage Engineering, 134(4), 471-478, 2008. R.S.V. Teegavarapu, S.P. Simonovic, Short-term operation model for coupled hydropower reservoirs, Journal of Water Resources Planning and Management, 126 (2), 98-106, 2000. D. Nagesh Kumar, M. Janga Reddy, Multipurpose reservoir operation using particle swarm optimization, Journal of Water Resources Planning and Management, 133 (3), 192-201, 2007. A.R. Ferreira, R.S.V. Teegavarapu, Optimal and Adaptive Operation of a Hydropower System with Unit Commitment and Water Quality Constraints, Water Resources Management, 26 (3), 707-732, 2012. A. Rittima, Optimal hedging policies for hydropower generation at ubolratana reservoir, Kasetsart Journal - Natural Science, 46 (5), 812-825, 2012.
ISSN : 0975-4024
Vol 5 No 2 Apr-May 2013
1196