that combines the concept of survival of the fittest with natural genetic ... Survival of fittest is applied to the strings based on. Roulette ... 2 Live storage capacity.
International Journal of Engineering and Technology Vol. 1, No. 2, June, 2009 1793-8236
Optimal Reservoir Operation Policies Using Genetic Algorithm Y. P. Mathur, S. J. Nikam
Abstract— In reservoir operation, appropriate methodology for deriving reservoir operating rules should be selected and operating rules should then be formulated. In the present study Genetic Algorithm (GA) has been used to optimize the operation of existing multipurpose reservoir in India, and to derive reservoir operating rules for optimal reservoir operations. The fitness function used is minimizing the squared deviation of monthly irrigation demand along with the squared deviation in mass balance equation. The decision variables are monthly releases for irrigation from the reservoir and initial storages in reservoir at beginning of the month. The constraints considered for this optimization are reservoir capacity and the bounds for decision variables. Results show that, even during the low flow condition the GA model if applied to the Upper Wardha reservoir in Maharastra State, India, can satisfy downstream irrigation demand. Hence based on the present case study it can be concluded that GA model has the capability to perform efficiently, if applied in real world operation of the reservoir. Index Terms— Genetic algorithm, Optimization, Upper Wardha reservoir
I. INTRODUCTION Use of Genetic Algorithm (GA) in determining the optimal reservoir operation policies, is receiving significant attention from water resources engineers. Earlier its potential was explored by Oliver and Loucks[1] and Wardlaw and Sharif [2]. Many traditional numerical methods are available to facilitate the formation of reservoir operating policies. Yeh [3] in state of art review on reservoir management and operation models discussed in details the usefulness of various models for reservoir operations. Labadie [4] in state of art review on optimal operation of multireservoir system highlighted different optimization models suitable for high-dimensional, dynamic, nonlinear and stochastic characteristic of reservoir system. In spite of extensive research in reservoir optimization, researchers are still in search of new optimizing techniques, which can derive more efficient reservoir operating policy for reservoir operation. GA is one such optimizing technique which it is robust and is considered in this study for deriving multipurpose reservoir operating policies. The GA is based on Darwinian natural selection process
that combines the concept of survival of the fittest with natural genetic operators [5]. The working of GA and its application are very well documented by Goldberg [6] and Michaelwiez [7]. One of the advantages of GA is that it identifies alternative near optimal solutions. In the field of water resources for reservoir operation, many applications of GA technique to derive reservoir operating policies have been reported. Oliveira and Loucks reported that GA can be used to identify effective operation policies. Sharif and Wardlaw [8] used GA in water resource development and compared it with dynamic programming, they concluded that both results were comparable. Ahmed J. A., et al. [9] developed a GA model for deriving the optimal operating policy and compared its performance with that of stochastic dynamic programming (SDP) for a multipurpose reservoir. The objective function of both GA and SDP was to minimize the squared deviation of irrigation release. Sensitivity analysis was carried out for mutation and cross over. They found that GA model releases nearer to the required demand and concluded that GA is advantageous over SDP in deriving the optimal operating polices. Janga Reddy M and Nagesh Kumar [10] developed Multi-objective Evolutionary Algorithm to derive a set of optimal operation policies for a multipurpose reservoir system and concluded that the results obtained using the proposed evolutionary algorithm was able to offer many better alternative policies for the reservoir operation, giving flexibility to choose the best out of them. Jotiprakash V and Ganesan Shanthi [11] developed a GA model for deriving the optimal operating policy for a multi-purpose reservoir. The objective function was to minimize the squared deviation of monthly irrigation demand deficit along with the deviation in the target storage. Sensitivity analysis was carried out for crosses over and size of population, and they found that GA model releases nearer to the required demand and concluded that GA model is advantageous in deriving optimal operating polices. In the present study, a GA model has been used for optimum reservoir operation. The objective of this study is to minimize the squared deviation of monthly irrigation demand deficit along with squared deviation of mass balance equation. The decision variables used are the release for irrigation demand from the reservoir and initial storage in each month. The constraints used for this optimization are reservoir capacity, and the bounds for decision variables.
Manuscript received May 9, 2009. Y..P..Mathur, Professor Civil Engineering Department, Malaviya National Institute of Technology Jaipur, Rajasthan, India. S..J. Nikam, Research Scholar Civil Engineering Department, Malviya National Institute of Technology Jaipur, Rajasthan, India (corresponding author phone: 919413090371).
- 184 -
International Journal of Engineering and Technology Vol. 1, No. 2, June, 2009 1793-8236
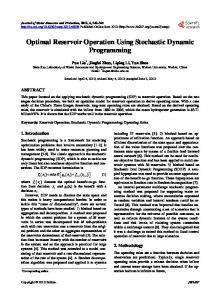
Salient features of the reservoir are given in Table I. The irrigable area of 70169 Ha is spread over the districts of Amravati and Wardha, comprises predominantly of Black cotton soil. Major crops grown in the command area are Jowar, Cotton, Soyabean, Tur, Ground Nut, and Oranges. Fig.2 shows the plot of years against reservoir inflow in MCM and the trend line drawn show a constant reduction in annual inflow, demanding better water planning
Inflow in Res erv oir in M CM
2500
2000
1500 1000
500
0 1970
1975
1980
Fig.1. Location of Upper Wardha Dam (Source: Upper Wardha Project Circle office, Amravati. Maharastra State, India)
1985
1990 Years
Annual Inflow
2000
2005
2010
Trend Line
Fig. 2. Annual Reservoir inflows
Survival of fittest is applied to the strings based on Roulette Wheel Method as suggested in [6].These strings are operated with reproduction, crossover and mutation. These will produce new values of decision variables and again the fitness is determined. The procedure is continued till the monthly release is equal to the monthly demand with minimum irrigation deficit .The accurate selection of the parameters affects the function and running speed of GA. So in the study different parameter were chosen and examined for obtaining the best combination through sensitivity analysis. Further GA has been used to derive operational polices for a single multi-purpose reservoir.
TABLE II STATISTICAL ANALYSIS OF THE HISTORICAL INFLOW.
Sr. No. 1 2 3 4 5 6 7 8 9 10 11 12
II. STUDY AREA The reservoir chosen for the application of the GA model is the Upper Wardha reservoir in Wardha river basin. The Upper Wardha dam is located at Shimbhora village near Morshi in Amravati district of Maharashtra State, India (Latitudes 21o -16’-18”-N., Longitudes 78o-03’- 27” E.). The location of the Upper Wardha river basin is shown in Fig 1. Upper Wardha project is a multipurpose project providing water for irrigation, drinking water supply and for industrial use. Hydropower generation is planned only when water is supplied for irrigation. The average annual inflow to Upper Wardha reservoir is 783 MCM. The average annual rainfall in the catchments is 840 mm, with 95% of the rainfall occurring during monsoon period.
1995
Month
Average inflow (Mm3) 40.29 138.69 279.20 239.54 67.17 9.06 3.30 2.44 1.61 1.069 0.5 0.215
Jun Jul Aug Sep Oct Nov Dec Jan Feb Mar Apr May
Std. dev. (Mm3) 39.72 113.55 180.63 297.094 79.44 6.82 1.25 1.01 0.62 0.40 0.15 0.08
Skewness 1.47 1.97 0.64 2.05 2.89 1.37 0.60 0.67 0.67 0.35 1.38 1.55
From Table II, it can be seen that the average annual inflow is 783 MCM. with a monthly variation in standard deviation from 297.09 to 0.08 and skewness from 2.89 to 0.60. The maximum inflow occurs during the month of September and minimum inflow occurs during the month of May. III.
MODEL DEVELOPMENT
In the present study, the fitness function of the GA model is minimizing the squared deviation of monthly irrigation demand and squared deviation in mass balance equation. The objective function is given by equation [12].
TABLE I. SALIENT FEATURES OF UPPERWARDHA RESERVOIR.
Sr. No. 1 2 3 4 5 6
Characteristic
12
Quantity Z = Minimize
Gross storage capacity Live storage capacity Dead storage capacity 75% dependable Yield Total catchments area Total water utilization
678 27 Mm 564.05 Mm3 114.22 Mm3 500.72 Mm3 4302 Sq.Km 390 Mm3
Source: Upper Wardha Project Circle office, Amravati. (Maharastra State, India)
∑ t=1
3
12
(Rt - Dt )2 +
∑ (St – S
t+1 +It-Rt-Et
)2
(1)
t =1
Where Rt =Monthly irrigation release for the month‘t’. Dt = Monthly downstream irrigation demand for the month‘t’. St = Initial storage in the beginning of month‘t’. St+1 = Final storage at the end of month‘t’. - 185 -
International Journal of Engineering and Technology Vol. 1, No. 2, June, 2009 1793-8236
It Et
= Monthly inflow during the period ‘t’, and = Monthly evaporation loss from the reservoir during the month‘t’.
The above fitness function of GA model is subjected to the following constraints and bounds, A.
Release constraint. The irrigation release during any month should be less than or equal to the irrigation demand in that month and this constraint is given by Rt ≤ Dt,
t = 1, 2, 3, … 12
(2)
B. Storage constraint . The reservoir storage in any month should not be more than the capacity of the reservoir, and should not be less than the dead storage. Mathematically this constraint expressed as: Smin ≤ St
function evaluation, strings are selected based on the percentage contribution of the total population fitness for mating, to form the next generation by the Roulette Wheel Method. For the selection of the optimal size of the different parameters such as size population, optimal probabilities of crossover, a thorough sensitivity analysis is carried out. In GA one of the important parameter is population size, obtaining optimum population is very important. In water resources applications, its values ranges from 64 to 300 and even up to 1000 [13]. A larger population helps to maintain greater diversity but, it involves considerable computational cost when the full model is being used to generate performance predictions. To find optimum population size in present study different population size has been considered. Initial search was carried out with the probability of crossover of 0.80 and with population size 50, increasing further in step of 25 up to 325. The system resulted in an average monthly squared irrigation deficit initially of 967 MCM reducing further to 0.0365 MCM. Fig.3 shows that fitness value reduces resulting in improvement in system performance. System performance improves significantly when the 14800
and
14600 14400 Fitness Values
St ≤ Smax t = 1, 2, … 12 (3) Where, Smin = Dead Storage of the reservoir in MCM and Smax = Maximum capacity of the reservoir in MCM.
14200 14000 13800 13600 13400 13200 13000
C. Over flow constraint. When the final storage in any month exceeds the capacity of the reservoir the constraint is given by: Ot = S t+1 - Smax
12800 0
50
100
150
200
250
300
350
Population Size
t = 1, 2, …. 12
Fig. 3. Fitness value for different Population size
and Ot ≥ 0
t=
1, 2, ..., 12
12960
(4)
12955
Where Ot = Surplus from the reservoir during the month‘t’.
F itn es s v alu e
12950
IV. MODEL APPLICATION AND DISCUSSION To apply GA to the above formulated model, average annual inflows into the reservoir have been used. The inflow scenarios represent, normal seasons in the region. The parameters used in applying GA to reservoir operation model were studied through sensitivity analysis by varying each of the parameters. The important input variables in the present GA model study are the monthly inflow into the reservoir system, the monthly irrigation demand, water supply and industrial demands. The main objective of the study is to compute the quantity of water that should be released to meet the monthly irrigation demand. Since the fitness function is based on the monthly irrigation demands (Dt), monthly inflow in the reservoir (It), and other monthly demands, so reservoir releases for irrigation (Rt), and initial storage (St) in the reservoir in monthly time step are chosen as decision variable. Thus twenty-four decision variables are considered. The fitness function evaluation gives the measure of the goodness of the fit of the string. After fitness
12945 12940
Series1
12935 12930 12925 12920 0.6
0.65
0.7
0.75
0.8
0.85
0.9
Probability of crossover
Fig. 4. Fitness value at different Probability of crossover
population size is increased up to certain population size.With further increase in population, the system still performes better but no significant improvement occurs. In the present study the significant point occurs at 250 and after that the performance has not improved significantly. Second important parameter affecting GA performance is the probability of cross over. Its effect on the system performance is studied by varying the probability of crossover from 0.6 to 0.9 with an increment of 0.01 and adopting the obtained optimal population of 250. Results shown in plot of probability of crossover against system performance in Fig. 4
- 186 -
International Journal of Engineering and Technology Vol. 1, No. 2, June, 2009 1793-8236
show that the system performance improves with the increase in probability of crossover till it reaches 0.75. After this value the system performance decreases with the increase in probability of cross over. A comparative plot of actual demand and GA model release for an average inflow shown in Fig.5 shows that the demand is almost satisfied with the releases obtained through GA model. To derive rule curve the results obtained are plotted in Fig. 6.The parameters used in applying GA to reservoir operation model were those selected after a thorough sensitivity analysis by varying each of the parameters. A population size of 250 and crossover probability of 0.75 are chosen to run the model. Fig. 6 shows the amount of water released for irrigation for each month. Irrigation releases in MCM
50 45 40 35 30 25 20 15 10 5 0 1
2
3
4
5
6
7
8
9
10
11
12
Months Starting from June Demand
storage to be maintained in the reservoir in each month starting from June under inflows. It is observered that storage is maximum at the start of October i.e. when monsoon has reaches its peak and consequently reduces to minimum in July to receive the next monsoon inflow, reduce flood damages and reduce water losses from the system. This region falls under the assured rainfall zone, so the minimum target level to be achieved is kept as dead storage and it is achieved at the start of monsoon. V. V. CONCLUSIONS The GA approach is applied to Upper-Wardha reservoir system to derive operating policies for the multipurpose reservoir systems with single objective. The sensitivity analysis of GA model applied to this particular reservoir suggests optimal size of population to be used 250 and probability of crossover of 0.75, to find optimal releases for Upper Wardha reservoir. The model resulted in an irrigation releases equal to irrigation demand. Minimum storages are observed in start of monsoon i.e. at the end of water year and maximum storage is observed when the monsoon reaches to its peak. These types of rule curves are expected to be useful in real life implementation of reservoir operation.
GA Release
REFERENCES
Fig. 5. Monthly Irrigation Demand and Releases as per GA model [1] 50
[2]
Irrigation Releases in MCM
45 40 35
[3]
30 25
[4]
20 15 10
[5]
5 0 1
2
3
4
5
6
7
8
9
10
11
[6]
12
Months Starting From Jun
[7]
R e s e r v o ir A c tiv e S to ra g e in M C M
Fig .6. Monthly Irrigation releases at different Inflows.
[8]
500
[9]
450 400 350
[10]
300 250 200
[11]
150 100 50
[12]
0 0
2
4
6
8
10
12
Months Starting From Jun
[13] Fig. 7. Monthly reservoir storages at different Inflows.
The operating rule curve obtained for Upper Wardha Reservoir is shown in Fig. 7. This rule curves show the final
- 187 -
Oliveira, R. and Louckas, D (1997), “Operating rules for multireservoir systems”, Water resources research J., vol. 33(4), pp.839-852. Wardlaw and Sharif (1999), “Evaluation of genetic algorithms for optimal reservoir system operation”, J. water resource planning management., vol. 125(1), pp 25-33 Yeh, W., (1985), “Reservoir management and operations models: A state-of-the-art review”, Water Resources Research J., vol. 21(12), pp.1797-1818. Labadie John W. (2004), “Optimal operation of multireservoir systems: state-of-the- art review", Journal of water resources planning and management, March/April, 2004, pp 93-110. Holland, J. H., (1975), “Adaptation in natural and artificial systems”, University of Michiyan Press annarbov, ’ Cambridge Mass Goldberg, D.E. (1989), “Genetic algorithms in search optimization and machine learning”, Addison-Wesley, Reading, Mass. Michalewicz, Z (1996), “Genetic algorithm+data structures = evolution programmes”, Springer, Berlin. Sharif and Wardlaw (2000), “Multireservoir system optimization using genetic algorithms-Case study”, J. computation in civil engineering 14(4).pp-255-263. Ahmed Juran Ali., Arup Kumar Sarma (2005), “Genetic algorithm for optimal operation policy of a multipurpose reservoir”, Water resources management, vol-19, pp 145-161. Janga Reddy M.and Nagesh Kumar D. (2005), “Multiobjective differential evolution with application to reservoir system optimization”, Journal of Computing in Civil Engineering, pp-861-878. Jotiprakash, V and Ganeshsan shanthi (2006), “Single reservoir operating policies using genetic algorithm”. J. of Water Resources Management (2006) vol.20: 917–929 Hashemi, M.S., Barani, G.A, Ebrahimi, H., (2008), “Optimization of reservoir operation by genetic algorithm considering inflow probabilities (Case Study: The Jiroft dam reservoir)”, J. of applied science. vol. 8(11), pp. 2173-2177. Rao S. Govindraju and Ramchandrarao A. (2000) “Water science and technology library –Artificial neural network in hydrology” www.books.google.com/books pp142