HYPERCOMPLEX AUTO- AND CROSS-CORRELATION OF COLOR IMAGES Stephen J. Sangwine
Todd A. Ell
The University of Reading, Whiteknights, Reading, RG6 6AY, England Email:
[email protected]
5620 Oak View Court, Savage, Minnesota, USA Email:
[email protected]
Abstract
3. Color image representation
Autocorrelation and cross-correlation have been defined and utilized in signal and image processing for many years, but not for color or vector images. In this poster we present for the first time a definition of correlation applicable to color images, based on quaternions or hypercomplex numbers. We have devised a visualization of the result using the polar form of a quaternion in which color denotes quaternion eigenaxis and phase, and a grayscale image represents the modulus.
A color image in rgb color space may be represented using hypercomplex numbers by encoding the red, green and blue components of the rgb value as a pure quaternion:
1. Introduction
4. Hypercomplex correlation formula
As part of our work on Fourier transforms of color images using hypercomplex, or quaternion Fourier transforms [1], we have considered the problem of defining the autocorrelation of a color image, and the cross-correlation of two color images. We show in this poster that there is a natural extension of the definition of correlation from the case based on complex numbers to one based on hypercomplex numbers or quaternions (discovered by Hamilton in 1843 [2]), and we present a visualization of the hypercomplex result.
We use the standard definition of cross-correlation of two images e.g. [3], but both images and the result are hypercomplex, and the conjugate is hypercomplex:
where r(x, y) is the red component of the color image and similarly for the green and blue components. The reason for choosing this representation is that the rgb values represent a 3-space vector (a point in rgb space), as does the pure quaternion.
Conjugate and modulus: q = a√ − ib − jc − kd q = a + ib + jc + kd |q| = a2 + b2 + c2 + d2 If a = 0 the quaternion is a, b, c, d real, pure, and if |q| = 1 it is a i, j, k complex: unit quaternion. i2 = j 2 = k 2 = ijk = −1 Scalar/vector form: q = S(q) + V (q) ij = k jk = i ki = j ji = −k kj = −i ik = −j where S(q) = a, and V (q) = ib + jc + kd. c S. J. Sangwine and T. A. Ell, 1999.
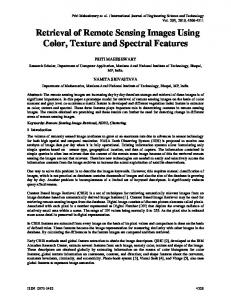
Autocorrelation of the ‘Boat’ image (128 × 128 pixels). Left to right: original image, modulus, phase, eigenaxis. (Original images from the USC-SIPI image database.)
Our current implementation is based on explicit evaluation and is O(N 2M 2). We preprocess the images to subtract the dc value (essential to obtain meaningful phase).
• The modulus, eigenaxis and phase images are displayed with zero shift at the center. • The dc component was subtracted from all pixels. • The autocorrelation (and visualization) give sensible results. • The center pixel of the autocorrelation images (corresponding to zero shift) has a phase value of zero (red) and an undefined eigenaxis (represented by mid-gray) as well as maximum modulus. • Symmetry is apparent in phase and eigenaxis.
5. Visualization
7. Results – autocorrelation of test images
r(n, m) =
N −1 M −1 X X
f (p, q)g((p − n) mod N, (q − m) mod M )
p=0 q=0
Quaternion polar form: q = |q|eµΦ
8. Results – cross-correlation
Autocorrelation of the ‘Lena’ image (128 × 128 pixels). Left to right: original image, modulus, phase, eigenaxis.
f (x, y) = ir(x, y) + jg(x, y) + kb(x, y)
2. Hypercomplex numbers A quaternion (Cartesian):
6. Results – autocorrelation of natural images
Modulus: log grayscale: log(1 + |q|) M= log(1 + K)
µ is a unit pure quaterwhere K is the largest nion, and 0 ≤ Φ ≤ π. µ is modulus in the image. the eigenaxis and Φ is the Phase: hue of ihs color eigenangle or phase: space [4]. µ = V (q)/|V (q)| Eigenaxis: using unit rgb vectors centered at mid|V (q)| −1 Φ = tan gray. S(q)
Autocorrelation of checkerboard image with blue (32, 64, 255) and yellow (255, 255, 32) squares. Left to right: original image; modulus; phase, eigenaxis.
Cross-correlation of two checkerboard images. Top row: original images; bottom row; left to right: modulus; phase; eigenaxis.
9. Conclusions • Auto- and cross-correlation can be extended to color images using hypercomplex numbers. • Worth pursuing a hypercomplex Fourier transform realization (for practical speed and numeric accuracy). • Cross-correlation could be utilized in applications like: object location, image registration using color images.
References [1] S. J. Sangwine and T. A. Ell. The discrete Fourier transform of a colour image. In J. M. Blackledge, editor, Second IMA Conference on Image Processing: Mathematical Methods, Algorithms and Applications, De Montfort University, Leicester, UK 22-25 September 1997, pages –, Chichester, 1998. Horwood Publishing for Institute of Mathematics and its Applications. In Press. [2] William R. Hamilton. Elements of Quaternions. Longmans, Green and Co., London, 1866. [3] R. C. Gonzalez and R. E. Woods. Digital Image Processing. AddisonWesley, Reading, MA, third edition, 1992. Reprinted with corrections 1993.
Autocorrelation of colour blocks image. Left to right: original image; modulus; phase, eigenaxis.
Poster presented at IEEE International Conference on Image Processing (ICIP’99), Kobe, Japan, Thursday 28 October 1999. 1
[4] H. Palus. Representations of colour images in different colour spaces. In S. J. Sangwine and R. E. N. Horne, editors, The Colour Image Processing Handbook, Optoelectronics Imaging and Sensing, chapter 4, pages 67–90. Chapman and Hall, London, 1998. Typeset with LATEX 2ε