Hyperspectral Algorithm Development for Military Applications: A Multiple Fusion Approach Peter WT Yuen & Gary Bishop Email:
[email protected] BAE SYSTEMS, Advanced Technology Centre, Sowerby Building, FPC 267, PO Box 5 Filton, Bristol, BS34 7QW, UK
Abstract Developments of long range target detection techniques have been a military priority, especially against very low observable targets like deeply hidden vehicles. Not surprisingly, the need for the development of a highly efficient passive detection system with sensitivity capable to detect extremely low cross-section objects like mines is even more demanding. In this paper, we summarise the achievement of a 3-year DTC hyperspectral algorithm development (HAD) project for the research of a near-real time long range detection technique using hyperspectral remote sensing technology. The main emphasis of this project has been on the detection of low contrast targets. One of the main deliverables from the project has been the demonstration of prototype software, which integrates various components developed within the programme, into a more robust, and, high performing anomaly detector. Unlike conventional multiple approach fusion [MAF] technique, this prototype fuses several detectors in the algorithm level as well as in the detector output. This mixture modelling and spectral unmixing fusion in 2-level [MUF2] algorithm, was found to be extreme efficient with demonstrated detection performance better than a conventional anomaly detector by orders of magnitude, even in its prototype form.. The nominal processing time of MUF2 for a 20K pixel imagery takes ~2minutes by using a 2.5G PC on the Matlab platform. Keywords: multiple approach fusion, spectral unmixing, mixture modelling, subpixel target detections, mine detection, hyperspectral anomaly detection
Introduction: The HAD project -- Aims Hyperspectral imaging (HSI) technique for detecting difficult/low contrast targets from a long range has been a subject of active research for over a decade. One of the main issues in producing good detection performance is the complex probability distribution functions (pdf) of HSI data sets, particularly those which include natural materials. These may vary from being Gaussian-like to having a fat-tail distribution1. This is more so when only a very limited size of the imagery is being analysed. The large variation of this ‘local
statistics’ of the analysed data, makes it very difficult to be fitted into any statistical detector model, and subsequently the detection performance is strongly compromised. The purpose of the hyperspectral algorithm development (HAD) project is two-fold, one is to understand fundamental properties of HSI technology, and subsequently to design solutions for an appropriate detector which can detect low contrast targets in a range of background conditions. The approaches adopted in this project have been multiple, using a range of algorithm techniques as well as other technologies
3rd EMRS DTC Technical Conference – Edinburgh 2006
B20
such as the removal of atmospheric effects which can corrupt image quality. 1. Atmospheric correction By using a model based atmospheric correction package ATCOR2, it has been shown that the removal of atmospheric interferences enhances the spectral contrast of the image by an average of about 20%, when compared with the uncorrected radiance data3. Classification results show that the separation of classes has been enhanced by almost a factor of 10 after atmospheric correction. 2. Mixture modelling HSI data of natural scenery exhibits strong multimode behaviour, which can be clearly seen as multi-clusters of data in eigenvector space as shown in figure 1. The image (150x150 pixels) shown is a vegetation field consisting of various crops. These have large variations in their inherent spectral reflectance characteristics which manifest themselves as a multimode distribution of radiances. This can be clearly seen in figure 1(c) where a Gaussian fit of the histogram for a typical spectral band consists of at least three components. This multimodal behaviour of HSI data has become a common feature for all data sets analysed at our laboratory, particularly when the imagery covers a very inhomogeneous background. Much of our research in this area has been the use of the almost ‘standard’ mixture of Gaussian (MOG) approach4,5 for data segmentation, such that the pixels are clustered together and their distribution can be described by a single set of parameter. Various forms of mixture modelling including a Student’s-t distribution, implemented under the stochastic expectation-maximisation (SEM) formulation, variational Bayesian and minimum description length (MDL) frameworks have been investigated within the scope of the HAD project.
The significance of mixture modelling in the anomaly detection of real HSI data can be seen in figure 2, where the receivers operation characteristics (ROC) of two detections, both of which use the same anomaly RX6 detector but one treats the whole data set as a single component (red curve) while the other has segmented the data into two Gaussian components appropriate for this data set. The imagery of this subset has a majority of vegetation background with man-made objects hidden along the tree lines and in a strip of clearing of about 100m wide.
a)
b)
c)
Figure 1 shows (a) the RGB image of the Barrax vegetation field, (b) the radiance data projected on eigenvector space and (c) the Gaussian fit
3rd EMRS DTC Technical Conference – Edinburgh 2006
B20
(blue) of the histogram of one of the spectral band (red).
Figure 2a shows the pixels based ROC curve (figure 2a) in which every pixel counts as a detection, is seen to be substantially improved when 2 Gaussian components (blue curve) are used for the anomaly detection in this data set. The result is even more striking in the number of targets detected which indicates almost ~ 2 order of magnitude improvement of PFA reduction in the mixture modelling detection as shown in figure 2(b). In this detection mode, any detected pixel that falls into the target area will be counted as detected. Pixel based ROC
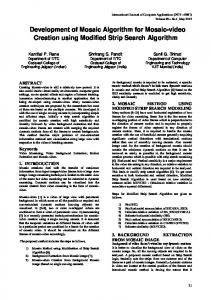
application, have been thoroughly studied under the HAD programme7,8. It has been concluded that, statistical methods like conventional independent component analysis (ICA) and matrix factorisation (MF), are not suitable for HSI unmixing due to the strong dependency of the endmembers (EM) find in natural environment, which violates the basic assumptions of these techniques. Subsequently, this EM dependency obstacle has been partially solved by using a wavelet decomposition technique to sparse the spectral data with an effect to reduce their correlations and dependency. This has dramatically improved the applicability of ICA/MF based techniques for HSI unmixing, and the EM spectra can then be successfully extracted from a synthetic mixture data set as shown in figure 3. WDICA test(1) MI=7.12 Source(5) 1 Original Source ICA [0.284] WDICA [0.082]
EM1 0.9
0.8
0.7
0.6
RX
a)
Original spectra
0.5
Mixture model RX
A
Conventional ICA/MF
0.4
0.3
0.2
Target based ROC
0.1
0
0
0.5
1
1.5
2 Wavelength µ m
2.5
3
3.5
4
Sparsed ICA/MF
WDICA test(1) MI=7.12 Source(2) 1 Original Source ICA [0.284] WDICA [0.082]
EM2
0.9
~100 times
0.8
0.7
0.6
0.5
0.4
0.3
0.2
b)
0.1
Figure 2 shows the ROC curves in (a) pixel based and (b) number of targets detected modes by using the RX detector for the data that has (blue) and has not (red) been segmented into appropriate Gaussian components.
3. Spectral Unmixing (SU) algorithms There have been two main streams of unmixing approaches within the HSI community, namely, statistical and geometric based methods. The pros and cons of these two unmixing approaches, together with their applicability for HSI
0
0
0.5
1
1.5
2 Wavelength µ m
2.5
3
3.5
4
Figure 3 illustrates the effectiveness of EM extraction by wavelet sparsed ICA/MF (blue) and compared with conventional ICA/MF (dashed). Note that the EMs that extracted by sparsed ICA/MF agree very well with the original spectral (red) used for the synthetic mixing.
Alternative statistical method that converts the unmixing problem into a classification one based on a stochastic mixture model (SMM)9, has been studied and it has been shown to be inefficient particularly for the
3rd EMRS DTC Technical Conference – Edinburgh 2006
B20
imagery with large intrinsic dimension (EM>8). Geometric based unmixing finds the pure basis pixels in the scene by means of searching the simplex of the data cloud in a multidimensional space. The sensor noise and multiple scattering in the real HSI data ‘diffuse’ the simplex and inevitable make the search more difficult. In the very worst circumstance when the EMs are strongly intermixed, geometric based searching algorithm will not be able to find the correct EM at all. A convex cone analysis10 (CCA) method which in theory is capable of finding the convex corners outside of the data cloud has been investigated, but an extensive and sophisticated optimisation is needed to solve for the combinatorial problem. This has not been attempted in this programme and instead, a modified version of the approach that projects a centred data onto a plane and search for the longest vector11 has been adopted. A combined geometric and statistical unmixing (GESU) method, which shows very promising unmixed results by initialising the wavelet sparsed ICA/MF using the EMs found by geometric method, has been established. Unfortunately, this GESU algorithm is very noise sensitive and that it requires enormous computational requirement: it takes ~ 4 hours to unmix a ~20K pixel imagery by using a P4 2.5G PC. 4. SU for HSI detection One common usage of SU result for target detection is to allow a better estimation of the background and the target covariance matrix through a classification of the abundance maps into two classes11. An alternative approach has been the extraction of features from the unmixed abundance map, and subsequently a matched filter detection is carried out12. This SU adaptive feature extraction and target detection (SAFED)13 algorithm has been shown to be extreme effective, provided a good SU has been attained. For very low observable objects like camouflaged mines, targets are
strongly concealed by the background pixels and the unmixed abundance map of these mines will contain a large number of background pixels, thereby inducing a large false alarm in the feature extraction method. An alternative approach is to utilise SU for characterising the background, which is expected to be less sensitive to small fluctuations of unmixing accuracy. The significance of background characterisation in anomaly detection is illustrated in figure 4 in which two detections, both of which are using the same RX detector, but one (red curve) assumes all pixels in the imagery are background and the other (blue curve) has excluded the target pixels. The target/ background ratio for this imagery is ~1%, small enough to be ignored in many circumstances. However, it is shown from figures 4 (a) & (b) that this small amount of target pixels cannot be neglected in anomaly detection, with ~2 orders of magnitude difference in detection performance between these two cases. The data set utilised in this example is the same as that employed in figure 2. Pixel based ROC
Full image as background
a)
Targets excluded Target based ROC
~ 100 times
b) Figure 4a&b show the ROC curves of 2 detections both of which use the same RX detector, but one (red) assumes all pixels in the
3rd EMRS DTC Technical Conference – Edinburgh 2006
B20
imagery as background and the other (blue) has excluded the target pixels. (a) pixel based and (b) target based ROC. The target/background ratio is ~1% in this imagery.
5. Multiple approach fusion (MAF) The objective of MAF is to utilise all information from various detectors to derive a better boundary between the outliers and the background. Conventionally, this has been achieved by fusing a set of detector results either using logical operator, or, to estimate the joint detection statistics using a pre-defined model11. Within the HAD project the MAF is realised in two different levels: in the algorithm level as well as in the detector output. The need of a low level fusion for a ‘practical’ anomaly detector has been demonstrated quite clearly in previous sections. Here, the mixture modelling and spectral unmixing is fused (MUF1) within the anomaly detector and subsequently, the detector results obtained from SU, RX and MUF1 are then fused together using logical operator (MUF2). The effectiveness of this prototype algorithm for target detection can be seen in figure 5, which shows ~2 orders of magnitude better detection than the RX in this data set (the same data set as that employed in figure 2). The processing speed of MUF2 has not been optimised, and it takes ~2 minutes to process a 20K pixels imagery (118 bands) using a 2.5G PC on a Matlab platform.
shown to be ~ 10 times better than the RX. The two rows of metal plates are seen to be detected successfully by MUF2 at the PFA~0.1%, in great contrast to the RX which only manages to detect ~50%, as shown in the detection maps of figure 8.
Figure 5 shows the detection result of MUF2 and to compare with the conventional RX. The data set is the same as that employed in figure 2. MUF2 takes ~2 minutes to process for this 20K pixel imagery. Metal plate location
RGB mine image
20 40 60 80 100 120 140 160 10
6. MUF2 for metallic debris detection The detection cross section of small metallic debris is almost an order of magnitude less than that of military vehicles due to their small size and 2-dimensional structures. Typical spectral contrast of small metal plates is about 2% w.r.t. the background, almost 3 times less than that of military vehicles hiding in vegetation background. Figure 6 shows a data set collected for an array of camouflaged small metal plates laid on the surface of a track in field trials in a desert environment, and in figure 7 the detection results by MUF2 is
20
30
40
50
60
70
80
90
100
a)
b)
Ground Photograph
Figure 6 shows the (a) RGB image of the small metal plates and (b) their ground photographs and locations. The background is Anza Borrego desert, San Diego.
MUF2
RX ~10 times
3rd EMRS DTC Technical Conference – Edinburgh 2006
B20
Figure 7 shows the ROC curve (pixel based) for the detection of small metal plates indicating ~ an order of magnitude better detection by MUF2 (red) than the RX (blue). MUF2 detection map
PFA=1e-3
RX detection map
PFA=1e-3 Camouflaged metal plates
Acknowledgements The authors would like to thank for the financial support of this work by the EMRSDTC established by the UK MOD.
References 1)
2)
a)
b)
Figure 8 shows the detection map of small metal plates at the PFA ~0.1% by (a) MUF2 and (b) RX. Note that MUF2 detects almost all camouflaged targets (circled) but the RX only detects ~50% of them. Green=false alarm, brown=detected targets, pale blue=missed targets.
Conclusions This study has involved an in-depth understanding of HSI technology with respect to the development of a range of novel techniques for the detection of difficult/low contrast targets. Research efforts have been focused on critical technological areas of mixture modelling, spectral unmixing, background characterisation and multiple algorithm fusion. The achievements from all these components have converged into a robust and efficient anomaly detector MUF2, which forms to be one of the main outputs of the project. The detection performance of MUF2 has been shown to be independent of background types and statistics, capable to achieve very high detection of deeply camouflaged and low observable objects (e.g. >90% detection at PFA ~0.1% in figure 5), within ~minutes of processing time. The MUF2 technology is a ‘proof of concept’ prototype, and, a small pullthrough programme is needed to exploit it for practical application. Scientific outputs from the HAD project includes 14 conference publications, 2 journal papers and another two more in preparation.
3)
4)
5)
6)
7)
8)
9)
10)
11)
12)
13)
D Manolakis, G Shaw ‘Detection algorithms for hyperspectral imaging applications’, IEEE signal processing magazine, V19, P.29-43, 2002 Richter R, and D. Schlapfer, "Geo-atmospheric processing of airborne imaging spectrometry data. Pt2: atmospheric/topographic correction" Int. J. Remote Sensing 23:2631-2649 (2002) Peter Yuen, G Bishop ‘Enhancements of target detection using atmospheric correction preprocessing techniques in hyperspectral remote sensing’ SPIE: Military remote sensing, London. Vol5613 p.111118, 2004 Willis, C. J., “Mixture Models for Anomaly Detection in Hyperspectral Imagery”, Proceedings of SPIE, Military Remote Sensing, Vol. 5613, 2004 Willis, C. J., “Comparison of anomaly detection methods for hyperspectral imagery”, Proceedings of SPIE, Military Remote Sensing, Vol. 5988-12, 2005. Yu Xiaoli, Reed IS, Stocker AD, "Comparative performance analysis of adaptive multispectral detectors" IEEE Trans Sig. Pro. V41, No8, p.26392655, 1993. Peter Yuen, A Blagg & G Bishop ‘The effectiveness and limitations of geometric and statistical spectral unmixing techniques for subpixel target detection in hyperspectral remote sensing’ SPIE European 598813, 05 Peter Yuen, Gary Bishop, Adrian Blagg ‘Geometric and Statistical Spectral Unmixing for Subpixel Target Detection’ Journal Defence Science Vol10 No(3), DDT9/21-26 2005. Eismann MT, Hardie RC ‘Stochastic spectral unmixing with enhanced EM class separation’ Applied Optics V43, p.6596-6608, 2004. A Ifarraguerri, CI Chang ‘Multispectral and hyperspectral image analysis with convex cones’ IEEE Trans Geoscience & remote sensing V37, P.756-770,1999. J. Nascimento and J. Dias, ‘Vertex component analysis: a fast algorithm to unmix hyperspectral data’, IEEE Transactions on Geoscience and Remote Sensing, vol. 43, no. 4, pp. 898-910, 2005 Stein D, Beaven S, Hoff L, Winter E, Schaum A, Stocker A "Anomaly detection from hyperspectral imagery" IEEE Sig Proc Mag V19, p.58-69, 2002. Peter WT Yuen & G Bishop ‘Adaptive Feature Extraction Techniques for Subpixel Target Detections in Hyperspectral Remote Sensing’ SPIE proceeding: Military remote sensing, London. Vol5613 p.99-110, 2004.
3rd EMRS DTC Technical Conference – Edinburgh 2006
B20