Hyperspectral clustering and unmixing for studying the ecology of state formation and complex societies Justin D. Kwonga , David W. Messingera , and William D. Middletonb a Center
for Imaging Science, Rochester Institute of Technology, 54 Lomb Memorial Dr., Rochester, USA 14623; b Department of Material Culture Sciences, Rochester Institute of Technology, 18 Lomb Memorial Dr., Rochester, USA 14623 ABSTRACT
This project is an application of hyperspectral classification and unmixing in support of an ongoing archaeological study. The study region is the Oaxaca Valley located in the state of Oaxaca, Mexico on the southern coast. This was the birthplace of the Zapotec civilization which grew into a complex state level society. Hyperion imagery is being collected over a 30,000 km2 area. Classification maps of regions of interest are generated using K-means clustering and a novel algorithm called Gradient Flow. Gradient Flow departs from conventional stochastic or deterministic approaches, using graph theory to cluster spectral data. Spectral unmixing is conducted using the RIT developed algorithm Max-D to automatically find end members. Stepwise unmixing is performed to better model the data using the end members found be Max-D. Data are efficiently shared between imaging scientists and archaeologists using Google Earth to stream images over the internet rather than downloading them. The overall goal of the project is to provide archaeologists with useful information maps without having to interpret the raw data. Keywords: remote sensing, hyperspectral, clustering, classification, unmixing, Oaxaca, archaeology, Zapotec
1. INTRODUCTION The state of Oaxaca is located in the southern coast of Mexico. In its center lies the Oaxaca Valley and the state’s capital, Oaxaca City. The state is primarily made up of mountains that peak at altitudes of 2,500 m or greater. The Y shaped Oaxaca valley is the largest of the valleys and one of the few areas of level land, with an average elevation of 1,500 m. The climate of the valley is temperate and semi-arid, with 550 mm of annual rainfall.1 The valley is subdivided into the three regions of Etla, Tlacolula and Valle Grande, which make of the branches of the Y shape. The Zapotec civilization emerged from the Oaxaca Valley. Around 500 BC, they began to develop by means of conquest and expansion. By 250 BC, they had become the earliest state level society in Mesoamerica, ruled from Monte Alb´an, located 9 km to the west of Oaxaca City. The Zapotec civilization was the first to construct astronomically oriented buildings, build adobes, use stone masonry and lime plaster among many other things. At one point, there were over 500,000 Zapotecs.1 The Zapotec state lasted roughly 1,000 years until it collapsed in 750 AD, becoming subdivided into politically hostile groups. It was in this condition that the Spaniards discovered and eventually conquered Oaxaca. Two aspects of the Zapotec civilization have been of great interest to archaeologists: understanding the process of primary state formation; and understanding the relationship between complex societies and their environments. The process of state formation has two theories that fall at opposite ends of a spectrum. One theory attributes the formation to external, highly environmentally deterministic reasons. The other concentrates on socioeconomic processes internal to the society. The relationship of the Zapotecs and their environment is key in understanding the civilization’s evolution. To what extent the Zapotecs impacted their environment or whether Further author information: (Send correspondence to Justin D. Kwong) Justin D. Kwong: E-mail:
[email protected], Telephone: 1 267 994 9067 David W. Messinger: E-mail:
[email protected], Telephone: 1 585 475 4538 Imaging Spectrometry XIV, edited by Sylvia S. Shen, Paul E. Lewis, Proc. of SPIE Vol. 7457, 74570E · © 2009 SPIE · CCC code: 0277-786X/09/$18 · doi: 10.1117/12.826354
Proc. of SPIE Vol. 7457 74570E-1
oJIc!afl U
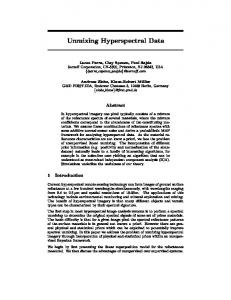
Figure 1. Map of Mexico with preliminary study region highlighted in red generated in Google Earth
it was the opposite effect of the environment controlling the Zapotecs reveals much about the civilization. This understanding has a profound impact on modern day society, as controversy circles around the human impact on the earth. There have been previous attempts to understand these two major factors of Zapotec civilization using full coverage surveys of the Oaxaca Valley: one done by Blanton et al. (1982) and another by Kowalewski et al. (1989). They were both conducted under the “Prehistory and Human Ecology of the Valley of Oaxaca” project. Other research that has been conducted include Anne Kirkby’s (1973) study of land and water resources, climatic studies (Byers 1967), demographic studies of modern Valley communities (Kappel 1977), and ethnographic studies of maize consumption (Granskog 1974; Kappel 1977). These other projects were aggregated into Nicholas’ “Land Use in Prehispanic Oaxaca”.2 All this research was conducted using the technology available at the time, which was heavily based on ground level observations and surveys. In this project, it is proposed that remotely sensed imagery will extend the observational scope of the archaeologists as well as make certain useful features much more efficiently and thoroughly gathered. This project is part of a larger present day study of Oaxaca and the Zapotec that hopes to gather enough information to continue the study well into the future: The Chichicapam Valley Regional Archaeological Survey directed by PI Middleton (funded by the National Geographic Society), and the Effects of Human Impact and Climate Change on Ancient Mesoamerican Landscapes project, directed by CI Joyce (funded by the University of Colorado at Boulder, Innovative Grants Program).
2. PREVIOUS WORK Satellite based remote sensing has been attempted numerous times in the field of archaeology. Due to accessibility and affordability constraints, most studies have been relegated to moderate spatial resolution multispectral sensors, such as Landsat. Much of the literature relied on visual inspection for finding particular features, thus the general desire of archaeologists was for higher spatial resolution. A primary example of work done under these conditions was conducted in the study of the ancient Mayans by Saturno et al. (2007)3 using Ikonos. Saturno et al. used numerous visual inspection techniques, including false color PCA and multiple spatial filters. The technique that garnered the most valuable results was the Normalized Difference Vegetation Index (NDVI). Ruins located deep in the rainforest stressed the plant life around them, noticeably reducing the NDVI score. In archaeology, these features are widely known as crop marks in which vegetation is stressed by underlying structures or invigorated by excavated channels. The team hypothesized that limestone and lime plaster used
Proc. of SPIE Vol. 7457 74570E-2
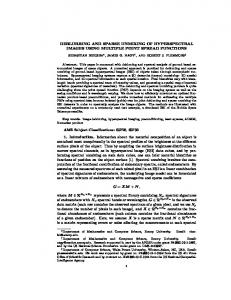
in the construction of the structures seeped into the soil inhibiting plant growth. The success of this project demonstrates the utility of remote sensing for archaeology study. However, the relatively small research area and high spatial resolution (illustrated in Figure 2) utilized by Saturno et al. sets it apart from the Oaxaca project.
Figure 2. Image of ancient Mayan site using Hyperion (left) and Ikonos (right) demonstrating difference in spatial resolution.3
A Land use-cover change (LUCC) study very similar to this project was conducted in 2003.4 The study used Landsat ETM+ imagery to classify much of Oaxaca into a hierarchy of categories and subcategories. This was accomplished through a thorough analysis by vegetation, mapping and image interpretation experts. Classifications were verified using high spatial resolution aerial photos of particular regions. Velazquez et al., Saturno et al., and similar research share the common approach of using visual inspection of high-resolution imagery for analysis. There are obvious drawbacks to this approach, the primary requirement being experts that are knowledgeable about the area. On top of that, they must also be skilled in image interpretation or have experts assisting in that task. Visual inspection and feature detection also requires a great deal of time, especially for a research area the size of Oaxaca, even at 30 meter resolution. Visual enhancements like filters, contrast enhancement, false color imagery, etc. do not take full advantage of spectral information, limiting analysis to at most three layers of information in the form of RGB color images.
3. DATA COLLECTION 3.1 Hyperion The primary task of this project will be exploitation of hyperspectral imagery from the Hyperion sensor aboard Earth Observing-1 (EO-1). EO-1 was launched in 2000 as a demonstration/validation mission. After a scheduled one year mission, EO-1 began an extended mission to collect and distribute additional imagery. Through NASA funding, the Oaxaca study will image approximately 30,000 km2 of area in the state of Oaxaca. Table 1 shows Table 1. Hyperion Specifications
# Bands Spectral Sensitivity Sensor Type Scene Width Scene Length Pixel Resolution
220 0.357-2.576 μm 10 nm bandwidth Pushbroom 7.7 km 42 km or 185 km 30 m
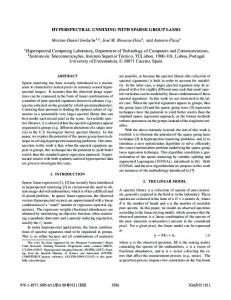
some of the more relevant information about the Hyperion sensor. Using the extended 185 km scene length, the study area can be covered using 23 separate flight lines of Hyperion. Figure 3 shows the current collection (as of July 1, 2009) of geo-rectified imagery rendered into a single image. The shorter strips in the scene were the first images collected and are not the full scene length. Once this error
Proc. of SPIE Vol. 7457 74570E-3
Figure 3. True color renderings of the Hyperion data collected to date
was discovered, NASA corrected the tasking to collect full scene length images. Data continues to be collected in an attempt to acquire full coverage of the research area. NASA has provided a convenient website from which various preprocessing levels of the imagery can be downloaded as compressed files.
4. METHODOLOGY The overarching goal of this work is to implement semi-automated classification algorithms to rapidly process large areas of data. This is opposed to the time consuming task of visual inspection by a team of experts conducted in previous studies. It also allows archaeologists to be sent data while in the field, typically at remote locations. This alleviates the issue of gathering experts prior to already hectic field expedition planning to conduct a thorough analysis of imagery. Data collected while archaeologists are in the field can be quickly processed and sent to them to be used while at locations of interest.
4.1 Satellite Tasking After accessing all the locations of interest, the archaeologists on the project found the latitude/longitude of the four corners of a box containing the study area. In order to task Hyperion through the USGS, the center points of each flight line are needed. It was found that 23 lines with minimal overlap could cover the entire region. Before choosing any points, it was discovered that using the Universal Transverse Mercator (UTM) coordinate system would provide a more rectilinear grid than latitude/longitude. It accomplishes this by dividing the earth into narrow north to south running columns, each with its own gird layout. Oaxaca conveniently falls entirely into
Proc. of SPIE Vol. 7457 74570E-4
UTM zone 14, reducing the small amount of error that occurs at the edges of each zone and making conversion of all points straightforward. To calculate the centers of each flight line, the corners of the study area were converted into UTM coordinates and the very middle coordinate found. A rough estimate of the angle relative to north and south was calculated for the satellite’s orbital path using sample geo-rectified images from the USGS. A line of 23 points was calculated with the study region’s middle coordinate as the center point and having a slope perpendicular to the orbital path angle. The points were spaced using the swath width minus a 100 meter overlap suggested by the USGS in order to have contiguous data. Incorporating the slope allows the flight lines to fall into an even box; i.e., if the slope was not used and the points placed in a straight line, the top and bottom of the collected region would be irregular because each flight line would be offset from the next. This is not of great importance but it does avoid having the ends of each flight line be surrounded by areas with no collected data. The center points were then converted back into lat./lon. for submission to the USGS. All these calculations were done using IDL with the coordinate conversion functions that already exist in the software.
4.2 Preprocessing NASA provides a GNU zip file which uncompresses as 242 separate geotiff images. A program developed by White (2007) for his study of archaeological features in the American southwest5 creates a single data cube for analysis. This program was re-programmed, eliminating the Graphical User Interface (GUI) so that data cubes could be generated in a batch process. Specialized ROI generation and data retrieval programs were written due to the enormity of the data. Each full length image is approximately 2,000 by 7,000 pixels including the zero data that surrounds the geo-rectified (rotated) active scene, along with 242 bands. All routines were specialized to only gather active pixels (not the zero border).
4.3 Processing A flight line that runs through the Oaxaca valley east of the capital city was chosen because it includes numerous features of the valley such as urban cities, farming communities and mountainous regions. The area has also been moderately ground truthed via ground level GPS tagged photographs taken at points of interests and regions of environmental change. As a preliminary product, clustering algorithms were applied to a region of interest in the scene. The standard K-means algorithm was used as well as a novel algorithm called Gradient Flow.
4.4 Gradient Flow Developed by Basener et al. (2008),6 Gradient Flow provides a novel approach to remote sensing based on graph theory. Rather than finding class means and points that surround them, Gradient Flow identifies classes by pixels that are densely packed together in a multidimensional space. Figure 4 is a one dimensional illustration of how values of high density are likely class centers. The graph shows a theoretical case of three materials with different grey values. The assumption is that each class will have enough pixels of a certain grey value to produce a maxima in the histogram. The solid vertical lines denote minima in the histogram that would serve as the threshold that separates one class from another. Gradient Flow, conceptually, is a hill climbing algorithm where pixels travel uphill toward a “density peak”, denoted by the dotted lines, and are classified with whichever peak they travel to. For spectral imagery, the algorithm first computes the spectral Euclidean distances between every pixel. A user-defined number of nearest neighbors are found for every pixel. The distances for each pixel’s nearest neighbors are summed to calculate its total distance, i.e., if a pixel is surrounded closely by many other pixels, its total distance will be small while outlying pixels will have a large total distance. Each pixel’s density is defined using the equation (1) K = e−D∗D where K is the density and D is the total distance. Equation 1 transforms the linear distances into a decaying exponential where pixels with close surrounding neighbor pixels (i.e., high density pixel) have a high K value. A smoothing takes place where the density of each pixel is averaged with density of its neighbors. This removes local variation due to noise or any other factor besides variation between classes. Next, the densities of each pixel’s nearest neighbors are assessed. If a neighbor has a higher density, that pixel is assigned that neighbor’s
Proc. of SPIE Vol. 7457 74570E-5
250
350
D
450
'4 -1Figure 4. Example histogram where the peaks are likely class centers
index and value. This step is repeated with a pixel being assigned to its more dense neighbor until assignments no longer have more dense neighbors. The product of this algorithm is a class map where each class is represented by the single densest pixel of that class. An advantage of this algorithm is that it is unsupervised like K-means and IsoData. Unlike K-means, it determines the number of classes in the image along with the class map. Gradient Flow has not been fully utilized for remote sensing which can be considered an advantage as well as a disadvantage. This study will be one of the first to evaluate the impact of changing its two main parameters: the number of nearest neighbors and the amount of smoothing. The major issue with Gradient Flow is that the calculation of the Euclidean distances between every point is highly computationally intensive. Preliminary work has shown that not only does this process take a great deal of time but it also can potentially reach the limit of the software and hardware memory.
4.5 Spectral Unmixing The archaeologists on the project have shown a greater interest in observing pixel abundances rather than the single classifications generated from clustering. The Max-D algorithm was chosen to locate End Members (EMs) for unmixing. Developed at RIT’s Center for Imaging Science, described by Lee,7 Max-D selects the two points of maximum euclidean distance (in spectral space) as the first two EMs. All the points in the image are then projected onto the hyper-plane that is orthogonal to the vector connecting the first two points. The point that lies furthest from the first two points, which are now projected on top of each other in the hyper-plane, is selected as the third EM. The points are collapsed again and subsequent EMs are chosen in the same fashion, allowing for the selection of EMs equal to one more than the number of bands in the image. Stepwise unmixing is used rather than straightforward linear unmixing to improve the accuracy of the results. Stepwise unmixing attempts to project only end members that best represent the pixel. It begins by considering the pixel under investigation as a fractional amount of a single end member that has the highest projection value. The difference between the fractional amount of that end member (i.e., a linear mixture of a single end member) and the pixel’s actual spectrum is calculated as the error. This calculation is repeated using a linear combination of the first end member and every combination of the remaining end members. If the error calculated for all the end member combinations is greater than that of using one end member, only the first end member is used to describe the pixel. If any of the two end member combinations has a smaller error, the procedure is repeated using the two end member combination with smallest error and every combination of a third end member. In this fashion, each pixel is only described using the end members that most likely contributed to its captured spectrum. The only drawback compared to linear unmixing is the computation time is greatly increased.
Proc. of SPIE Vol. 7457 74570E-6
Unmixing was achieved over an entire full length flight line using the same set of end members. To accomplish this, the image was tiled and Max-D run on each tile. The EMs from each tile were combined and re-run through Max-D to find the EMs for the entire scene. Stepwise unmixing was run as normal because it works on a per pixel basis, meaning it only needs the pixel in question and the set of EMs to produce an abundance. Unmixing the entire scene took many computation hours, but it should provide archaeologists with the ability to see abundances over a large area and relative judgements can be made to locations of interest that a spread far apart.
5. RESULTS Classification maps for the region of interest were produced using K-means and Gradient Flow. Full length abundance maps of that image were generated as well. Currently, the parameters for all algorithms (number of classes for K-mean; number of neighbors and smoothing iterations for Gradient Flow; and number of per tile and entire image end members for unmixing) were chosen based on their correlation with what can be visually interpreted in a true color RGB rendering of the scene. Figure 5 shows a pseudo colored abundance map of one of the automatically generated end members. Comparing it with the color image, it would seem that the end member is that of dry/light soil. It will take the input of the archaeological team, currently on site in Oaxaca, to
Figure 5. Sample of abundance map for ninth end member found by Max-D (left) to the true color image (right). Abundance map appears to represent dry/light soil from visual inspection
determine the validity of the results. Masks can be generated using a single or combinations of abundance maps, which in turn can be unmixed to produce narrower classifications. For example, the location of high vegetation abundances can be selected and unmixed to theoretically produce end members/abundances that differentiate
Proc. of SPIE Vol. 7457 74570E-7
vegetation species. However, this more in depth analysis is contingent on the validation of the broader abundance maps first. To receive the archaeologists input as well as aid them in the field, Google Earth is being used as a tool to conveniently collaborate on the imagery product. Google Earth has some advantages over traditional GIS databases. It is free allowing all members of the project to view results without having to pay for licenses. It is generally user friendly, where zooming and rotating are simple mouse movements. This is unlike the GIS software ArcView where regions have to be selected using different zooming curser tools or ENVI’s various zoom level windows. The main advantage of Google Earth is its native internet streaming. Images can be posted in normal web space and streamed into Google Earth as needed. This avoids having to download, store and sort large amounts data. This functionality is only available with certain versions of ArcGIS and requires some advanced knowledge for setting up a web viewable database. Another key advantage of Google Earth is the high-resolution imagery built into it. This provides archaeologists with invaluable points of reference and the spatial resolution to investigate pixels of interest highlighted by the 30 meter resolution class or abundance maps.
'AOO
0
Search V
Places
V
ii
oogle Eart
0
ii
)
Add Content EO1 imaQes RGB renderings of EO1
Hyperion L1C flight lines. E01H02404820082271... Eo1Ho24o4820082gg1... EO1H02404820082351., E01H02504820082481. E01H02504820082531.. E01H02504820082581.. E01H02504820082711.. EO1HO2 504820082911...
E01H02404820082861.. EO1HO2 504820082941.. N1
V 1'1
V
E01H02504820083171.. E01H02404820083221.. E01H02404820083271... E01H02404820083321... E01H02504820083351... EO1HO2 504820083401... EO1HO2 504820083451...
E01H02404820083501... E01H02504820083631... E01H02404820090071...
form and (J-strugttre
.
-
__
Area letween Loma Reyes and Cerro del Chivo -
DatO, NOAA, U!S. Náv, NCA, GEBCO
r2O0Etechnologies
S 2 km
Layers
-y
'
14
I.
10 2009CnWJSIt Image
Image'2O09 OIitalClobe
557362.97 mE 1954562.21 m N
L-.
H
e alt 281.08 k
Figure 6. Google Earth screen capture showing RBG renderings of all collected imagery and markers on locations of interest
6. CONCLUSION The most pressing matter of this research is validating preliminary products with ground truth collected by the archaeologists. Collaboration should allow for a better understanding of the parameters used in each algorithm. The correct parameters will provide the archaeologists with accurate results so they can further interpret classes like soil and vegetation types into meaningful patterns like ancient settlements and trade routes. Google Earth has emerged as a very useful and convenient tool for interaction, especially from the field. Google Earth Pro, which incorporates vector data intake and GPS tagged images, should be equally considered when creating a final GIS database. Future work will include creating full scene length classmaps, which is not as straightforward as unmixing. Studies involving adjusting the parameters, especially for the newest and least understood Gradient Flow algo-
Proc. of SPIE Vol. 7457 74570E-8
rithm, will be integral in discovering a median between classification that are too broad and classifications that are so narrow they differentiate variation within a single material. As the satellite collection coverage increases more sites of high interest to the archaeologists will be available to study. Additionally, high spatial resolution imagery is being investigated as a supplement to the data set.
ACKNOWLEDGMENTS This project was supported by NASA Grant #NNX08AO31G. NASA’s Stuart Frye was integral in the acquisition of Hyperion imagery. Rolando Raque˜ no provided invaluable technical guidance. Dr. Devin White generously provided pervious work and knowledge, bridging the fields of imaging science and archaeology. Coleen Davis conducted preliminary studies for unmixing. Kelly Canham has assisted greatly and will continue in the future research of this project.
REFERENCES [1] Marcus, J. and Flannery, K. V., [Zapotec Civilization How Urban Society Evolved in Mexica’s Oaxaca Valley], Thames and Hudson (1996). [2] Nicholas, L. M., “Land use in prehispanic oaxaca,” Monte Alban’s hinterland, part II, prehispanic settlement patterns in Tlacolula, Etla, and Ocotlan, the Valley of Oaxaca, Mexico , 449–505 (1989). [3] Saturno, W., Sever, T. L., Irwin, D. E., Howell, B. F., and Garrison, T. G., “Putting us on the map: Remote sensing investigation of the ancient maya landscape,” Remote Sensing in Archaeology , 137–160 (2007). [4] Velazquez, A., Duran, E., Ramirez, I., Mas, J.-F., Bocco, G., Ramirez, G., and Palacio, J.-L., “Land use-cover change processes in highly biodiverse areas: the case of oaxaca, mexico,” Global Enviromental Change 13, 175–184 (2003). [5] White, D. A., Transportation, Integration, Facilitation: Prehistoric Trail Networks of the Western Papagueria, PhD thesis, University of Colorado (2007). [6] Basener, B., Castrodad, A., Messinger, D., Mahle, J., and Prue, P., “A dynamical systems algorithm for clustering in hyperspectral imagery,” presented at SPIE Algorithms & Technologies for Multispectral, Hyperspectral, and Ultraspectral Imaging XIV (2008). [7] Lee, K., A subpixel scale target detection algorithm for hyperspectral imagery, PhD thesis, Rochester Institute of Technology (2003).
Proc. of SPIE Vol. 7457 74570E-9