Division of Chemistry and Chemical Engineering, California Institute of Technology, ... Department of Physics, Concordia College, Moorhead, MN 56562.
Journal of Geophysical Research, Vol. 108, No. E5, 5038, doi:10.1029/2002JE001947, 2003
Hypervelocity Microparticle Impact Studies using a Novel Cosmic Dust Mass Spectrometer Daniel E. Austin,1 Heidi L. K. Manning,3 Carl L. Bailey,3 James E. Farnsworth,3 Ron L. Grimm,1 Thomas J. Ahrens,2 and J. L. Beauchamp1 1
Division of Chemistry and Chemical Engineering, California Institute of Technology, Pasadena, CA 91125 2 Division of Geological and Planetary Sciences, California Institute of Technology, Pasadena, CA 91125 3 Department of Physics, Concordia College, Moorhead, MN 56562
Abstract: Micron-sized iron and copper particles accelerated to 2-20 km/s in a 2 MV Van de Graaff electrostatic accelerator tested the performance of our recently-developed cosmic dust mass spectrometer. This compact in situ dust analyzer, known as the Dustbuster, is designed to determine the elemental composition of cosmic dust particles through impact ionization and subsequent time-of-flight mass spectrometry. Results from 750 laboratory impacts show high mass resolution, typically 150-350 (m/∆m) for projectile components and 300-600 for the target material (tantalum). Peaks corresponding to H, C, O, Na, and K ions are also observed, consistent with previous microparticle impact experiments. Field-induced emission of electrons immediately before impact is a possible cause of ion formation from species with high ionization potentials. The high mass resolution, large sensitive target area, and small size make the Dustbuster an ideal instrument for inclusion on a spacecraft payload.
1
Journal of Geophysical Research, Vol. 108, No. E5, 5038, doi:10.1029/2002JE001947, 2003
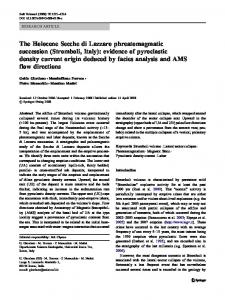
Introduction In recent years considerable interest has arisen in cosmic dust, the fine-grained matter that pervades the solar system and the observable universe. Over the past four decades, several instruments have been developed and deployed on spacecraft to measure the size, trajectory, composition, and distribution of dust grains in the solar system. While most of these instruments study individual dust grains in situ [Grün, 1994; Srama and Grün, 1997], other methods have been developed to return dust samples to Earth for laboratory analysis [Brownlee et al., 1995]. Spacecraft encounter dust grains at velocities ranging from a few to over a hundred km/s. At such speeds, an impacting dust grain and a portion of the surface it hits are partially vaporized and ionized [Hansen, 1968; Hornung and Kissel, 1994]. In situ chemical analyzers rely on this impact ionization, using mass spectrometric techniques to separate and measure the resulting ions based on their atomic or molecular masses. Instruments of this type include the PIA and PUMA dust analyzers that encountered Halley’s comet [Kissel et al., 1986], the Cassini Cosmic Dust Analyzer (CDA) [Ratcliff et al., 1992], and the STARDUST Cometary and Interstellar Dust Analyzer (CIDA) [Brownlee et al., 1995]. Auer [2001] has written an excellent review of the instrumentation and experimental techniques associated with in situ cosmic dust analysis. The majority of dust grains encountered by spacecraft range from 0.1 to 10 µm in diameter. Within the solar system, dust grains become photoelectrically charged to typical potentials of 3-4 V with respect to charge neutrality [Kimura and Mann, 1998], corresponding to 2 × 10-16 C on a 1-µm particle. The elemental composition of most solar system dust grains is approximately chondritic, although individual particles may have disproportionate contributions from specific minerals such as Mg silicates, FeNi metal, sulfides, phosphides, or carbonates [Brownlee, 1995]. Interstellar dust grains may show large deviations in isotopic and elemental composition as compared to solar system objects. Interstellar grains pass through the solar system at 25 km/s relative to the sun, so impacts with spacecraft range from 0 to 50 km/s depending on spacecraft location and trajectory. Encounters with other types of dust exhibit a similarly wide range of impact speeds. We recently developed a prototype model of a new in situ dust analyzer, called the Dustbuster, which has been described in detail [Austin et al., 2002]. As shown in Figure 1, ions produced by an impact on the target plate are accelerated through a reflectron and onto a microchannel plate (MCP) detector or other suitable electron multiplier. The Dustbuster is considerably smaller and lighter than previous dust analyzers, and novel ion optics permit high mass resolution and a large sampling target area. Preliminary tests of the Dustbuster [Austin et al., 2002] used laser desorption ionization of copper metal and copper-iron sulfide samples embedded in the target plate to simulate ionization from dust impacts. Typical mass resolution in these experiments ranged from 80-180 (m/∆m) for isotopes of iron and copper. Although laser ionization is sufficiently similar to impact ionization to make a useful preliminary evaluation of the Dustbuster’s performance, more realistic testing and calibration must involve impacts of microparticles resembling cosmic dust in their impact velocity, charge, size, and composition.
2
Journal of Geophysical Research, Vol. 108, No. E5, 5038, doi:10.1029/2002JE001947, 2003
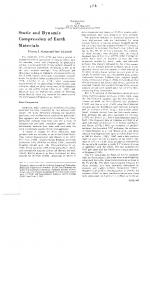
Electrostatically accelerated microparticles in the laboratory are limited to either conducting materials or insulating materials coated with a conducting surface. Most minerals therefore are unsuitable for such impact experiments. In the current work, highly-charged copper and iron microparticles, accelerated to 2-20 km/s using a 2 MV Van de Graaff electrostatic accelerator, verify the Dustbuster’s ability to analyze particles that approximate those of the space environment. Experimental The principal components of the experimental setup, illustrated in Figure 2, include the vacuum system, the dust reservoir and charging needle, the Van de Graaff ball, charge-sensitive electrodes along the length of the flight tube, and the Dustbuster time-of-flight mass spectrometer located at the end of the flight tube. The Van de Graaff dust accelerator, originally built for NASA by Otto Berg, is similar to the dust accelerator built by Friichtenicht [1962]. Micron-sized iron and copper particles were placed in the dust reservoir, which was then evacuated. A pulsed voltage applied to an electrode excited the particles, causing them to bounce around within the reservoir. Periodically a single particle left the reservoir through an aperture and became highly charged by contact with the charging needle. From there, the particle was accelerated by approximately 1.5 MV into the flight tube and onto the Dustbuster. On average, 1-10 particles per minute struck the Dustbuster impact plate. Because the spectrum acquisition time was only 10 µs, the probability of overlapping spectra from coincident particles was negligible. Three cylindrical electrodes within the flight tube allowed measurement of the charges and velocities of the accelerated particles. Each particle induced an image current as it passed through each cylinder. The resulting voltage pulses were combined, amplified, and recorded by an oscilloscope. Particle charge was calculated using the relation q = CV, where C is the measured capacitance of the first cylinder electrode in the drift tube, and V is the magnitude of the induced voltage pulse. Particle velocity was determined from the distance between the other two electrodes and the time between those signals. Particle mass was found from m = 2qVa/v2, where Va is the total accelerating voltage and v is the measured particle velocity. The lower limit of charge sensitivity of the cylinder electrodes was approximately 1 fC, which resulted in a maximum observable velocity of 20-30 km/s and minimum observable mass of around 5 × 10-18 kg, based on typical surface charge densities of the accelerated metal particles. Charge is roughly proportional to surface area, and mass is proportional to volume, leading to an overall v ∝ r–1/2 relationship. As a result, smaller particles with less charge are accelerated to higher velocities than larger particles with more charge. The dust reservoir, accelerator, and flight tube were evacuated by a diffusion pump. Because this vacuum system was only able to maintain 3 × 10⁻⁶ torr at the exit of the flight tube, the Dustbuster was mounted inside its own vacuum chamber, evacuated by a turbopump to 10-7 torr. The two vacuum systems were connected with a 1-cm circular aperture, through which the charged particles left the flight tube and entered the Dustbuster chamber. The Dustbuster vacuum chamber included angled connection ports in order to observe particle impacts at angles of up to 25° from the normal. A flexible bellows directed the particle beam to various locations on the target plate, spanning all radial distances from 1.5 to 4 cm from the instrument axis. The Dustbuster vacuum
3
Journal of Geophysical Research, Vol. 108, No. E5, 5038, doi:10.1029/2002JE001947, 2003
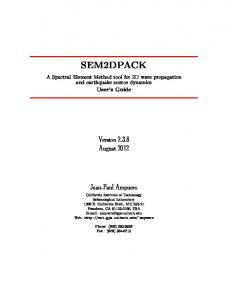
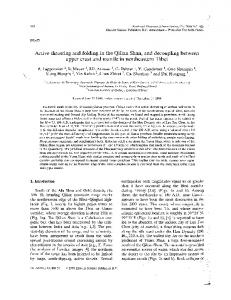
chamber was mounted on a large, custom-designed xyz translation/3-axis rotation stage that assisted in varying and measuring the angle and location of the particle impacts on the target plate. Particles used included wire-exploded copper with an average diameter of 100150 nm (Argonide Nanomaterials), 1-micron copper (Sigma Chemical), and 0.1- to 3micron (diameter) iron spheres produced by the mist reduction of iron carbonyl (General Aniline and Film Corp.). Initially experiments were carried out using iron particles alone. On the assumption that the composition of each particle could be deduced from its mass spectrum, the dust reservoir was filled with a mixture of copper and iron powder in later experiments. For all experiments the entrance grid and extraction grid of the Dustbuster were made of knitted tungsten (Kimball Physics) and electroformed nickel (Buckbee-Mears), respectively. The target plate was made out of 99.95% pure tantalum (Alfa Aesar), sanded with 2400-grit silicon carbide sandpaper, degreased, cleaned, and sonicated in HPLC grade methanol. The Dustbuster was originally designed to use 4.8 kV for ion extraction. In order to determine the possibility of operating the instrument using less power, a number of lower voltages were also tried, with all electrostatic potentials scaled proportionally. In addition, the voltage on the microchannel plate detector was independently varied from 700 to 900 volts per plate in order to determine the optimum conditions for observing the mass spectra. The signal from the microchannel plate detector was amplified with a 20x gain differentiating preamplifier (EG&G Ortec VT120) and recorded using a 150 MHz digital oscilloscope (Yokagawa 1520). Spectra were calibrated using the sodium and potassium (39K) peaks. Time-equals-zero points were not directly measured, but were extrapolated using the calibration points. A total of 750 spectra were recorded. Results Figure 3 shows particle velocity as a function of mass for all particles studied. Measured particle velocities were generally between 1 and 10 km/s, although velocities up to 23 km/s were observed. Uncertainties in velocity and charge measurements were approximately 5%. Figure 4 shows the mass and charge of all detected particles. Also included are lines of constant surface charge density for ideal iron spheres in the range of the measured particles. The charge density of nearly all the particles in this experiment were at least an order of magnitude below the field desorption limit, 2 x 10¹⁰ V/m, consistent with previous results using similar charging methods [Friichtenicht, 1962; Friichtenicht, 1964; Shelton et al., 1960]. Interestingly, the larger particles were charged to a fairly constant surface charge density (5 × 10⁻³ C/m2), while the smallest particles follow more closely a curve of constant surface potential. During the experiments, a large number of particles struck the Dustbuster and triggered the recording electronics, but had too small a charge to be detected by the cylinder electrodes in the accelerator flight tube. Nonetheless, most of these particles generated interpretable mass spectra. Figures 5 and 6 show representative mass spectra for particles with defined and undefined velocities, respectively. Spectrum 5a, typical of roughly 20% of the impacts, shows only Na+ and K+ peaks with high mass resolution. Spectrum 5b shows H+ and unusually broad Na+ and K+ peaks. Spectrum 5c shows broad Na+ and K+ peaks along with a strong Fe+ peak. Similarly broadened peaks appeared in about 15% of the spectra,
4
Journal of Geophysical Research, Vol. 108, No. E5, 5038, doi:10.1029/2002JE001947, 2003
but Na+ and K+ were the only species for which significant broadening occurred. In general, these peaks were broader for slower impact velocities. Impact angle, which was varied from 0º to 23º, had no noticeable effect on the amount of peak broadening. In many spectra, the number of ions observed from a given m/z exceeded the input voltage limit of the signal amplification or recording electronics, producing the peak clipping seen in spectra 5c and 5d. Spectrum 5d shows peaks corresponding to H+, C+, O+, Na+, K+, Fe+, and a peak at m/z = 40, which was not positively identifiable. Spectra 5e and 5f contain similar peaks with varying intensities. Figure 6 shows representative spectra produced by particles whose masses and velocities were beyond the detection limits of the cylinder electrodes. Ta+ and TaO+ from the target plate material are observed in some spectra. Table 1 enumerates all the mass peaks present in at least some of the spectra, and shows the ranges of mass resolution (m/∆m) for several species. For lighter species, particularly hydrogen, mass resolution was limited by the speed of the recording oscilloscope rather than by a distribution of ion arrival times. Discussion In general, faster particles produced a larger number of ions, consistent with previous results [Friichtenicht, 1964]. As expected, neither the incident angle of impact nor the location of the impact on the target plate produced any measurable difference in the mass resolution or other features of the resulting spectra. A statistical analysis of all the spectra failed to detect any correlation between the presence or absence of any specific peaks and the velocities, masses, kinetic energies, or momenta of the impacting particles. Several correlations exist relating the specific spectral peaks observed. For instance, Ta+ (m/z = 181), TaO+ (m/z = 197), and a peak at m/z = 40 appear only in those spectra in which carbon and hydrogen are both present. C+ is always present, and m/z = 40 is generally present in those spectra containing an oxygen ion peak. H2+ appears only when H+ is present, but never when Fe+ or Cu+ are present. In most spectra, peak intensities corresponding to minor isotopes, such as 41K+ (6.7% natural abundance) and 54Fe+ (5.8% natural abundance), were smaller than expected. In a few spectra, minor isotopes were absent. Several factors may be responsible for this effect. First, microchannel plate detectors are known to have nonlinear response to isotopes in some situations [Giudicotti et al., 1993; Odom and Schueler, 1990]. Although MCPs have been used for careful isotope ratio measurements, corrections must be made for gain saturation and other effects [Maechling et al., 1995]. In the current experiment minor isotope peaks may have been truncated or improperly sampled [Kang and Beauchamp, 1985]. Another possibility is that peaks such as m/z = 56 may have had, in addition to 56Fe+, an additional contribution from a contaminant such as CaO+, reducing the expected intensity of other iron isotopes with respect to the principal peak at 56. If this is the case, the m/z = 40 peak may be Ca+, although calcium was not expected to be a significant contaminant in this experiment, and no 44Ca+ peak was detected. Insufficient information exists to indicate which of these possible scenarios is responsible for the anomalous intensities of minor isotope peaks in the spectra. For a flight instrument, however, faster recording electronics and a better ion detector would reduce this obstacle to isotope ratio analysis.
5
Journal of Geophysical Research, Vol. 108, No. E5, 5038, doi:10.1029/2002JE001947, 2003
Sodium and potassium ion peaks were observed in nearly all spectra. In many of the impacts, these were the only observed ion species. Because of their low ionization potentials (5.139 eV for sodium, 4.341 eV for potassium) and prevalence on metal surfaces, these alkali ion contaminants commonly appear in mass spectrometry involving surface ionization. Non-metal ion peaks (H+, C+, O+, etc.) have been observed in previous impact experiments, although their source is unclear. Ratcliff and Alladhadi [1996] saw H+ and C+ peaks in their mass spectrum of a 94 km/s boron carbide particle impacting a silverplated aluminum target. They attributed these peaks to hydrocarbon (pump oil) contamination, but no explanation was given for the lack of hydrocarbon fragment peaks. Roy and Friichtenicht [1975] used a low-resolution time-of-flight mass spectrometer to study the ions produced in impacts of 2-32 km/s iron microparticles on tantalum surfaces. For impacts above 9 km/s they frequently observed H+, H2+, C+, and a peak at m/z = 28, which they assigned to Si+. Their instrument did not have sufficient resolution to separate 39K+ from any peak at m/z = 40, if present. Their analysis was based on averaged spectra, and no information was given about correlations between peaks in individual spectra. Hydrogen and carbon have relatively high ionization potentials (13.598 and 11.260 eV, respectively) and typical C-H bond strengths in hydrocarbons are 4 eV. A 9 km/s impact producing 0.4 eV per nucleon does not have sufficient kinetic energy to atomize and ionize species with such high bond dissociation and ionization energies [Hornung et al., 2000]. Although the energy required to produce free H, C, and O ions is much higher than the impact energy, the presence of these peaks may be explained by the theory proposed by Novikov [1988] and discussed by Sysoev [1992, 1997] and McDonnell [2001]. They postulate that an electric discharge occurs between the charged particle and target surface immediately before impact. According to their model, when the charged microparticle is within approximately 1-2 µm of the surface, the high electric field causes electrons to desorb from the target surface and strike the particle, causing electron-induced desorption and ionization. In addition, a small spot on the particle surface is strongly heated, causing thermal desorption and ionization of such species as Na and K. The electron-emission model should have a dependence on impact velocity such that faster particles, with fewer charges, would result in fewer electron-generated ions. However, the velocity limits for this process have not been explored. It is likely that ions formed under these circumstances would be accelerated back onto the impact plate, producing additional ionization. In the present work, both the accelerated particles and the impact plate likely had a surface coating of pump oil, which in this case consisted of tetramethyltetraphenyltrisiloxane. The O+ peak observed could be caused by oxygen from the pump oil, by oxides on the particle surface, or by adsorbed gases, dissociated and ionized by field-emitted electrons prior to impact. Other mechanisms might also have played a role in the ionization of species with high ionization potentials. If ionization is enhanced at a particle surface due to electron emission or other effects, the quantity and type of ions formed in any given impact will not be representative of the particle composition as a whole. Impact ionization models, such as hydrocode simulations, that neglect electron-induced ionization mechanisms may also give incorrect interpretations of real impacts involving charged particles [Hornung et al., 2000]. Previous results from comet Halley [Kissel et al., 1986], which showed an excess of H, C, N, and O ions in the impact mass spectra, may have seen a surface enrichment of
6
Journal of Geophysical Research, Vol. 108, No. E5, 5038, doi:10.1029/2002JE001947, 2003
these elements caused by sublimation of more volatile surface components. The concentration of organics on the particle surfaces may not have been representative of the bulk cometary composition. Both in the Dustbuster and other instruments, electron-induced ionization may also occur as particles pass through grids and come close to a grid wire. For instance, in the Dustbuster, 15% of 1-µm particles pass within 2 µm of a grid wire before they reach the impact target. Inconsistent electrical interactions may produce different mass spectra for otherwise identical particles. Similarly, field-emission of electrons from the target plate will vary with the microscale topology of the impact surface. This topology may affect the quantity and nature of ions produced in an impact. Both of these effects have implications for in situ flight instruments. Impact cratering of a target plate, which can be extensive in some dust environments, would change the ionizing characteristics of a target plate over time. Also, particle charge measurements are necessary in order to predict the specific ionization mechanism responsible for a given spectrum. The presence or absence of certain mass peaks shows a great deal of variability between similar microparticles. This variability is sufficient to obscure correlations that might exist between measured particle parameters and spectral features. For instance, given two particles identical in mass, composition, charge, and velocity, one may produce significant C, H, and O ion peaks, while such peaks might be completely absent from the spectrum of the other particle. Figure 7 shows an example of this: three 2.6-micron iron particles impacting normal to the target, at 2.1 km/s, and in the same region of the target plate produce three different spectra. The origin of this variation in spectra is not clear, but illustrates the dependence of the ionization mechanism on one or more unmeasured variables. These variables may pose significant limitations on estimates of elemental composition from any cosmic dust analyzer of this type. A few other unusual observations deserve comment. As seen in Figures 5-7, some spectra exhibit unusually broad Na+ and K+ peaks, although other ion species seem unaffected. Because the Dustbuster uses a reflectron, it is unlikely that these broad peaks are caused by differences in the initial kinetic energies of the ions. More likely, these ions are produced over a longer time scale than the other ions. For broadened peaks from slower impacts (1.5-2.5 km/s), the peak widths correspond to roughly 300 ns, while faster impacts produce less broadening. It is possible that these broad peaks arise from particles which were heated by electron bombardment while passing through the acceleration grid. Such particles would emit sodium and potassium ions all the way through the acceleration region. Computer simulations of this situation using SIMION ion trajectory software [Dahl, 2000] show that only those ions emitted within 300-400 µm of the target plate would have the correct energy and trajectory to reach the ion detector. The combination of being formed early and gaining less kinetic energy would result in an arrival time of about 0-300 ns earlier for these ions, consistent with observations. Alternatively, the broadened peaks may be a result of energy dissipation at the target surface or by plasma screening effects. Particles that actually impacted on a grid wire either produced no spectrum at all, or the resulting spectrum showed hundreds of peaks arriving over several microseconds.
7
Journal of Geophysical Research, Vol. 108, No. E5, 5038, doi:10.1029/2002JE001947, 2003
Conclusions Mass resolution from particle impacts is equal to or better than previous Dustbuster results using laser desorption ionization. Although a few mass spectra show unusual peak broadening, the majority have high mass resolution, showing that the Dustbuster functions well as a compact time-of-flight mass spectrometer for in situ cosmic dust analysis. Peaks such as C+, H+, and O+ may not be representative of particle composition, but may provide useful clues as to what is taking place on the surfaces of dust grains. Impact mass spectra still provide bulk composition, although accuracy may be limited by the complicated ionization mechanism taking place in impacts involving charged microparticles. Acknowledgements The authors thank NASA’s Planetary Instrument Definition and Development Program (PIDDP) for financial support. Additional financial support for the early stages of this research came from the Beckman Institute at Caltech. Contribution #8870, Division of Geological and Planetary Sciences, California Institute of Technology, Pasadena, CA 91125.
References Auer, S., Instrumentation, in Interplanetary Dust, edited by E. Grun, S. Dermott, B.A. Gustafson, and H. Fechtig, Springer, Berlin, 2001. Austin, D.E., T.J. Ahrens, and J.L. Beauchamp, Dustbuster: a compact impact-ionization time-offlight mass spectrometer for in situ analysis of cosmic dust, Review of Scientific Instruments, 73 (1), 185-189, 2002. Brownlee, D.E., The elemental composition of interplanetary dust, in Physics, Chemistry, and Dynamics of Interplanetary Dust, 150th Colloquium of the International Astronomical Union, edited by B.A.S. Gustafson, and M.S. Hanner, pp. 261-264, Astronomical Society of the Pacific Conference Series, San Francisco, Gainesville, Florida, 1995. Brownlee, D.E., D. Burnett, B. Clark, M.S. Hanner, F. Horz, J. Kissel, R. Newburn, S. Sandford, Z. Sekanina, P. Tsou, and M. Zolensky, STARDUST: comet and interstellar dust sample return mission, in Physics, Chemistry, and Dynamics of Interplanetary Dust,150th Colloquium of the International Astronomical Union, edited by B.A.S. Gustafson, and M.S. Hanner, pp. 223-226, Astronomical Society of the Pacific Conference Series, San Francisco, Gainesville, Florida, 1995. Dahl, D.A., SIMION 3D, Idaho National Engineering and Environmental Laboratory, Idaho Falls, ID, 2000. Friichtenicht, J.F., Two-million-volt electrostatic accelerator for hypervelocity research, Review of Scientific Instruments, 33 (2), 209-212, 1962. Friichtenicht, J.F., Micrometeoroid simulation using nuclear accelerator techniques, Nuclear Instruments and Methods, 28, 70-78, 1964. Giudicotti, L., M. Bassan, R. Pasqualotto, and A. Sardella, Simple analytical model of gain saturation in microchannel plate devices, Rev. Sci. Instrum., 65 (1), 247-258, 1993. Grün, E., Dust Measurements in the Outer Solar System, Asteroids, Comets, Meteors 1993 IAU Symposia, 160, 367-380, 1994. Hansen, D.O., Mass analysis of ions produced by hypervelocity impact, Applied Physics Letters, 13 (3), 89-91, 1968.
8
Journal of Geophysical Research, Vol. 108, No. E5, 5038, doi:10.1029/2002JE001947, 2003
Hornung, K., and J. Kissel, On shock wave impact ionization of dust particles, Astronomy and Astrophysics, 291, 324-336, 1994. Hornung, K., Y.G. Malama, and K.S. Kestenboim, Impact vaporization and ionization of cosmic dust particles, Astrophysics and Space Science, 274, 355-363, 2000. Kang, H., and J.L. Beauchamp, Pulsed laser evaporation and ionization of solid metal targets. Implications for studying the gas-phase reactions of laser-generated atoms and ions, J. Phys. Chem., 89, 3364-3367, 1985. Kimura, H., and I. Mann, The electric charging of interstellar dust in the solar system and consequences for its dynamics, Astrophysical Journal, 499 (454-462), 1998. Kissel, J., R.Z. Sagdeev, J.L. Bertaux, V.N. Angarov, J. Audouze, J.E. Blamont, K. Buchler, E.N. Evlanov, H. Fechtig, M.N. Fomenkova, H. von Hoerner, N.A. Inogamov, V.N. Khromov, W. Knabe, F.R. Krueger, Y. Langevin, V.B. Leonas, A.C. Levasseur-Regourd, G.G. Managadze, S.N. Podkolzin, V.D. Shapiro, S.R. Tabaldyev, and B.V. Zubkov, Composition of Comet Halley dust particles from Vega observations, Nature (London), 321, 280-282, 1986. Maechling, C.R., S.J. Clemett, and R.N. Zare, 13C/12C ratio measurements of aromatic molecules using photoionization with TOF mass spectrometry, Chemical Physics Letters, 241, 301-310, 1995. McDonnell, J.A.M., E.D. Aguti, and M.J. Willis, Pre-contact microdischarge from charged particulates, in Proceedings of the 7th Spacecraft Charging Technology Conference, 2327 April 2001, pp. 423-427, European Space Agency, Noordwijk, The Netherlands, 2001. Novikov, L.S., N.D. Semkin, V.S. Kulikauskas, S.M. Semenchuk, and V.P. Kiryukhin, Mass spectrometry of ions emitted in collisions of accelerated dust particles with target, Sov. Phys. Tech. Phys., 33 (6), 680-682, 1988. Odom, R.W., and B. Schueler, Laser Microprobe Mass Spectrometry: Ion and Neutral Analysis, in Lasers and Mass Spectrometry, edited by D.M. Lubman, pp. 103-137, Oxford University Press, New York, 1990. Ratcliff, P.R., and F. Allahdadi, Characteristics of the plasma from a 94 km/s microparticle impact, Advances in Space Research, 17 (12), (12)87-(12)91, 1996. Ratcliff, P.R., J.A.M. McDonnell, J.G. Firth, and E. Grün, The Cosmic Dust Analyzer, J. British Interplanetary Soc., 45 (9), 375-380, 1992. Roy, N.L., Research Investigations of the Physical Interactions and Phenomena Associated with Hypervelocity Sub-micron Particles, pp. 67, TRW Systems Group, Redondo Beach, CA, 1975. Shelton, H., C.D. Hendricks, Jr., and R.F. Wuerker, Electrostatic acceleration of microparticles to hypervelocities, J Appl. Phys., 31 (7), 1243-1246, 1960. Srama, R., and E. Grün, The dust sensor for Cassini, Advances in Space Research, 20 (8), 14671470, 1997. Sysoev, A.A., D.R. Bandura, and V.P. Ivanov, Mechanism of ionization in a low-velocity collision of charged microparticles, Sov. Tech. Phys. Lett., 18 (8), 486-488, 1992. Sysoev, A.A., V.P. Ivanov, T.V. Barinova (Komova), and Y.A. Surkov, Mass spectra formation from charged microparticles, Nuclear Instruments & Methods in Physics Research, Section B: Beam Interactions with Materials and Atoms, 122, 79-83, 1997.
9
Austin et al.: Hypervelocity Microparticle Impact Studies
Figure captions Figure 1. Design of the Dustbuster mass spectrometer (side view). Ions produced by the impact of a dust particle on the target plate are accelerated into the reflectron, through a drift tube and onto a microchannel plate (MCP) electron multiplier. The instrument has cylindrical symmetry and is 20 cm long and 10 cm in diameter. Figure 2. Experimental setup for hypervelocity microparticle impact studies. Micronsized copper and iron spheres are charged in the Van de Graaff ball, then individually accelerated through the flight tube and onto the Dustbuster mass spectrometer. Flight tube is approximately 5 m long. Figure 3. Velocities and masses of accelerated particles as measured by the chargesensitive electrodes in the accelerator flight tube. Figure 4. Charge vs. mass for accelerated iron and copper particles used in this study. Diagonals are lines of constant surface charge density, in C/m2, for spherical iron particles. Uppermost line is the ion emission (ion evaporation) limit for iron. Figure 5. Typical mass spectra produced by microparticle impacts on the Dustbuster. The first four spectra are from iron particles; the last is a copper particle. Next to each spectrum is the velocity and size of the particle producing the spectrum. Vertical axis for each spectrum is signal intensity (arbitrary units). Figure 6. Spectra from particles with unknown mass and velocity. The first four spectra are iron impacts and the last is a copper particle. No peaks were observed in any spectra between m/z = 70 and m/z = 180. Vertical axis for each spectrum is signal intensity. Figure 7. Spectra from three 2.6-micron iron particles impacting at 2.1 km/s. Vertical axis in each spectrum is signal intensity.
Austin et al.: Hypervelocity Microparticle Impact Studies
Table 1. Summary of all peaks present in at least 3 impact spectra. Mass resolution (m/∆m at FWHM) is given for important peaks. m/z
% of spectra Peak assignment Mass resolution with given peak 1 77 H+ 20-25 2 15 H2+ 3 0.6 H3+ 7 8 Li+ 12 59 C+ 50-150 13 0.7 CH+ 16 28 O+ 23 98 Na+ 5-200 (typically 100) 27 1.5 Al+ 28 1.0 CO+ or Si+ ? 39 (41) 99.5 K+ 5-200 (typically 100) + 40 37* Ar , SiC+ or Ca+ ? 56 (54) 16 Fe+ 150-350 63 (65) 8 Cu+ 150-350 181 9 Ta+ 300-600 197 6 TaO+ * Peaks may have been obscured by broad potassium lines, hence the occurrence of this peak may be more frequent than indicated.
Austin et al.: Hypervelocity Microparticle Impact Studies
Fig. 1
Fig. 2
Fig. 3
Fig. 4
Fig. 5
Fig. 6
Fig. 7