Availability Models. K. Debnath ... continuous state monitoring procedure used by the CEA. This ... [1] Generating Availability Data Systems, 1984 Generating.
is also calculated as:
88 SM 502-7 March 1989
where cp is the energy purchace rate from the Utility and c. is the energy sales rate to the utility. The performance of the developed probabilistic method is demonstrated with computational results which are compared with results obtained using chronological simulation. Some results useful in planning for generation are also presented.
Some Aspects of Generating Unit Availability Models K. Debnath, Student Member, IEEE and R. Billinton, Fellow, IEEE Power Systems Research Group University of Saskatchewan
Saskatoon, Saskatchewan
Canada S7N OWO
Summary
*'*I II
i2
i'
I
I
I
I
In Wind Array
! I I I ; u
L-
I
I
I
i I i
Customer
I
Demand
-
-
-
--
-
-
J
-
Grid
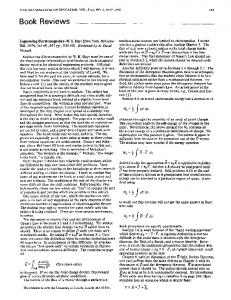
Customer Figure 1. Grid connected operation of a customer owned
Wind Array.
HR(r)
_e
Generating unit availability data in North America are compiled by two national organizations. In the United States, utility data are processed and disseminated by the North American Electric Reliability Council (NERC) through the Generating Availability Data System (GADS). In Canada, these data are handled by the Canadian Electrical Association (CEA) in its Equipment Reliability Information System (ERIS). The CEA also processes major transmission equipment outage data as part of the ERIS program. The basic generating unit performance parameters from the GADS and ERIS systems are disseminated by NERC and CEA respectively in the form of comprehensive annual reports [1, 21. The data bases of both these systems contain a considerable amount of raw data which can be interrogated to produce additional statistics and models for performance evaluation and system reliability assessment. This paper presents a brief comparison of basic data from the GADS and ERIS systems and illustrates some aspects of generating unit availability models using the CEA-ERIS data base. The paper also illustrates some of the additional information which can be produced from the continuous state monitoring procedure used by the CEA. This is illustrated by Weibull analysis of state residence time distributions, consideration of the effect of low operating factors for conventional fossil units and modified models for peaking units. References [1] Generating Availability Data Systems, 1984 Generating Availability Data Systems Reports, North-America Electric Reliability Council, 1986. [21 Canadian Electrical Association Equipment Reliability Information System, 1984 Annual Report Generation Equipment Status, Canadian Electrical Association, Montreal, 1986.
88 SM 503-5 March 1988
;
r -
r
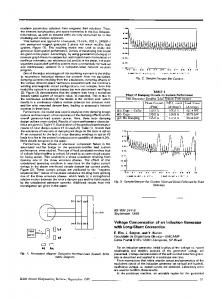
C Figure 2. A typical modified load dur.ation curve.
A Photovoltaic Voltage Regulation Impact Investigation Technique: Part I-Model Development D. L. Garrett Southern Electric International P.O. Box 2625 Birmingham, AL 35202 S. M. Jeter School of Mechanical Engineering Georgia Institute of Technology Atlanta, GA 30332
The effects of variations in PV system generation due to moving cloud systems have been studied in several recent reports and papers [1, 2, 3]. These investigations have IEEE Power Engineering Review, March 1989.
29
concentrated mainly on the utility generation's ability to respond to the variations in PV system outputs. The cloud models in these investigations have ranged from a single shadow line moving across the service area to a quite detailed model incorporating the effects of cloud transmittance, shape, size, wind direction and wind speed. All of these recent investigations concluded that, for the foreseeable percent penetration of PV systems, the utility generation is capable of responding to the fluctuations of PV generation expected. Reference [3] concluded that the major effects of PV generation changes may occur at the substation or distribution level. In Reference [2], the distribution system voltage profiles during changing PV generations are considered. While this investigation concluded that the voltage profile variations would be minimal, it did not model the voltage regulating equipment and real-time response of the distribution system. Thus, while there may be no significant voltage fluctuations on a steady-state basis, it has not yet been determined whether there will be temporary voltage fluctuations while the voltage regulating equipment responds to the changing PV generation. Referring to Figure 1, the problem at hand can be stated in an over-simplified manner. If the PV system shown in Figure 1 has a significant increase or decrease in its output, will the voltage regulating device respond? If the voltage regulating device does respond, how often will it operate and will this significantly reduce the life of the voltage regulating device? As a first step in answering these questions, Sandia National Laboratories has contracted Southern Electric International to develop a model to simulate the moving clouds over a distribution system and to model the distribution system on a real-time basis. This model simulates the voltage regulating devices' characteristics in detail while also modeling the characteristics of the moving cloud system in detail. The resulting model can be used by the utility engineer to study a variety of situations on the distribution system. The computer model, called PVREG, is written in FORTRAN 77 and is user friendly. Although developed on an Apollo mini-computer, the program will eventually be translated to run on an IBM PC, or compatible. The program is modular, allowing future additions or changes to the various models in the program. The solution routine is based on a load flow algorithm developed to study generating plant station auxiliary systems. The load flow solution is based on the algorithm Gauss-Seidel using a bus impedance matrix extended to three-phase representation and including bus admittance [4]. This algorithm was modified to simulate the changing generation and load conditions on the distribution feeder at discrete time steps. A system can be simulated for up to a 24 hour period with the time increment specified by the user. The cloud model is based on data taken from a typical meteorological year (TMY) data tape available from the National Climatic Center in Ashville, North Carolina. Thus, actual observed parameters are used to develop a cloud model typical of a particular area defined by data on the TMY tape.
References [1] "The Effect of Photovoltaic Power Generation on Utility Operation," Arizona State University, Department of Electrical and Computer Engineering, Sandia National Laboratory Report No. SAND84-7000, Feb. 1984. [21 J. Pfitzer, W. E. Dillon, S. Ramesh and T. H. Shen, "Impact of Residential Utility Interactive Photovoltaic Power Systems on the Utility," Sandia National Laboratory Report No. SAND84-7008, Sept. 1986. [3] W. Jewell and R. Ramakumar, "The Effects of Moving Clouds on Electric Utilities with Dispersed Photovoltaic Generation," IEEE Transactions on Power Apparatus and Systems, Vol. PER-7, No. 12, December 1987. [4] John R. Neuenswander, Modern Power Systems, International Textbook Company, 1971.
30
Figure 1. Simplified Distribution Feeder
88 SM 504-3 March 1988
A Decoupler Design Method for Synchronous-Machine-Infinite-Bus System Wengan Gu and K. E. Bollinger, Sr. Member, IEEE Dept. of Electrical Engineering University of Alberta Edmonton, Canada Abstract-The transfer matrix for the linearized model of a Synchronous Machine Infinite Bus (SMIB) system is derived in this paper and a decoupler is designed using this form of plant model. Simulation results show the effects on decoupling as the generator operating points move from Mvar export to import. Introduction Park's equations reveal that a synchronous machine is a nonlinear device with cross-coupling [1]. A considerable amount of information can be obtained about the dynamic stability of the machine by linearizing Park's equations around an operating point [2] and evaluating system performance. Although studies of this type fall short of predicting results for the exact nonlinear system, studies on the small signal models usually give reasonable trends that can be expected during on-site tests. Cross-coupling in a power system generator is one of the underlying sources of rotor oscillations when the voltage regulator loop has high gains or the generator load is characterized by large power angles. Long transmission lines linking generator to loads contribute to the degree of cross-coupling in much the same way as Var flow from the generator. It is of interest to derive th block diagram of a synchronous generator in a way that explicitly shows the cross-coupling terms. This is described in the first part of the paper. The latter part of the paper includes a derivation of decouplers and simulation results that illustrate the effects of operating points on a decoupler which is designed for a particular MW and Mvar export condition. Transfer Function Matrix of
a SMIB
System
The Transfer Function Matrix (TFM) of the SMIB has to be derived in order to design the decoupler. The TFM is a compact model that reveals the system input-output characteristics and the degree of cross-coupling. A SMIB system with GOV and AVR can be represented by the block diagram shown in Figure 1. IEEE Power Engineering Review, March 1989