(7) fs where fs is the sampling frequency. Expressed on a decibel scale, the .... â¬4 - ep + ef 3. (1 4) where ep is the power in the prediction error and ef is the.
IEEE TRANSACTIONS ON ACOUSTICS, SPEECH, AND SIGNAL PROCESSING, VOL. ASSP-27, NO. 3, JUNE 1979
247
[3] C. S . Burus and T. W. Parks, “Time domain design of recursive digitalfilters,” IEEE Trans. Audio Electroacoust., vol. AU-18, pp. 137-141, June 1970. [4] F. N. Cornett, “First and second order techniques for the design of recursive filters,” Ph.D. dissertation, Colorado State Univ., Ft. Collins, CO, 1976. [5] D. C. Farden and L. L. Scharf, “Statistical design of nonrecursive digital filters,” IEEE Trans. Acoust., Speech, SignalPuocessing, vol. ASSP-22, pp. 188-196, June 1974. [6] E. Parzen, “Multiple time series Modeling,” in Multivariate Analp sis IZ, P. Krishnaiah, Ed. New York: Academic, pp. 389-409. [7] W. C. Kellog, “Time domain design of nonrecursive least meansquaredigitalfilters,” IEEE Trans. Audio Electroacoust., vol. AU-20, pp. 155-158, June 1972. [8] D. C. Farden and L.L. Scharf, “Authors reply to ‘Comments on statistical design of nonrecursivedigital filters,”’ IEEE Dam. Acoust., Speech, Signal Processing, vol. ASSP-23, pp. 495-496, Od. 1975. [9] U. Grenander and G. Szego, Toeplitz Forms and Their Applications. Berkeley, CA: Univ. California Press, 1958. [ 101 K. Steiglitz, “Computer-aided design of recursive digital filters,” ZEEE Trans. Audio Electroacoust., vol. AU-18, pp. 123-129, June 1970. [ l l ] P. Thajchayapongand P. J. W. Rayner, “Recursive digital fiter design by linear programming,” ZEEE Trans. Audio Electro-
acoust., vol. AU-21,pp. 107-112, Apr. 1973. [ 121 L. R. Rabiner, N. Y. Graham, and H. D. Helms, “Linear programming design of IIR digital Titers with arbitrary magnitude functions,” IEEE Trans. Acoust., Speech, Signal Processing, vol. ASSP22, pp. 117-123, Apr. 1974. [13] D. E. Dudgeon, “Recursive filter design using differential correction,” IEEE Trans.Acoust., Speech, Signal Processing, vol. ASSP22, pp. 443-448, Dec. 1974. [14] H. Dubois and H. Leich, “On the approximation problem for recursive digital filters with arbitrary attenuation curve in the passband and the stopband,” IEEETrans. Acoust., Speech, Signal Processing, vol. ASSP-23, pp. 202-207, Apr. 1975. [ 151 C. Charalambous, “Minimax optimization of recursive digital f i ters using recent minimax results,”IEEE Trans. Acoust., Speech, Signal Processing, vol. ASSP-23, pp. 333-346, Aug. 1975. [16] J. A. Cadzow, “Recursive digitalfiitersynthesis via gradient based algorithms,” IEEE Trans. Acoust., Speech, Signal Processing, vol. ASSP-24, pp. 349-356, Oct. 1976. [ 17J H. Clergeot and L. L. Scharf, “Connections between classical and statisticalmethodsof FIR digitalfilter design,” IEEE Trans. Acoust., Speech, Signal Processing, vol. ASSP-26, pp. 463-465, Oct. 1978. [ 181 K. Steiglitz and L. E. McBride, “A technique for identification of linear systems,” IEEETrans. Automat. Contr., vol. AGIO, pp. 461-464, Od.1965.
Abstract-Predictivecodingmethods attempt to minimize therms error in the coded signal. However, the human ear does not perceive signal distortion on the basis of rms error, regardless of its spectral shape relative to the signal spectrum. In designing a coder for speech signals, it is necessary to consider the spectrum of thequantization noise and its relation to the speech spectrum. The theory of auditory masking suggests that noise in the formant regions would be partially or totally masked by the speech signal. Thus, a large part of the perceived noise in a coder comes from frequency regions where the signal level is low. In this paper, methods for reducing the subjective distortion in predictivecodersforspeech signals aredescribedandevaluated. Improved speech quality is obtained: 1) by efficient removal of formant and pitch-related redundant structure of speech before quantizing, and 2) by effective masking of the quantizer noise by the speech signal.
tizing and transmitting only the signal which cannot be predictedfrom the alreadycoded signal. In predictivecoders, the power of the quantizer noise is proportional to the power of the prediction error. Thus, efficient prediction is important for minimizing the quantizer error. Small quantization error, however,does not ensure thatthedistortion in the speech signalis perceptually small; it is necessary to consider the spectrum ofthequantization noise anditsrelation to the speechspectrum. The theoryofauditorymasking suggests that noise in the formant regions would be partially or totally masked by the speech signal. Thus,a large part of the perceived noise in a coder comes fromthe frequency regions where the signal level is low. Moreover, we can tolerate more distortioninthetransitionalsegmentsinspeech(whererapidly changing formants produce wider formant regions) in comparison to the steady segments. In this paper, we discuss methods for modifying the spectrum of the quantization noise in a predictive coding system for speech to reduce the perceptible distortion introduced by suchcoders.Theproperspectralshaping is realized by controlling the frequency response of the feedback networkin the predictive coder independently of the predictor. The methods permit adaptive adjustment of the noise spectrum dependent
I. INTRODUCTION OR autocorrelated signals, such as speech, predictive coding [ 11- [4] is an efficient method of encoding the signal into digital form. The coding efficiency is achieved by quan-
F
Manuscript received July 18, 1978; revised November 28, 1978. B. S . Atal is with Bell Laboratories, Murray Hill, NJ 07974. M. R. Schroeder is with the Drittes Physikalisches Institut, University of Gottingen, Gottingen, Germany, and Bell Laboratories, Murray Hill, NJ 07974.
0096-3518/79/0600-0247$00.75 0 1979 IEEE
IEEETRANSACTIONSONACOUSTICS,SPEECH,
248
AND SIGNAL PROCESSING,VOL. ASSP-21, NO. 3, JUNE 1979
TRANSMITTER
RECEIVER
A
DIGITAL CHANNEL
S A M P L E RS P E E C H
S(t1 En PREDICTOR
(t
6"
Fig. 1. Block diagram of a predictive coder.
theon time-varying speech spectrum. Improved speech quality is obtained both by exploiting auditory masking and byefficientprediction of formantandpitch-relatedredundancies in speech before quantizing. OF QUANTIZING NOISEI N 11. SPECTRUM PREDICTIVE CODERS Fig. 1 shows a schematic diagram of a predictive coder. Its operation can be summarized as follows. The input speech signal is sampled to produce a sequence of sample values so, s l , . * . ,s, * . . The predictor P forms a linear estimate of each sample value based onthe previously decoded output sample values (reconstructed speech samples). This estimate f,is subtracted from the actual sample value s, and the resulting difference q , is quantized and transmitted to the receiver. The quantized difference is added back to the predicted value E, both at the transmitter and at the receiver to form the next output sample ?,. It is readily seen in Fig. 1 that, in the absence ofchannelerrors, the coder output ?, is given by
t,
A
sn = t n + t n
= fn + sn - t n + 6,
=s, t 6,
('1
=sn -
rn 2 ( s n - k6 r z - k ) a k k= 1
where the predictorP is represented by a transversal filter with m delays and m gains a l , a2, . * . ,a , . The quantizer input thus consists of two parts: 1) the prediction error based on the prediction of the input s, from its own past, and 2) the filtered error signal obtained byfiltering of the quantizer error through the filter P. An easy way of modifying the spectrum of the quantizing noise is to use a filter F different fromP for filtering the quantizer error [5], [6]. Fig. 2 shows such a generalized predictive coder. The quantizer input q , is now given by rn
qn =s,
rn S,-kak
-
k=1
6,.-kbk
-
(3)
k=1
where b l , b 2 , . , bv, are m' gain coefficients of transthe versa1 filter F. We will assume that both 1 - F and 1 - P have theirroots inside theunit circle. Thecoder output is now givenas
where 6, is the error introduced by the quantizer (difference between the output and the input of the quantizer) at the nth sample. Thus, the difference between the output and the input speech sample values is identical to the error introduced by the quantizer. Assuming that the spectrum of the quantizer Representing Fourier transforms by upper case letters, (4) can error is white (a reasonable assumption, particularly if the pre- be written infrequency-domain notations as diction error is white), the noise at the output of the coder is also white. $-s=A- 1-F 111. GENERALIZED PREDICTIVE CODER The quantizer input q , in Fig. 1 can be written as rn
1 -P'
For F = P,the output noise is the same as the quantizer noise, and the two coders shown in Figs. 1 and 2 are identical. However, with F # P, the coder of Fig. 2 allows greater flexibility in controllingthespectrum of output noise based onthe
ATAL AND SCHROEDER: PREDICTIVE CODING OF SPEECH SIGNALS
249
RECEIVER
TRANSMITTER
-k-l*
DIGITAL CHANNEL SPEECH
SPEECH
PREDICTOR
1
I
Fig. 2. Block diagram of a generalized predictive coder with adjustable noise spectrum.
UANTIZER
SPEECH 0 SIGNAL
::
b DIGITAL
CHANNEL
B
I
I
+
Fig. 3. Another configuration for the generalized predictive coder with adjustable noise spectrum.
choice of the feedback filter F.' Under the assumption that the quantizer noise is white, thespectrum of the coder output noise isdeterminedonly bythefactor (1 - F)/(1 - P) as shown in (5). Let the squared magnitude of t h s factor at a frequencyfbe r(f).Then
r(f)=I[1-F(e2njfT)]/[1-P(ez*j~)]12
(6)
where T is the sampling interval. Equation (6) implies an important constraint on theaverage value of log r(f),that is,
1fs
log r (f) df = o
(7)
fs
where fs is the sampling frequency. Expressed on a decibel scale, the average value of log r ( f )is 0 dB. The proof of (7) is relatively straightforward [ 7 ] and is outlined below. Consider thefunction 1 - F which is expressed in the z'A somewhat different configuration of a predictive coder for controlling the spectrum of the output noise is shown in Fig. 3. It is easily verified that the Fourier transform of the output noise for this coder isgiven by A ( l -d)/(l - B). In principle, the coder of Fig. 2 can be made equivalent to the coder of Fig. 3 by appropriate choice of the filter F. However, as a practical matter, one or the other coder may be simpler to implement depending on the choice for the spectrum of the output noise.
transform notation as
where zk is the kth root F(z)] is given by
of 1 - F(z). The function log [l
-
m'
log [1 - F ( z ) ] =
lOg(1 - Z k 2 - l ) .
(9)
k=l
Since lzkl < 1 (all the zeros of 1 - F ( z ) are inside the unit circle), the right side of (9) can be expressed as a polynomial function of 2 - l . Therefore, m
n=1
-
n=~I
where c, = z z . The integral of log [l - F ( z ) ] over the frequency range from 0 to f, is then given by
Similarly, it can be shown that
IEEE TRANSACTIONS ON ACOUSTICS, SPEECH,
250
t
1
t’
AND SIGNAL PROCESSING,
VOL. ASSP-27, NO. 3, JUNE 1979
Prediction Based on Spectral Envelope Prediction based on the spectral envelope involves relatively shortdelays.Thepredictor can be characterizedinthe ztransform notation as
P,(z) =
P
akz,k
(1 3 )
k =1
where z-l representsadelayofonesampleintervaland
a l , a 2 , . . . ,ap are p predictorcoefficients.The value of p typically is 10 for speech sampled at 8 kHz. A higher value may often be desirable. The input to the quantizer in Fig. 2 consists of two parts: 1) the prediction error d , based on the prediction of the input 00 1 2 3 -4 0 0 s, from its own past, and 2) the filtered error signal f, obFREQUENCY (kHz) FREQUENCY (kHz) tained by filtering of the quantizer noise 6, through the filter Fig. 4. Twopossible shapes forthe spectrum of outputnoise(solid curve) in the coder shown in Fig. 2. T h e average level of the logarith- F. Under the assumption that the quantizer noise is uncorthe total power eq at the mic spectrum (shown as a dashed line) is the same in both cases. The related with the prediction error, speech spectrum is shown by the dotted curve. input to the quantizer is the sum of the powers in the prediction error d, and the filtered noise f,. That is,
/,”
log [l - P(eznjf T ) ] d f = 0.
-
€4 - ep + ef 3
(14)
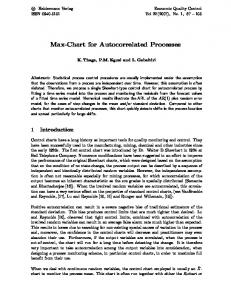
where ep is the power in thepredictionerrorand ef is the power in the filtered noise. It is our experience that, for satisfactory operation of the coder, ef should be less than e p . The power in the filtered noise is determined both by the power in the quantizer error 6, and the power gain G of the filter F. The power gain G equals the sum of the squares of the filter coefficients. For F = P,, the power gainis usually large and can often exceed 200. Such a highpower gain causes excessive feedback of the noise power to the quantizer input, particularly for coarse quantizers, resulting in poor performance of the coder. Excessive feedback can be prevented by requiring that the power gain of the filterP,(z) is not large. The reason for the high power gain is as follows. The spectrumofthefilter 1 - P,(z) is approximatelythe reciprocal of the speech spectrum (within a scaling constant). The low-pass filter used in the analog-to-digital conversion of thespeech signal forces the reciprocalspectrum(andthus I 1 - P,(z)l) to assume a high value in the vicinity of the cutoff frequency of the filter. The power gain, which is equal to the integral of the power spectrum 11 - Ps(e2nifr)12 with respect to thefrequency variable f,thus also becomes large. These artificially high power gains will not arise if the lowIV. APPLICATION TO SPEECH SIGNALS pass filter used in the sampling process was an ideal low-pass A . Selection of Predictor filterwithacutofffrequencyexactlyequal to the half the Linear prediction is a well-known method of removing the sampling frequency. The amplitude-versus-frequency response redundancy in a signal. Forspeech,theprediction is done of a practical low-pass filter falls off gradually. The computed most conveniently in two separate stages [4], [8] : a first pre- covariance matrix used in LPC analysis therefore has missing componentscorresponding tothe speech signal rejectedby diction based on the short-time spectral envelope of speech, and a second prediction based on the periodic nature of the the low-pass filter.The missing high-frequencycomponents spectralfinestructure.Theshort-timespectral envelope of produce artificially low eigenvalues of the covariance matrix speech is determined by the frequency response of the vocal corresponding to eigenvectorsrelated to suchcomponents. tract and for voiced speech also by the spectrum of the glottal The high power gainof P, is precisely caused by the small low-pass filtered pulse.Thespectralfinestructure arising from the quasi- eigenvalues. The covariance matrixofthe speech is nearly singular therebyresultinginanonunique periodic nature of voiced speech is determined mainly by the a variety of difpitchperiod.Thefinestructurefor unvoiced speech is ran- solution of the predictor coefficients. Thus, ferent predictor coefficients can approximate the speech dom and cannot be used for prediction. Equation (7) follows directly from(1 1) and (12). Assuming that the power of the quantizer noise 6, is not changedsignificantlybythefeedback loop-a desirableconditionforsatisfactoryoperationofthecoder-the average value of log power spectrum of output noise is then determined solely by the quantizer and is not altered by the choice of the filter F or the predictor P. The filter F, however, redistributes the noisepowerfromonefrequency to another. Thus, reduction in quantizer noise at one frequency can be obtained only at the expense of increasing the quantizer noise at anotherfrequency. Since a large partof perceived noise in a coder comes from the frequency regions where the signal level is low, the filter F can be used to reduce the noise in such regions while increasing the noise in the formant regions where the noise could be effectively masked bythespeech signal. Some examples of the possible shapes for the spectrum of the quantizing noise together with the speech spectrum are illustrated in Fig. 4. In each case, the logarithmic spectrum of the quantizing noise has equal area above and below the average level shown by the dashed line.
ATAL AND SCHROEDER: PREDICTIVE CODING OF SPEECH SIGNALS
spectrum equally well in the passband of the low-pass fdter. We wish t o avoid solutions which lead to high power gains of the predictorP,. The ill-conditioning of the covariance matrix can be avoided by adding to the covariance matrix another matrix proportional tothe covariancematrix of high-pass filteredwhite noise. We define a new covariance matrix& (with its ( q )term represented by and a new correlation vector c^ (with its ith term represented by F j ) by the equations
251
t
i
Sij)
A
@ij = @ij -+ hemin P i - j
(1 5)
and A
ci = ci 4- XEmin pi
(1 6 )
where
? ! " 1" ' ' 2 ' ' @ij=(sn-isn-j),
cj = (s,sn-
j),
3
4
FREQUENCY (kHz)
Fig. 5. Spectral envelopes of speech based on LPC analysis with highfrequency correction for A = 0 (solid curve) and for A = 0.05 (dotted curve). The power gains in thetwo cases are 204.6 and 12.6, respectively.
A is a small constant (suitablevalues are in therange 0.01-0.10), eminis the minimum value of themean-squared prediction error, pi is the autocorrelation of the high-pass filtered white noise at a delay of i samples, and ( ) indicates averaging over the 204.6 for h = 0 to 12.6 for A = 0.05. The speech signal was speech samples contained in the analysis segment. Ideally, the sampled at a rate of 10 kHz. The anti-aliasing filter had athigh-pass filter should be the filter complimentary to the low- tenuation of 3 dB at 4.2 kHz and more than 40 dB at 5 kHz. pass fdter used in the sampling process. We have obtained reaPrediction Based on Spectral Fine Structure sonablysatisfactoryresultswiththe high-pass filter [$(l Adjacent pitch periods in voiced speech show considerable 2-')I" For this filter, the autocorrelations are p o = $, p1 = - , p2 -- 1 , and p k = 0 for k > 2. By making the scale factor similarity. The quasi-periodic nature of the signal is presenton the noise covariance matrix in (1 5) and (16) proportional although to a lesser extent-in the difference signal obtained to the mean-squared prediction error, we find that it is pos- after prediction on the basis of spectral envelope. The periodsible to use a fixed value of h. The results are not very sensi- icity of the difference signal can be removed by further predictive to small variations in the value of X. The minimum value tion. The predictor for the difference signal can be characterized in the z-transform notation by ofthe mean-squaredpredictionerror is determined by the Cholesky decomposition [8] of the original covariance matrix P ~ ( z ) = P ~ z - ~-+p2Z+' +' + p 3 ~ - ~ - l (1 8) [ ( ~ ~ j ]A . modified form [9] of the covariance method is used range 2 to to determine the predictor coefficients from the new covari- where M represents a relatively long delay in the 20 ms. In most cases, this delay would correspond t o a pitch ance matrix 6. The first two steps in this modifed procedure an integral numberofpitch periods). are identical to the usual covariance method [8]. That is, the period(orpossibly, signal varies with matrix & is expressed as a product of a lower triangular matrix The degree of periodicity in the difference pl, p2, and p3 L and its transpose Lt by Cholesky decomposition and a set of frequency.Thethreeamplitudecoefficients linear equations L q = c^ is solved. The partial correlation at a provide a frequency-dependent gain factor in thepitch-predictionprocess. We founditnecessary to use at leastathirddelay m is obtained from orderpredictorforpitchprediction.Thedifference signal 4m rm = (1 7) after prediction based on spectral envelope has a nearly flat spectrum up to half the sampling frequency. Due to a fixed [