Joint International Conference on Computing and Decision Making in Civil and Building Engineering June 14-16, 2006 - Montréal, Canada
APPLICATION OF SELF-ORGANIZING FEATURE MAPS AND DATA MINING ON ANALYZING ATTRIBUTIONS OF TRAFFIC CRASH LIABILITIES Pei Liu1, Shih-Huang Chen2, Pin-Hon Chen3, Je-Wei Yang4 ABSTRACT In this study, factors critical to crash liability attributions were evaluated through Chi square test and F test. Meanwhile, critical factors were simultaneously evaluated by using fuzzy Delphi process through questionnaires filled by authentication committee members in Taiwan. Factors appeared in both theoretical results and practical opinions are considered truly critical. With identified critical factors and associated liability attribution records of selected crash cases, data mining models and self-organizing feature maps models were generated for frontal, side, and rear collisions of two vehicle crashes, respectively in an attempt to provide appropriate tools for decision support on crash liability authentications. Nine factors, viz. right-of-way, perception, speeding, lane changing, signal status, maneuver, irregularity, mutual position, and perception distance were identified critical. Data mining models were able to give 60 ~ 83% accurate liability authentications, yet incapable to give certain liability attributions. As to SOM models, acceptable silhouette coefficient indicate that generated models can allocate cases to adequate clusters. Meanwhile, qualities of clustering were confirmed by calculated high grey relational coefficients. Although with small data size, a combination of data mining and SOM models were considered to be able to give reasonably good liability attributions predictions and references on given crash cases. KEY WORDS Self-Organizing Feature Maps, Data Mining, Liability Attribution, Silhouette Coefficients, Grey Relational Analysis INTRODUCTION Liability attribution is an important issue for those who involved in traffic crashes, since it is closely related to insurance coverage and compensation matters. However, precise and truly fair determination on liability is actually difficult to achieve due to the complex nature of traffic crash causes. In United States, a police officer can give ticket to the driver that he 1
2
3
4
Assistant professor, Dept. of Transportation & Traffic Eng. & Management, Feng-Chia Univ., 100 WenHwa Rd., Seatwen, TaiChung, 407 Taiwan, 886-4/24524362, FAX 886-4/24520678,
[email protected] Assistant professor, Dept. of Transportation & Traffic Eng. & Management, Feng-Chia Univ., 100 WenHwa Rd., Seatwen, TaiChung, 407 Taiwan, 886-4/24513062, FAX 886-4/24520678,
[email protected] Graduate student, Dept. of Transportation & Traffic Eng. & Management, Feng-Chia Univ., 100 Wen-Hwa Rd., Seatwen, TaiChung, 407 Taiwan, 886-4/24524362, FAX 886-4/24520678,
[email protected] Graduate student, Dept. of Transportation & Traffic Eng. & Management, Feng-Chia Univ., 100 Wen-Hwa Rd., Seatwen, TaiChung, 407 Taiwan, 886-4/24524362, FAX 886-4/24520678,
[email protected]
Page 3030
Joint International Conference on Computing and Decision Making in Civil and Building Engineering June 14-16, 2006 - Montréal, Canada
believes violating traffic regulations right at the crash scene. Due to the fact that accident reconstruction may cost more money and the result may not be very different, insurance company will generally follow that ticket to deal with subsequent matters. However, does the driver who took the ticket really deserve that kind of liability? Or maybe the other driver should also take some of the blame? The sad thing is that the answer to this case by case question is generally unknown. In Taiwan, crash liabilities can’t be determined directly by police officer. Before any agreement can be reached, crash case will normally be sent to government founded local authentication committee (LAC) for suggestion on liability attribution. A system of five levels of liabilities, viz. full, major, even, minor, and none, is adopted by the authentication committees. If the suggestion made by LAC is not acceptable to any party involved, that case can be sent to the supreme authentication committee (SAC) for further review. The suggestion made by SAC is the final conclusion from the authentication committee system. Basically, LAC and SAC serve the society with an effort to provide righteous liability authentication. However, suggestions from either LAC or SAC just served as a reference to judges, and are still challengeable by prosecutors and counselors. Considering the consequence of financial and legal burden that involved drivers may have, we believe that there is a need to construct a reference tool for liability attribution. Our motivation in the present study is thus to establish analytical models for prediction of liability attributions of traffic crashes. Meanwhile, a decision support tool capable of providing previously authenticated crash cases similar to questioned case for liability attribution reference is also attempted. Statistical methods are the prevalent analytical tools used in traffic safety related studies (Miaou 1987, Bauer et al. 1996). However, tools use computational techniques from statistics, machine learning, and/or pattern recognition are needed for this study. Hence, artificial neural networks (ANN) and data mining were selected for proposed model generation. ANN has been proven to be capable of modeling complicated multivariate phenomena. It has been applied to many areas of studies, but seldom in traffic safety studies. On the other hand, data mining is the practice of automatically searching large stores of data for patterns. Application of data mining on traffic safety studies have been attempted lately. Brief review of previous studies using ANN and data mining is given in following paragraphs. Kuhnert et al. (2000) used classification and regression tree (CART), multivariate adaptive regression splines (MARS), and logistic regression to study severity of motor vehicle injuries. They found that logistic regression gave less accurate results than CART and MARS. Meanwhile, better predictions were obtained when they combined these methods together. Chen (2004) applied CART and negative binomial model (NBM) to analyze highway crashes and importance of corresponding factors. He found that secondary crashes are prone to occur when AADT greater than 4,677 is observed; whereas crash rate will be lower when AADT is less than 2,096. He also observed that CART has better accuracy than NBM. Wang (2004) also reported that CART is a better tool than Multinomial Logit model. Lagus (2002) applied SOM algorithm to speed up text retrieval. He concluded that a document map created for interactive exploration of a text collection can be successfully utilized as a clustering in speeding up document retrieval. Ferran et al. (1994) used SOM algorithm to cluster 1,758 human protein sequences stored in the SwissProt database (release
Page 3031
Joint International Conference on Computing and Decision Making in Civil and Building Engineering June 14-16, 2006 - Montréal, Canada
19.0) into families. They found although network training is time consuming, the classification of a new protein in the final ordered map is very fast. Moreover, Roussinov and Chen (1999) compared performance of SOM with that of Ward's clustering method. They concluded that their implementation of Ward's clustering is slightly more precise in detecting associations between documents, but that the performances of these techniques in terms of recall of those associations are not statistically different. This suggests that SOM has clustering abilities close to those of known clustering techniques, and thus is still a viable option for text clustering and categorizing systems. The abovementioned studies imply that both data mining and SOM are suitable for the current study. ANALYTICAL FRAMEWORK FACTOR DETERMINATION AND DATA PROCESSING To construct a usable analytical model, the required input factors have to be critical, clearly defined, and easily collectable. Hence, factors critically related to authentication suggestions should be selected as input factors for the proposed SOM model. In this study, common factors from both statistical approaches and expert questionnaire were selected as model input factors. Due to the fact that influence factors to traffic crashes adopted by various researchers differ vastly, factors ever appeared in all reviewed literatures were first summarized (Miaou & Lum 1993, Lee et al. 2002, Abbas 2004). Up to 164 factors were listed in the original data base; whereas most of them are similarly defined. Hence, only 29 frequently and commonly used factors, including 22 nominal and 7 continuous ones, stayed on the list after subjective judgment and discussion. Meanwhile, those continuous factors were converted to nominal ones for further analysis. Chi square test and F test were performed respectively for each factor to identify its significance. For Chi square test, 0.05 significance level was used for all factors, whereas degree of freedom varied with respect to each factor. As to the F test, Wilks’ lambda, F value, and P value were calculated for each factor, meanwhile same significance level was also selected for testing significance. Factors identified significant by both Chi square test and F test results were considered as statistically determined critical factors. Table 1 lists test results from Chi square test and F test. It can be seen that only 14 factors are statistically significant. To avoid unreasonable result from pure statistics, including professional opinion on critical factor determination was attempted. Questionnaires were sent to LAC and SAC members for critical factors practically considered in authentication meetings. Fuzzy Delphi method was adopted to determine such factors. Likert scaling was used in the questionnaire. Total 110 questionnaires were sent to committee members, 56 of them were retrieved, and 48 out of these filled questionnaires were valid. Then from calculated fuzzy membership function of each factor, 14 expert recognized critical factors were identified (as listed in table 1). When these factors were identified, those common to statistically determine critical factors were picked as input factors for the proposed SOM model. It can be seen from table 1 that nine critical factors were finally identified, viz. right-of-way, perception, speeding, lane changing, signal status, maneuver, irregularity, mutual position, and perception distance.
Page 3032
Joint International Conference on Computing and Decision Making in Civil and Building Engineering June 14-16, 2006 - Montréal, Canada
It can be observed that committee members take right-of-way as the key factor in liability authentication. Meanwhile, factors related to drivers’ behavior, such as lane changing, irregularity, and speeding etc. are also considered critical. On the other hand, statistically determined critical factors do not exhibit such clear trend related to driver’s behavior. It is also interesting to note that driver death, whether passed center of intersection, vehicle type, roadway type, and driver admitted speed are statistically significant, yet are considered less important by LAC or SAC members. Actually, it can be concluded from expert questionnaire results that these factors have nearly no effect on determination of liability authentication at all. Consequently, this result confirms the hypothesis that there is a need to combine statistical and subjective evaluation on critical factors. As to the crash date set, crashes occurred in Taiwan from 1999 to 2001 and have been reviewed by both SAC and LAC was surveyed. Those two-vehicle crashes being given the same suggestion on liability authentication by LAC and SAC were selected. The reason for taking only two-vehicle crashes into consideration were mainly due to the fact that crashes involved with one vehicle only, three or more vehicles, pedestrians, or motorcycles may be very complicated and could induce divergent results. It should be noted that crash reports without information related to those selected model input factors were neglected for model generation purpose. Consequently, only 461 two-vehicle cases out from over 10,000 reviewed cases were selected. Among them, 418 cases were used for SOM model generation; other 43 two-vehicle cases (17 rear collision cases, 12 side collision cases, and 14 fontal collision cases) were selected for model validation. In order to construct more precise models, the 418 training cases were further divided into 126 frontal collisions, 131 rear collisions, and 161 side collisions. Distribution of liabilities of selected crash cases is given in table 1. Table 1. Distribution of liability of driver #1 in the studied data set Liabilities Collisions cases Rear % cases Frontal % cases Side %
full 63 48 47 37 21 13
Liabilities of driver #1 major even minor 11 8 8 8 6 6 28 12 13 22 10 0 70 8 52 43 5 32
none 41 31 26 21 10 6
total 131 100 126 100 161 100
It can be observed from table 1 that 79% of rear collisions were authenticated with full liabilities to either driver involved. This is resulted from the concept that rear vehicle driver has the responsibility to watch out any movement of the vehicle runs in front of him. Similar trend can also be found in frontal collisions. Since frontal collisions normally resulted from unexpected lane invasion of vehicles running from opposite direction, those who crossed the line will almost definitely take full responsibility. Hence full liability will be authenticated when on-site evidence clearly indicates lane crossing behavior of certain driver. Consequently, there are 58% of frontal collisions authenticated with full liabilities to either driver involved. As to side collisions, major-minor type authentication suggestions are normally made by LAC and SAC members (75%) since right-of-way is normally not that
Page 3033
Joint International Conference on Computing and Decision Making in Civil and Building Engineering June 14-16, 2006 - Montréal, Canada
clear in such situation. Apparently, right-of-way plays an important role in practical liability authentication process. DATA MINING MODEL Data mining is a tool generally recognized to have the ability to analyze data from different perspectives and summarize it into useful information. In this study, CART was applied to construct the liability authentication model. CART is a decision tree technique used for classification of a dataset. It provides a set of rules that one can apply to an unclassified dataset to predict which records will have a given outcome. Basically, CART first generates classification trees for a given learning set according to splitting rules. Then it prunes these classification trees individually in a bottom-top way to obtain tree structures with respect to lowest error costs respectively. At last, CART applies cross validation on testing cases to find the lowest error cost and thus the best classification tree for that data set. To construct proposed model for each collision type, those predetermined nine critical factors from both drivers involved (hence total 18 input factors) were adopted as model input variables. Meanwhile, the authenticated liabilities were assigned target variables. Here authenticated liability was a five-level, viz. full, major, even, minor, and none, nominal variable. Nonetheless, the liability of driver #1 was adopted as the only target variable due to the one-output constraint of CART algorithm. Input variables and corresponding attributes are summarized in table 2. For each collision type, 70% and 30% of selected cases were randomly assigned as learning set and testing set. Three lowest error cost classification trees were then generated for each collision type, respectively. Table 2. Summary on input variables and corresponding attributes Variables Liability Right-of-way Perception Speeding Lane_changing Signal_status Maneuver Irregularity
Mutual_position Perception_distance
Corresponding Attributes 1: full ,2: major 3: even,4: minor,5: none 1: yes, 2: no 1: no, 2: yes, 3: unspecified 1: excessive, 2: yes, 3: no, 4: unspecified 1: no, 2: yes, 3: passing, 4: unspecified 1: not intersection, 2: flashing red, 3: flashing yellow, 4: no signal installed, 5: regular traffic light 1: forward, 2: right turn, 3: left turn, 4: U turn, 5: still, 6: backward 1: partially occupied opposite traffic lane, 2: occupied opposite traffic lane, 3: no violation, 4: not driving in specified lane, 5: not following signs, 6: unspecified 1: same direction, leading, 2: same direction, following, 3: same direction, left side, 4: same direction, right side, 5: same direction, roadside in, 6: unspecified, 7: angled direction, left side, 8: angled direction, right side, 9: opposite direction 0: unspecified, 1: 1~100m, 2: 101~200m, 3: over 200m
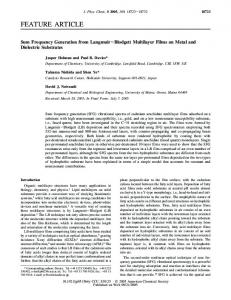
Classification tree generated for side collisions is depicted in figure 1 for model illustration. Nine terminal nodes (TN) and eight splitting rules were generated in this tree. In each terminal node, C1 ~ C5 are liability attributes, and numbers followed are numbers of cases
Page 3034
Joint International Conference on Computing and Decision Making in Civil and Building Engineering June 14-16, 2006 - Montréal, Canada
originally authenticated with corresponding attributes. With such tree structure, an input case can be checked from top node downward through associate nodes and splitting rules, and eventually down to assigned terminal node. Terminal nodes are clusters; all cases assigned to certain terminal node are clustered together and will be authenticated with the same liability as the underlined attribute, which is the dominant one. In figure 1, the splitting rule of node 1 is right-of-way. In this case, either driver # 1 has or has no right-of-way; driving behavior of drivers will then be checked for both branches. For the right branch, if attribution 6 of irregularity was met, signal status of driver #2 will then be checked. Otherwise, driver liabilities of input cases will be determined followed TN7. Similarly, when driver #2 met attribution 2 or 5 of signal status, TN8 will be followed, otherwise TN9 will be followed.
Figure 1. Generated classification tree for side collisions Model validation was carried out by using percent accuracy of predictions. Percent accuracy of generated tree model is defined as the quotient of predicted liabilities to corresponding authenticated liabilities. Table 3 depicts allocations of authenticated and predicted liabilities of crash cases for all three types of collisions. It can be seen that the rear collision model performs best with around 82% accuracy, whereas the frontal collision model has the lowest accuracy at about 65%. Such medium high accuracy levels may be resulted from the small data size adopted in this study. However, it may also inherit from the complex nature of liability authentication. Look into table 3, one can find that all three models gave no even liability authentication. Basically, right-of-way is the key issue on liability attribution, yet it is not easy to make precise judgment on who owns right-of-way. The driver who owns rightof-way should theoretically take no responsibility on traffic crashes. However, even if someone has the absolute right-of-way he still has the responsibility to prevent occurrence of an accident. Hence, driver’s responsibility will be raised if he is judged driving carelessly and
Page 3035
Joint International Conference on Computing and Decision Making in Civil and Building Engineering June 14-16, 2006 - Montréal, Canada
not paying attention to oncoming incidents. In situations similar to what is just discussed, even liability may be authenticated by LAC or SAC members. On the other hand, it seems that data mining algorithms are not capable of adopting such deliberate and compromising thinking. As a result, no terminal node of even liability was generated. However, considering the complex characteristics of liability attributions, such medium high accuracies of all three models should be able to be considered acceptable from an advisory perspective. Table 3. Comparison of authenticated and predicted liabilities for all collisions Learning set Predicted True 1 2 3 4 Rear 5 Total Overall Accuracy 1 2 3 4 Frontal 5 Total Overall Accuracy 1 2 3 4 Side 5 Total Overall Accuracy
1
2
3
4
45 3 1 0 1 49
2 5 0 0 0 8
0 0 0 0 0 0
0 0 0 0 0 0
Testing set
% 5 total Accu. 0 47 95.74 0 8 62.50 3 4 0.00 5 5 0.00 27 28 96.43 35 92
1
2
3
4
5
total
16 1 0 1 0 18
0 2 0 0 0 2
0 0 0 0 0 0
0 0 0 0 0 0
0 0 4 2 13 19
16 3 4 3 13 39
83.70% 35 13 3 2 0 53
0 5 0 0 0 5
0 0 0 0 0 0
0 1 2 3 0 6
0 0 3 3 18 24
79.49% 35 19 8 8 18 88
100 26.32 0.00 37.50 100
11 7 2 0 0 20
1 2 0 0 0 3
0 0 0 0 0 0
69.32% 13 7 1 5 0 26
2 37 0 3 0 42
0 0 0 0 0 0
0 3 4 28 2 37
0 1 0 1 5 7
% Accu. 100 66.67 0.00 0.00 100
0 0 1 4 2 7
0 0 1 1 6 8
12 9 4 5 8 38
91.67 22.22 0.00 80.00 75.00
6 22 3 15 3 49
66.67 72.73 0.00 86.67 66.67
60.53% 15 48 5 37 7 112
86.67 77.08 0.00 75.68 71.43
74.11%
4 1 0 0 0 5
2 16 2 2 0 22
0 0 0 0 0 0
0 5 1 13 1 20
0 0 0 0 2 2
71.43%
SOM MODEL Since data mining models have only medium high accuracy and have difficulty in giving even liability attributions, SOM models were then generated. The aim is to utilize SOM clustering technique to group previous authenticated cases and give clustered cases related to the inquired one for reference. Similar to data mining models, three SOM models were trained based on collision types. As true numbers of clusters of all models were unknown, various grid sizes were first tested to identify reasonable ones. While too many grids may result many zero entry clusters, and too few grids may not be able to generate reasonable clusters, a 5 × 5 rectangular grid was judged adequate for the data set adopted in the current study. To evaluate effect of training functions on quality of SOM models, three topology
Page 3036
Joint International Conference on Computing and Decision Making in Civil and Building Engineering June 14-16, 2006 - Montréal, Canada
functions, three distance functions, and five learning rates were adopted to generate corresponding SOM models. Total 45 SOM models were thus generated for each collision type. The ones with best clustering results were then selected as models for corresponding collision types.
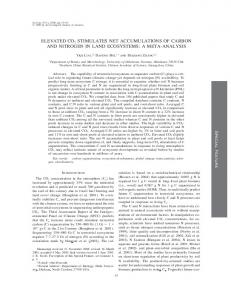
Weight of each cluster Data points (existing cases)
Figure 2. A typical SOM result of this study A typical SOM output is illustrated in figure 2. Basically, a good SOM model should group data points in the same cluster as close as possible, whereas center of weight of each cluster as far as possible. The silhouette coefficient proposed by Kaufman and Rousseeuw (1990) was used to identify the quality of clustering results of each SOM model in terms of map structure and its overlap among other clusters. For a given cluster A, average distance between each point in A and the center of weight of A, as well as the average distance between center of weight of A and the points in the second closest cluster B, were first calculated. Then silhouette of a cluster and the silhouette coefficient (SC) of a SOM model could be calculated. SOM model with the greatest SC is considered the best clustering model generated for that collision type. For effect of training functions on model quality, it was found that there is no apparently good combination for the best SOM models. As a matter of fact, each topology function did generate a best SOM model with respect to specific collision types. On the other hand, in terms of the worst combination, topology function “raintop” along with distance function “dist” generated worst SOM models in all three collision types. This may suggest that such combination is inappropriate for this problem. SOM models with best SC values are listed along with the corresponding training functions in table 4. It can be seen that SC values of the best models are from 0.35 to 0.4. As depicted by Kaufman et al that higher SC values indicate better quality of clustering, meanwhile SC less than 0.25 indicates poor clustering result. Consequently, although not very good, clustering results of these models can be considered acceptable. Again, small sample size could be the cause of such results. Another
Page 3037
Joint International Conference on Computing and Decision Making in Civil and Building Engineering June 14-16, 2006 - Montréal, Canada
thing may be worthy to note is that numbers of clusters are different but similar for each collision type. This implies that 5 × 5 rectangular grid was an appropriate selection for current conditions. Quality of clustering testing cases by generated SOM models were further validated by using grey relational analysis. Each generated model will assign each testing case into one of its predetermined clusters. Writing 18 input variables of the testing case, as well as those cases originally in the same cluster, in a form of 18-tuple vectors. We can calculate the mean valued vectors, absolute differences of all comparing vectors, and the grey relational coefficients. The relational grade of two comparing vectors can be quantified by the mean value of their grey relational coefficients. Grey relational grade can then calculated for every testing case following the aforementioned calculations. The averaged grey relational grades of rear, side, and frontal collisions were found to be 0.8208, 0.8668, and 0.8641, respectively. If two vectors agree at all components, then their grey relational coefficient is 1 everywhere, thus their grey relational grade should be 1. In view of this, the generated SOM models do have the ability to categorize relative similar cases into the same cluster. That is to say, these models can give referable reference cases to users with their own cases. CONCLUSION In this study, factors critical to liability authentications were first evaluated through statistical analysis on selected cases, and through fuzzy Delphi process on questionnaires filled by authentication experts, respectively. Common factors of both theoretical and practical results were considered truly critical to liability authentication. Total 418 cases sieved out from more than 10,000 SAC reviewed crash cases occurred in Taiwan area from 1999 to 2001 were selected as the learning set. Data mining models and self-organizing feature map models were then generated respectively to analyze liability attributions for frontal collision, side collision, and rear collision of two-vehicle crashes. Data mining models were found to be able to give about 65%, 73%, and 82% accurate authentications for rear, frontal, and side collisions, respectively. In terms of complexity of liability attributions, such medium high accuracy can be considered acceptable. However, these models seem to have difficulty in giving even liability attributions, which restricts application of such models. Although even liability is generally a subjective authentication, further study on this issue is still suggested to be done. As to SOM models, it is observed that no training function have fixed effect on quality of clustering of generated models. It seems that try and error is the way to find the best combination of training functions for specific collision type. Compactness and separation of generated SOM models were validated through calculation of silhouette coefficient for each model. It was concluded that these models have acceptable clustering qualities on compactness and separation. Meanwhile, validation of generated models on clustering testing cases by calculation of grey relational coefficients indicate that all three SOM models are capable of giving good quality of clustering results. As discussed earlier, liability attribution itself is not an easy task due to its complex characteristics. The generated data mining models can give acceptable prediction on
Page 3038
Joint International Conference on Computing and Decision Making in Civil and Building Engineering June 14-16, 2006 - Montréal, Canada
authentications for given cases. Meanwhile, the generated SOM models can give previously authenticated and similar cases for reference. Hence, a combination of data mining models and SOM models should be able to provide users valuable advisory on liability attribution of the case he is interested. However, there is still some unsolved questions need to be investigated. Further modification or studies on this topic are definitely suggested. REFERENCES Abbas, A. Khaled (2004), Traffic safety assessment and development of predictive models for accidents on rural on rural roads in Egypt, Accident Analysis and Prevention, Vol. 36, No. 2, pp. 149-163 Bauer, K.M. and D.W. Harwood (1996), Statistical Models of At-Grade Intersection Accidents, Report No. FHWA-RD-96-125, Federal Highway Administration, McLean, VA Chen, W. C. (2004), Analysis of Freeway Accident Frequencies Using Data Mining Techniques, MS Thesis, Grad. Inst. of Trans. & Logistics, National Chia-Yi Univ., Taiwan, 68 pp Ferran, E. A., Pflugfelderp, B., and Ferrara, P. (1994), Self-Organized Neural Maps of Human Protein Sequences, Protein Science, Vol. 3, Issue 3, pp. 507-521. Kaufman, L. and Rousseeuw, P. (1990), Finding Groups in Data – An Introduction to Cluster Analysis, John Wiley & Son, New York Kuhnert, P. M., Do, K. A., McClure, R. (2000), Combining non-parametric models with logistic regression: an application to motor vehicle injury data, Computational Statistics & Data Analysis, 34(3), pp. 371-386 Lagus, K. (2002), Text Retrieval Using Self-Organized Document Maps, Neural Processing Letters 15, pp. 21-29. Lee, C., Saccomanno, F. and Hellianga, Bruce (2002), Analysis of Crash Precursors on Instrumented Freeways, 81st TRB CD-ROM Miaou, S.P. (1987), the Relationship Between Truck Accidents and Geometric Design of Road Sections: Poisson Versus Negative Binomial Regressions," Accident Analysis and Prevention, Vol. 26(4), pp. 471-482 Miaou, S.P., and Lum, H. (1993), Modeling Vehicle Accidents and highway Geometric Design Relationships, Accident analysis and prevention, Vol. 25, No. 6, pp.689-709 Roussinov, G. Dmitri and Chen,Hsinchum (1999), Document clustering for electronic meetings: an experimental comparison of two techniques, Decision Reference systems, Vol. 27, No. 1-2, pp. 67-79 Wang, H. W. (2004), Analysis of Injury Severity of Traffic Accidents Using Data Mining Techniques, MS Thesis, Grad. Inst. of Trans. & Logistics, National Chiayi Univ., Taiwan, 97 pp
Page 3039