ted byâ) this state. Time warping is handled by ..... Jolliffe, I. J. Principal Component Analysis, Springer-Verlag, New York, 1986. 8. Kocsor, A., Kuba, A. Jr. and ...
Application of Feature Transformation and Learning Methods in Phoneme Classification Andr´as Kocsor, L´aszl´o T´oth and L´aszl´o Felf¨oldi Research Group on Artificial Intelligence of the Hungarian Academy of Sciences and of the University of Szeged H-6720 Szeged, Aradi v´ertan´uk tere 1., Hungary {kocsor, tothl, lfelfold}@inf.u-szeged.hu http://www.inf.u-szeged.hu/speech
Abstract. This paper examines the applicability of some learning techniques to the classification of phonemes. The methods tested were artificial neural nets (ANN), support vector machines (SVM) and Gaussian mixture modeling. We compare these methods with a traditional hidden Markov phoneme model (HMM) working with the linear prediction-based cepstral coefficient features (LPCC). We also tried to combine the learners with feature transformation methods, like linear discriminant analysis (LDA), principal component analysis (PCA) and independent component analysis (ICA). We found that the discriminative learners can attain the efficiency of the HMM, and after LDA they can attain practically the same score on only 27 features. PCA and ICA proved ineffective, apparently because of the discrete cosine transform inherent in LPCC.
1 Introduction Automatic speech recognition is a special pattern classification problem which aims to mimick the perception and processing of speech in humans. For this reason it clearly belongs to the fields of machine learning (ML) and artificial intelligence (AI). For historical reasons, however, it is mostly ranked as a sub-field of electrical engineering, with its own unique technologies, conferences and journals. In the last two decades the dominant method for speech recognition has been the hidden Markov modeling (HMM) approach. Meanwhile, the theory of machine learning has developed considerably and now has a wide variety of learning and classification algorithms for pattern recognition problems. The goal of this paper is to study the applicability of some of these methods to phoneme classification, making use of so-called feature-space transformation methods applied prior to learning to improve classification rates. We also present results with the application of such transformations. In essence this article deals with the neural network (ANN), support vector machine (SVM) and Gaussian Mixture modeling (GMM) learning methods and with the transformations linear discriminant analysis (LDA), principal component analysis (PCA) and independent component analysis (ICA). We compare the performance of the learners with that of the HMM on the same feature set, namely the so-called linear prediction-based cepstral coefficients (LPCC). The structure of the paper is as follows. First, we proveide a short review of the phoneme classification problem itself, and suggest some possible solutions. Then we
2
briefly describe the acoustic features that were applied in the experiments and examine the feature transformation methods used. The final part of the paper discusses aspects of the experiments, especially the advantages and drawbacks of each learning method, the effectiveness of each transformation and of course the results obtained.
2 The Task of Phoneme Classification Speech recognition is a pattern classification problem in which a continuously varying signal has to be mapped to a string of symbols (the phonetic transcription). Speech signals display so many variations that attempts to build knowledge-based speech recognizers have mostly been abandoned. Currently researchers tackle speech recognition only with statistical pattern recognition techniques. Here however, a couple of special problems arise that have to be dealt with. The first one is the question of the recognition unit. The basis of the statistical approach is the assumption that we have a finite set of units (in other words, classes), the distribution of which is modeled statistically from a large set of training examples. During recognition an unknown input is classified as one of these units, using some kind of similarity measure. Since the number of possible sentences or even words is potentially infinite, some sort of smaller recognition units have to be chosen in a general speech recognition task. The most commonly used unit of this kind is the phoneme, thus this paper deals with the classification problem of phonemes. The other special problem is that the length of the units may vary, that is utterances can ”warp” in time. The only known way of solving this is to perform a search in order to locate the most probable mapping between the signal and the possible transcriptions. Normally depth-first search is applied (implemented with dynamic programming), but breadth-first search with a good heuristic is also viable.
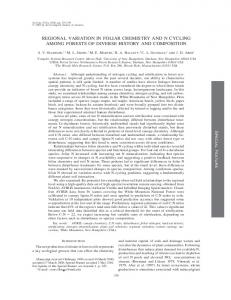
3 Generative and Discriminative Phoneme Modeling Hidden Markov models (HMM)[10] synchronously handle both the problems mentioned above. The speech signal is given as a series of observation vectors O = o 1 ...oT , and one has one model for each unit of recognition C. These models eventually return a class-conditional likelihood P (O|C). The models are composed of states, and for each state we model the probability that a given observation vector belongs to (“was omitted by”) this state. Time warping is handled by state transition probabilities, that is the probability that a certain state follows the given state. The final “global” probability is obtained as the product of the proper omission and state-transition probabilities. When applied to phoneme recognition, the most common state topology is the threestate left-to-right model (see fig.1). We use three states because the first and last parts of a phoneme are usually different from the middle due to coarticulation. This means that in a sense we do not really model phonemes but rather phoneme thirds. Because the observation vectors usually have continuous values the state omission probabilities have to be modeled as multidimensional likelihoods. The usual procedure is to employ a mixture of weighted Gaussian distributions of the form k X ci N (o, µi , Ci ), (1) p(o) = i=1
3
state transition probabilites
states
1
2
3
omission probabilities
observation sequence
o1
o2
o3
...
...
...
...
oT
Fig. 1. The three-state left-to-right phoneme HMM.
where N (o, µi , Ci ) denotes the multidimensional normal distribution with mean µi and covariance matrix Ci , k is the number of mixtures, and ci are non-negative weighting factors which sum to 1. In the following experiments we apply these Gaussian mixture models (GMM)[3] not only in HMMs but also in isolation, so as to model the conditional likelihood P (X|C) of a set of features X having been generated by a phoneme class C. The final goal of classification is to find the most probable class C. We can compute the probabilities P (C|X) from P (X|C) given by class-conditional or generative models like HMM and GMM making use of Bayes’ law. Another aproach is to employ discriminative learners which model P (C|X) directly. Instead of describing the distribution of the classes, these methods model the surfaces that separate the classes and usually perform slightly better than generative models. Their drawback in speech recognition tasks is that they cannot implicitly handle the ”time-warping” characteristic os speech as HMM can, so on the word-level they have to be combined with some sort of search method. From the family of discriminative learners we chose to experiment with the now traditional artificial neural networks (ANN)[11], and a relatively new technology called support vector machines (SVM). Rather than describing this method in detail here we refer the interested reader to an overview in [14].
4 Evaluation Domain The feature space transformation and the classification techniques were compared using a relatively small corpus which consists of several speakers pronouncing Hungarian numbers. More precisely, 20 speakers were used for training and 6 for testing, and 52 utterances were recorded from each person. The ratio of male and female talkers was 50%-50% in both the training and testing sets. The recordings were made using a cheap commercial microphone in a reasonably quiet environment, at a sample rate of 22050 Hz. The whole corpus was manually segmented and labeled. Since the corpus contained only numbers we had samples of only 32 phones, which is approximately
4
two thirds of the Hungarian phoneme set. Since some of these labels represented only allophonic variations of the same phoneme some labels were fused together, hence in practice we only worked with a set of 28 labels. The number of occurrences of the different labels in the training set was between 40 and 599.
5 Frame-Based and Segmental Features There are numerous methods for obtaining representative feature vectors from speech data[10], but their common property is that they are all extracted from 20-30 ms chunks or ”frames” of the signal in 5-10 ms time steps. The HMM system employed in our experiments was the FlexiVoice speech engine[12] trained and tested by M´at´e Szarvas at the Technical University of Budapest. In his tests he worked with the so-called lpcbased cepstral coefficients (LPCC)[10], so for comparison we conducted a series of experiments with this feature set. To be more precise, 17 LPCC coefficients (including the zeroth one) were extracted from 30 ms frames. The HMM system used the derivatives of these as well, so a speech frame was characterised by 34 features altogether. All the other classifiers were tested within the framework of our speech recognizer called OASIS[8][13]. This is a segment-based recognizer which means that the frames are not evaluated separately and then combined as in the HMM, but certain segmental features are first calculated. The aim of using these segmental features is to model the evolution of the frame-based features in time. In our case the 17 LPCC coefficients were averaged over segment-thirds, and the differences of these were also calculated to model their dynamics. These derivative-like features were also extracted at the segment boundaries. We found that the so-called modulation spectrum[4] also facilitates the classification process. It was evaluated as the 4 Hz Fourier-coefficient of 250 ms sections of the LPCC trajectories. Further segmental features were the variance of LPCC coefficients over the segment and the length of the segment. Thus altogether 154 features were used to describe a complete phoneme. Having found earlier that LPCC is not the optimal representation for our system, we also report findings obtained via the bark-scaled filterbank log-energies (FBLE). This means that the signal is decomposed with a special filterbank and the energies in these filters are used to parameterize speech on a frame-by-frame basis. The filters were approximated from Fourier analysis with triangular weighting as described in[10]. The segmental features were calculated from FBLE in the same way as from LPCC.
6 Linear Feature Vector Transformations Before executing a learning algorithm, additional vector space transformations may be applied on the extracted features. The role of these methods is twofold. Firstly they can improve classification performance, and secondly they can also reduce the dimensionality of the data. Without loss of generality we will assume that the original data set lies in IRn , and that we have l elements x1 , . . . , xl in the training set and t elements y1 , . . . , yt in the testing set. After applying a feature space transformation method, the new data set lies in IRm (m ≤ n), the transformed training and testing vectors being denoted by x10 , . . . , xl0
5
and y10 , . . . , yt0 respectively. With the linear feature space transformation methods, we search for an optimal (in some cases orthogonal) linear transformation IRn → IRm of the form x0i = A> xi (yj0 = A> yj ), noting that the precise definition of optimality can vary from method to method. The column vectors a1 , . . . , am of the n×m matrix A are assumed normalized. These algorithms use various objective functions τ () : IR n → IR which serve as a measure for selecting one optimal direction (i.e. a new base vector). Usually linear feature space transformation methods search for m optimal directions. Although it is possible to define functions that measure the optimality of all the m directions together, we will find the directions of the optimal transformations one-byone, employing the τ measure for each direction separately. One rather heuristic way of doing this is to look for unit vectors which form the stationary points of τ (). Intuitively, if larger values of τ () indicate better directions and the chosen directions needs to be independent in some ways, then choosing stationary points that have large values is a reasonable strategy. In the following subsections we describe three linear statistical methods. Principal component analysis (PCA), linear discriminant analysis (LDA) and independent component analysis (ICA), which will be dealt with in a unified way by defining a τ measure. Although some nonlinear extensions of these methods have been presented in recent years, in this paperwe restrict our investigations to their linear versions. 6.1
Principal Component Analysis
Principal component analysis[7] is a ubiquitous technique for data analysis and dimension reduction. Normally in PCA τ (a) =
a> Ca , a> a
(2)
where C is the sample covariance matrix. Practically speaking, (2 defines τ (a) as the variance of the {x1 , . . . , xl } n-dimensional point-set projected onto vector a. So this method prefers directions having a large variance. It can be shown that stationary points of (2 correspond to the right eigenvectors of the sample covariance matrix C where the eigenvalues form the corresponding optimum values. If we assume that the eigenpairs of C are (c1 , λ1 ), . . . , (cn , λn ) and λ1 ≥ · · · ≥ λn , then the transformation matrix A will be [c1 , . . . , cm ], i.e. the eigenvectors with the largest m eigenvalues. Notice that the new data represented in the new orthogonal basis is uncorrelated, i.e. its covariance matrix is diag(λ1 , . . . , λm ). 6.2
Linear Discriminant Analysis
The goal of linear discriminant analysis[1] is to find a new (not necessarily orthogonal) basis for the data that provides the optimal separation between groups of points (classes). The class label of each point is supposed to be known beforehand. Let us assume that we have k classes and an indicator function f () : {1, . . . , l} → {1, . . . , k}, where f (i) gives the class label of the point xi . Let lj (j ∈ {1, . . . , k}, l = l1 +. . .+lk )
6
denote the number of vectors associated with label j in the data. The function τ (a) is similar to that employed in PCA: τ (a) =
a> Ba , a> Wa
(3)
where W is the within-class scatter matrix, while B is the between-class scatter matrix. Here the within-class scatter matrix W shows the weighted average scatter of the covariance matrices Cj of the sample vectors having label j: W=
k X lj j=1
Cj =
l
(4)
Cj ,
1 X 1 X (xi − µj )(xi − µj )> , µj = xi lj lj f (i)=j
(5)
f (i)=j
and the between-class scatter matrix B represents the scatter of the class mean vectors, µj around the overall mean vector µ: B=
k X lj j=1
l
(µj − µ)(µj − µ)> .
(6)
The value of τ (a) is large when its nominator is large and its denominator is small. Therefore the within-class averages of the sample projected onto a are far from each other, while the variance is small in each of the classes. The larger the value of τ (a), the farther the classes are spaced out and the smaller their spreads will be. Much like in the case of PCA it can be shown that stationary points of (3 correspond to the right eigenvectors of W −1 B, where the eigenvalues form the corresponding optimal values. As in PCA, we again select those m eigenvectors with the greatest real eigenvalues. Since W−1 B is not necessarily symmetric, the number of the real eigenvalues can be less than n. In addition, the corresponding eigenvectors will not necessarily be orthogonal. 6.3
Independent Component Analysis
Independent component analysis [2] is a useful feature extraction technique, originally developed in connection with blind source separation. The goal of ICA is to find directions along which the distribution of the sample set is the least Gaussian. The reason for this is that along these directions the data is supposedly easier to classify. Several measures can be used to assess non-Gaussianity. We always choose from those ones which are non-negative and give zero for the Gaussian distribution. A useful measure of non-Gaussianity is negentropy, but obtaining this quantity via its definition is computationally very difficult. Fortunately, there exist some simpler, readily-computable approximations of the negentropy of a variable y with zero mean and unit variance, e.g. J(y) ≈ (E [G(y)] − E [G(ν)])
2
(7)
7
where G() : IR → IR is an appropriate doubly-differentiable contrast function, E() denotes the expected value and ν is a standardized Gaussian variable. Three conventionally used contrast functions are G1 , G2 and G3 : G1 (y) = y 4 G2 (y) = log(cosh(y)) G3 (y) = − exp(− 12 y 2 )
(8)
It is worth noting that in (7) E(G(ν)) is a constant, its value depending on the contrast function G. For instance in the case of G1 () its value is 3. Hyv¨arinen proposed a fast iterative algorithm called FastICA, which uses these contrast functions [5], [6]. This method defines the functional τ () used for the selection of the base vectors of the transformed space by replacing y with a> x in the negentropy functions above: ¡ ¢2 τG (a) = E(G(a> x)) − E(G(ν)) . (9) Before running FastICA, however, some preprocessing steps need to be performed:
– Centering: An essential step is to shift the original sample set x1 , . . . , xl with its mean µ so as to obtain a set x ˜1 , . . . , x ˜l , with a mean of 0. – Whitening: The goal of this step is to transform the x ˜1 , . . . , x ˜l samples via an ˆ of the orthogonal transformation Q into a space where the covariance matrix C points x ˆ1 = Q˜ x1 , . . . , x ˆl = Q˜ xl is the unit matrix. With the PCA discussed earlier we can transform the covariance matrix into a diagonal form, the elements in the diagonal being the eigenvalues of the original covariance matrix. Thus it only remains to transform each diagonal element to 1. This can be done by dividing the normalized eigenvectors of the transformation matrix by the square root of the corresponding eigenvalue. Consequently, the whitening procedure with a dimension reduction(dim = m) can be computed via: h i> ˜ −1/2 , . . . , ˜ ˜ −1/2 (10) Q := ˜ c1 λ cm λ m
1
where the eigenpairs of the matrix
l
X ˜ =1 x ˜i x ˜> C i l i=1
(11)
˜ 1 ), . . . , (˜ ˜ n ). are (˜ c1 , λ cn , λ After centering and whitening the following statements hold: – Firstly, for any normalized a the mean of a> x ˆ 1 , . . . , a> x ˆl is 0, and its variance is 1. In fact we need this since (7) requires that y has a zero mean and variance of 1, and so because of the substitution y = a> x ˆ , a> x ˆ must also have this property. ˆ R of the transformed points – Secondly, for any matrix R the covariance matrix C Rˆ x1 , . . . , Rˆ xl remains the unit matrix if and only if R is orthogonal, since ¶ µ X 1X 1 > > ˆ CR = Rˆ x1 (Rˆ x1 ) = R x ˆ1 x ˆ1 R> = RIR> = RR> (12) l l
8
Actually FastICA is an approximate Newton iteration method which seeks such an orthogonal basis for the centered and whitened data, where the values of the nonGaussianity measure τG () for the base vectors are large. Note that as the data remain whitened after an orthogonal transformation, ICA may be considered an extension of PCA.
7 Experiments All the experiments were run on the LPCC and FBLE features described in section 5. As mentioned, HMM results were obtained only for the LPCC case. Overall, the exact parameters for the learners and the transformations were as follows. Hidden Markov modeling (HMM). In the HMM experiments the phoneme models were of the three-state strictly left-to-right type, that is each state had one self transition and one transition to the next state. In each case the observations were modeled using a mixture of four Gaussians with diagonal covariance matrices. The models were trained using the Viterbi training algorithm. Gaussian mixture modeling (GMM). Unfortunately there is no closed formula for getting the optimal parameters of the mixture model, so the expectation-maximization (EM) algorithm is normally used to find proper parameters, but it only guarantees a locally optimal solution. This iterative technique is very sensitive to initial parameter values, so we utilised k-means clustering [10] to find a good starting parameter set. Since k-means clustering again only guaranteed finding a local optimum, we ran it 15 times with random parameters and used the one with the highest log-likelihood to initialize the EM algorithm. After experimenting the best value for the number of mixtures k was found to be 2. In all cases the covariance matrices were forced to be diagonal. Artificial neural networks (ANN). In the ANN experiments we used the most common feed-forward multilayer perceptron network with the backpropagation learning rule. The number of neurons in the hidden layer was set at 150 in all experiments except in the case of LDA where a value of 50 was found sufficient because of enormous dimension reduction (these values were chosen empirically based on preliminary experiments). Training was stopped when, for the last 20 iterations, the decrease in the error between two consecutive iteration steps stayed below a given threshold. Support Vector Machine (SVM). In all experiments with SVM a third-order polynomial kernel function was applied. As regards the transformations, in the case of LDA the original 154 dimensions were reduced to only 27, the number of classes minus one. In the case of PCA and ICA we kept the largest m components that retained 95% of the spectrum. In our case m turned out to be 93. Naturally when we applied a certain transformation on the training set before learning, we applied the same transformation on the test data during testing.
8 Results and Discussion Table 1 shows the recognition accuracies where the columns represent the feature sets (transformed/not-transformed) while the rows correspond to the applied learning meth-
9
ods. For the HMM we have only one score, as in this case no transformation could be applied.
ANN GMM SVM HMM
none
none
LDA
PCA
ICA
variable
154
27
93
93
92.53
92.67 91.12 90.89 88.29 89.83 91.08 84.57 80.56 92.11 92.37 88.12 88.07 -
Table 1. Recognition accuracies for the phoneme classification. The maximum is typeset in bold.
Upon inspecting the results the first thing one notices is that the discriminative learners (ANN, SVM) always outperform the generative one (GMM). Hence there is a clear advantage of modeling the classes together rather than separately. Another important observation is that the HMM, in spite of being a generative model, has produced the second highest score. But one has to keep in mind that the HMM uses many more features per phoneme (the exact number depending on the segment length), and also a quite different integration technique. Moreover, it can optimize the division of the observation into thirds (states), while our segmental feature calculation works with rigid phoneme segments. Actually, we consider the fact that we could attain practically the same score with our quite simple feature extraction method as proof that the HMM technology can be easily surpassed with a more sophisticated discriminative segmental phoneme model. We should aslo mention here that our segmental feature calculation method was invented with the FBLE preprocessing in mind and that it works much better with those features. Our current best result with FBLE is 95.55%, which shows that LPCC is definitely not an optimal choice for our system - but the goal of this paper was to compare HMM and the other learners with the same preprocessing technique. As regards the transformations, one can see that after LDA the learners could produce the same or similar scores in spite of the drastic dimension reduction performed (154 features reduced to 27). In an earlier study[9] we found that PCA also retains the recognition accuracy after the dimension reduction. Here, however, one can see that PCA was definitely detrimental. We attribute this to the fact that LPCC inherently contains an orthogonal transformation (the discrete cosine transform), so PCA could not bring any additional gain. ICA was even slightly worse, which accords with our earlier findings, where we could find no could no real advantage of using ICA in the phoneme recognition task.
9 Conclusions and Future Work The main goal of this paper was to test our classification and transformation methods on the LPCC feature set. In previous experiments we used the FBLE features and we clearly outperformed the HMM recognizer (which used LPCC). In contrast to these scores, we now found that we could only reach the same performance. We conclude
10
that our segmental feature calculation method is quite sensitive to the frame-based features, and also that it requires further development. In addition, we plan to make further comparisons with the HMM, but using the same feature set. As regards the transformations, we ascertained that LDA is the most useful one, while PCA and ICA are advantageous only under certain conditions. In the future we intend to study the non-linearized version of these transformations. As regards the applicability of the classifiers in a continuous speech recognizer, with the application of the learners and transformations presented in this paper on the number recognition task we can attain results equivalent to those of the HMM. The interested reader can read about our full recognition system in [13].
10
Acknowledgments
The HMM system used in our experiments [12] was trained and tested by M´at´e Szarvas at the Department of Telecommunications and Telematics, Technical University of Budapest. We greatly appreciate his indispensable help in making this study complete.
References 1. Battle, E., Nadeu, C. and Fonollosa, J. A. R. Feature Decorrelation Methods in Speech Recognition. A Comparative Study. Proceedings of ICSLP’98, 1998. 2. Comon, P. Independent component analysis, A new concept? Signal Processing, 36:287-314, 1994. 3. Duda, R., Hart, P. Pattern Classification and Scene Analysis. Wiley and Sons, New York, 1973.. 4. Greenberg, S. and Kingsbury, B. E. D. The Modulation Spectrogram: In Pursuit of an Invariant Representation of Speech. Proceedings of ICASSP’97, Munich, vol. 3., pp. 1647-1650, 1998. 5. Hyv¨arinen, A. A family of fixed-point algorithms for independent component analysis Proceedings of ICASSP, Munich, Germany, 1997. 6. Hyv¨arinen, A. New Approximations of Differential Entropy for Independent Component Analysis and Projection Pursuit. In Advances in Neural Information Processing Systems, 10:273-279, MIT Press, 1998. 7. Jolliffe, I. J. Principal Component Analysis, Springer-Verlag, New York, 1986. 8. Kocsor, A., Kuba, A. Jr. and To´ th, L. An Overview of the OASIS speech recognition project, In Proceedings of ICAI’99, 1999. 9. Kocsor, A., T´oth, L., Kuba, A. Jr., Kov´acs, K., Jelasity, M., Gyim´othy, T. and Csirik, J., A Comparative Study of Several Feature Transformation and Learning Methods for Phoneme Classification, Int. Journal of Speech Technology, Vol. 3., No. 3/4, pp. 263-276, 2000. 10. Rabiner, L. and Juang, B.-H. Fundamentals of Speech Recognition, Prentice Hall, 1993. 11. Sch¨urmann, J. Pattern Classification, A Unified View of Statistical and Neural Approaches, Wiley & Sons, 1996. 12. Szarvas, M., Mihajlik, P., Fegyo´ , T. and Tatai, P. Automatic Recognition of Hungarian: Theory and Practice, Int. Journal of Speech Technology, Vol 3., No. 3/4, pp. 237-252, 2000. 13. Toth, L., Kocsor, A., and Kov´acs, K., A Discriminative Segmental Speech Model and Its Application to Hungarian Number Recognition, In Sojka, P. et al.(eds.):Text, Speech and Dialogue, Proceedings of TSD 2000, Springer Verlag LNAI series, vol. 1902, pp. 307-313, 2000. 14. Vapnik, V. N., Statistical Learning Theory, John Wiley & Sons Inc., 1998.