Journal of Coastal Research
24
4C
50–60
West Palm Beach, Florida
July 2008
Identification and Visualization of Complex Spatial Pattern of Coastal Dune Soil Properties Using GIS-Based Terrain Analysis and Geostatistics Daehyun Kim†*, Keun Bae Yu‡, and Soo Jin Park‡ Department of Geography Texas A&M University College Station, TX 77843-3147, U.S.A.
[email protected]
†
‡ Department of Geography Seoul National University Seoul 151-742, South Korea
ABSTRACT KIM, D.; YU, K.B., and PARK, S.J., 2008. Identification and visualization of complex spatial pattern of coastal dune soil properties using GIS-based terrain analysis and geostatistics. Journal of Coastal Research, 24(4C), 50–60. West Palm Beach (Florida), ISSN 0749-0208. Coastal dunes display complex relationships among soil properties, vegetation, and geomorphology driven by marine and atmospheric dynamics. Considering topography as a fundamental control of the relations, this study investigated its influence on the spatial pattern of soil attributes in a coastal dune. We systematically collected 193 soil samples at intervals of 20 m from the Sindu coastal dunefield, South Korea, and analyzed 11 soil attributes. Principal component analysis extracted four main factors explaining ca. 75% of total soil variance. Correlation between each soil factor and topographic attributes calculated from raster digital elevation models permitted us to infer relationships between dune configuration and soil spatial variability. Interpretation of the first two factors demonstrated that nutrient input from marine sources by aeolian processes and topographic relief, an indirect measure of depth to the freshwater table, were two major determinants of the spatial distribution of soil properties. For the first factor, distance from the seashore proved to be the most significant indicator of edaphic conditions. Upslope area and wetness index were good proxies for the second factor, dune relief. These two variables significantly explained the distribution of soil moisture. A conceptual model is presented to describe how complex dune soil systems are created from simple topographic effects. The model addresses the importance of integrating foredune, dune slack, and inner dune ridge into one continuous system because topography, geomorphic (aeolian) processes, vegetation, and edaphic conditions are closely connected in a causal chain across the whole dune area. ADDITIONAL INDEX WORDS: Digital elevation model, ordinary kriging, principal component analysis, Sindu coastal dunefield, soil spatial variability, topography.
INTRODUCTION Topography has widely been considered one of the fundamental environmental factors of soil spatial variation (BIRKELAND, 1999; HUGGETT and CHEESMAN, 2002; JENNY, 1941). This view broadly holds that topography strongly controls climatic, geomorphic, and hydrological processes at a variety of spatial scales. On the one hand, geographically different locations on a given landscape provide various microclimatic conditions and so result in the variation of soil properties (FINNEY, HOLOWAYCHUK, and HEDDLESON, 1962; LOTSPEICH and SMITH, 1953; TSUI, CHEN, and HSIEH, 2004). On the other hand, topography affects the spatial distribution of soils by controlling the path of geomorphic and hydrological processes (ANDERSON and BURT, 1978; GERRARD, 1992; PARKER and BENDIX, 1996; SWANSON et al., 1988). This dual view of topography posits that extrinsic aeolian processes, initiating from the surface of sea water and beach, and intrinsic dune relief, an indirect measure of depth to the freshwater table, simultaneously influence soil spatial variability in coastal dune ecosystems. In terms of extrinsically DOI: 10.2112/06-0721.1 received 11 July 2006; accepted in revision 11 July 2007.
driven processes, salt spray and sand grains are continuously transported into the dunes by wind. Because these materials contain various inorganic and organic components, they have been accepted as the most important source of nutrients in dune habitats (CLAYTON, 1972; FAY and JEFFREY, 1992; VAN DER VALK, 1974; YU, RHEW, and KIM, 2004). In this scenario, distance from the seashore explains the spatial gradient of soil properties perpendicular to the shoreline (CARTER, 1988). Topography also influences soil spatial variability through intrinsic surface form, or relief (e.g., HAYDEN et al., 1995). Dune ridges, for instance, enhance the cross-shore gradient of aeolian deposition by providing exposure to and shelter from salt spray and windborne sand (MORENO-CASASOLA, 1988; OOSTING and BILLINGS, 1942). This effect of ridges results in a striking contrast of the amount of salt deposition, between the windward and the leeward slopes, and the crest of foredunes (VAN DER VALK, 1974). In addition, coastal dunes are often characterized by dune ridges and depressions, which are zonally distributed. This relief causes variability in terms of depth to the freshwater table and thus determines the available amount of soil moisture. For example, at dune depressions, slack soils are generally nutrient poor (SCHAT, BOS, and SCHOLTEN, 1984) and experience an
Spatial Pattern of Dune Soil Properties
anoxic condition when flooded during rainy seasons, which sometimes leads to radial oxygen loss (ARMSTRONG, 1975). Despite advances in our understanding of topographic controls on the spatial pattern of dune soil properties (HAYDEN et al., 1995; HESP, 1990; STALLINS, 2001; VAN DER VALK, 1974), significant knowledge gaps remain. First, our knowledge on the relationship is implicitly spatial, qualitative, and theoretical rather than explicitly spatial, quantitative, and empirical. Recently, the rapid development of geographic information systems (GIS) has made great progress in modeling spatial distribution of soil properties using landform attributes calculated from digital elevation models (DEM; MOORE et al., 1993; ODEH, CHITTLEBOROUGH, and MCBRATNEY, 1991; PARK and BURT, 2002; ZHU, 1997). This kind of numerical exploration, however, has not been attempted in the coastal environment on small, localized scales. In addition, there is a paucity of holistic soil–landscape information on the dune area encompassing foredune, dune slack, and inner dune because much coastal research has focused upon only one of these three zones (e.g., GROOTJANS, ERNST, and STUYFZAND, 1998, for slack; VAN DER VALK, 1974, for foredune). This reductionist approach has enabled the acquisition of detailed insights spatially confined to a certain subpart of dunefields. We suggest, however, an integration of the soil–topography relations into a whole dunefield as an important step for understanding and managing complex coastal dune ecosystems. Finally, much is not known about the complex geochemical interaction among various dune soil attributes, as well as the distribution and extent of each soil property in response to dune topography at the landscape level, which is also a question in general soil science (GERRARD, 1992; HUGGETT, 1975). Topography, geomorphic (aeolian) processes, vegetation, and edaphic conditions are closely connected in a causal chain across a whole dune area. In this study, we attempt to understand how complex patterns of soil properties are created from simple topographic effects across a continuous dunefield encompassing foredune, dune slack, and inner dune ridge. As a basis of this exploration, we adopt a general premise that the spatial variation of soil properties has a complex relationship with distance from the seashore and dune surface morphology. A detailed understanding of soil spatial patterns is necessary for effective management of a landscape (BURROUGH, 1993). Such an understanding in the coastal dune provides unique challenges, because a dune is located at the complex interface of terrestrial, marine, and atmospheric environments. Moreover, it is generally expensive and time-consuming to acquire high-resolution soil information by traditional field-soil surveys. It is much easier to observe geographic location and landform than to identify underlying soil patterns and processes at a given landscape. If some topographic factors prove to have reliable and consistent relationships with the underlying soils in this research, then they may also be used as efficient indicators of soil spatial variability at other dunes with similar climatic, pedological, and ecological settings (GESSLER et al., 1995). In addition, a quantitative approach in this kind of study can give more objective soil information and be useful in modeling the behavior of individual soil properties (MCBRATNEY et al., 2000).
51
To fulfill the research objective, we (1) examine interactions among various soil attributes controlled by dune configuration, (2) quantify the relationships between each topographic parameter and soil properties, (3) identify which topographic variables are the significant indicators of soil spatial distributions, and (4) introduce a conceptual model for an effective and integrative understanding of complex ecological processes and patterns in the coastal dune habitat.
STUDY AREA Intensive soil and topographic surveys were conducted in the Sindu coastal dunefield, located on the coast of the Yellow Sea, South Korea (36⬚49⬘ N, 126⬚11⬘ W to 36⬚52⬘ N, 126⬚13⬘ W; Figure 1). The dunefield ranges about 4 km along the coast and 0.5 to 1.5 km inland. Due to a low angle of 1⬚ to 3⬚ and macrotidal condition, the Sindu beach is very flat and wide (more than 400 m at ebbs), so effects of storm-driven overwash can be reduced. Few disturbance agents exist in this ecosystem, except sand burial in winter when a considerable amount of sand is blown by winds generated from the Siberian high pressure system. These weather events provide inputs of nutrients like calcium (Ca2⫹) that are presumed to originate from the large reservoir of shell fragments on the beach (KIM, 2004; SALISBURY, 1952). As the only protected natural area among the dunefields in South Korea, the Sindu coastal dune is a well-conserved ecosystem of dune grasses, shrubs, and trees. Dune vegetation here has the characteristic zonal distribution parallel to the shoreline. This vegetation pattern indicates succession over a long time period and increasing morphological resistance of dunes to disturbance. We expected that topographic gradients should strongly control spatial edaphic patterns. KIM (2004), for instance, reported decreasing concentrations of Ca2⫹ and magnesium (Mg2⫹) with increasing distance from the seashore at Sindu. However, further quantitative connections between other landforms and edaphic factors are still unexplored. We selected a research site characterized by a diversity of landforms and ecological units (Figure 1). At this site, there is a prominent foredune ridge adjacent to the beach, dominated by Elymus mollis and Vitex rotundifoila in a zone parallel to the beach and in small patches, respectively. The late successional species on the second dune ridge is Robinia pseudoaccacia. This ridge is located in the inner part of the dunefield and has higher elevations than the foredune. And last, there is a well-developed dune slack in the middle of the two ridges. Since conditions in this transition zone are ecologically very different from those of the dune ridges due to the presence of freshwater near or at the surface, the dune slack possesses distinct edaphic characteristics and vegetation (GROOTJANS, ERNST, and STUYFZAND, 1998; RANWELL, 1972). Monitoring of this ecosystem for several years has indicated an increase in overall species cover, including the expansion of exotic species (KIM, 2004). These phenomena imply not only human-induced change but also the need for sustainable conservation and management of this habitat. The
Journal of Coastal Research, Vol. 24, No. 4C (Supplement), 2008
52
Kim, Yu, and Park
Figure 1. The location of the study site with soil sampling points and spatial zonation in the Sindu coastal dunefield, South Korea.
Sindu coastal dune, however, is distinguished by a paucity of ecological studies.
METHODS Field Work and Laboratory Techniques Terrain parameters extracted from DEM aided by GIS have widely been used in modeling geomorphological, hydrological, and pedological processes (MOORE, GRAYSON, and LADSON, 1991; WILSON and GALLANT, 2000). We used a total station (Sokkia SET5FS) for ground survey to acquire horizontal (x, y) and vertical (z) coordinates of 1383 points, which was the basis for constructing a DEM of the study area. After a logarithmic transformation of the original topographic data set, we used Surfer威 7.0 (GOLDEN SOFTWARE INC., 1999) to perform semivariogram analysis and create a DEM. Then, we utilized the program DiGeM 2.0 (DIGEM, 2002) to acquire values for topographic descriptors for each grid of the DEM in tandem with the ‘‘Getgridvalue’’ extension of ArcView GIS 3.3 (ENVIRONMENTAL SYSTEMS RESEARCH INSTITUTE,
2000). The eight topographic attributes extracted by the GISbased digital terrain analysis include elevation (meters), slope gradient (radians), aspect (radians), plan curvature (radians m⫺1), profile curvature (radians m ⫺1), upslope area (square meters), wetness index (dimensionless), and distance from the seashore (meters). With the exception of the last three variables, all topographic indices were calculated using a grid-based algorithm developed by ZEVENBERGEN and THORNE (1987). For upslope area, we used a grid-based multiple-flow direction method suggested by F REEMAN (1991). The formula for calculating wetness index was Wetness index ⫽ ln(A tan ⫺1), where A is upslope area and  is slope gradient (MOORE, GRAYSON, and LADSON, 1991). A rectangle of 180 m ⫻ 280 m containing 126 grids of 20 m ⫻ 20 m was set up in the study area (Figure 1). In early August 2003, we collected approximately 1 kg of subsurface soil samples (15 to 20 cm in depth) in the middle of each grid, assuming that the one sample from the middle represented
Journal of Coastal Research, Vol. 24, No. 4C (Supplement), 2008
Spatial Pattern of Dune Soil Properties
Table 1. Soil properties examined at the Sindu coastal dunefield, South Korea. Soil Properties
Variable
Soil moisture (%)
Water
Fine sand (%)
Fine
Organic matter (%) pH in water (⫺log[H⫹]) Electrical conductivity (mS cm⫺1) Nitrate (NO3⫺; mg kg⫺1)
OM pH
Total phosphorus (mg kg⫺1)
TP
Na⫹, Mg2⫹, Ca2⫹, K⫹ (mg kg⫺1)
Na, Mg, Ca, K
EC NO
Methods and Description
Gravimetric method with oven drying at 105⬚C (Topp, 1993) The ratio of fine sand (0.10 to 0.25 mm) to total collected sample in weight Dry ashing at 600⬚C for 6 hours Soil pH in distilled water (1:2.5, w:v) Fixed-ratio extract (Rhodes, 1982) 1. Extraction of NO3–N with 2.0 M potassium chloride (KCl; Maynard and Kalra, 1993) 2. N:P flow injection analyzer (Model No. FIAstar 5000) 1. 1.0 M ammonium acetate (NH4OAc) extraction method (pH 7.0; Simard, 1993) 2. Inductively coupled plasma– atomic emission spectrometry (Model No. Shimadzu ICPS-7500) As above
the edaphic characteristics of the whole grid. However, when a grid showed visible heterogeneity in terms of vegetation cover inside it, and thus microscale soil variability was expected, more than one soil sample was taken from such a grid because it was hard to posit that only one sample could represent the whole area of 20 m ⫻ 20 m. A total of 193 soil samples were analyzed to acquire 11 physical and chemical soil properties (Table 1). Selecting optimal spatial resolutions is a central issue in DEM applications because environmental correlations between soil properties and landform variables from the DEM are strongly determined by its cell size (THOMPSON, BELL, and BUTLER, 2001). Thus, this study examined the strength of correlations between each soil property and terrain attributes acquired from various DEM grid resolutions (5, 7.5, 10, 15, 20, 25, 30, 35, 40, and 45 m) in order to detect the optimal spatial resolutions for predicting the distribution of soil properties. For example, correlations with topography were maximized for soil pH at these grid sizes: elevation 45 m, slope gradient 7.5 m, slope aspect 30 m, plan curvature 45 m, profile curvature 15 m, upslope area 25 m, and wetness index 25 m.
Statistical Methods To decipher the spatial distribution of soil properties in relation to topographic factors, we used principal component analysis (PCA), correlation analysis, and regression analysis (TER BRAAK, 1995; WHITTAKER, 1967). An ordination technique, PCA is widely used in ecology and soil science to rearrange and simplify complicated data structures (SONDHEIM, SINGLTON, and LAVKULICH, 1981; TER BRAAK, 1995). Since the number of soil variables was large, we used PCA to reduce the data into a manageable set of descriptors. The
53
technique was chosen under the assumption that some identifiable factors should exist as the main environmental controls of soil patterns even in a complex coastal dune soil system. We only extracted main components with eigenvalues greater than one (cf. CATTELL, 1978). After extraction of principal components, Varimax rotation was performed to orthogonally transform the configuration of the ordination diagram into new axes to make the components more interpretable (WEBSTER and OLIVER, 1990). The last step of PCA was to make new groups of soil variables according to their factor loadings. That is, the variables with a large factor loading were sorted and regrouped (Table 2), which was helpful for investigating the relative contribution of each variable to the principal components. After the ordination procedure, Pearson’s correlation analysis and stepwise multiple linear regression were conducted to investigate the relationship between principal components and topographic variables. The inclusion and exclusion criteria in the stepwise regression was an F-ratio probability greater than 0.05 and less than 0.01, respectively. To estimate the relative influence of each topographic attribute on principal components, all regression coefficients were standardized. When our soil data showed nonnormal distribution, they were transformed to look like the normal curve of errors before statistical analyses. Z-score transformations were also conducted so that the average and standard deviations of all variables became 1 and 0, respectively. This standardization enables direct comparison of scores from different distributions (SOKAL and ROHLF, 1995).
Spatial Interpolation The process of spatial interpolation provides information about the spatial structure of soil attributes. We constructed semivariogram models of each soil variable using S-Plus威 6 for Windows (KALUZNY et al., 1998). Empirical semivariography showed a certain degree of nugget effect for most soil attributes; thus, we included the effect in modeling semivariograms. This was because we did not exclude any possibility that there might be measurement error in soil analyses and that the sampling interval (ca. 20 m) might not capture microscale soil variability. In addition, the models took zonal anisotropy into consideration since, for all soil properties, there was the directionality in spatial autocorrelation between soil samples. On the basis of the semivariogram models, Surfer威 7 (GOLDEN SOFTWARE INC., 1999) was used to draw interpolated maps for each soil attribute using ordinary kriging.
RESULTS AND DISCUSSION PCA and Correlation with Terrain Attributes Four principal components produced by PCA explained 74.79% of total soil variance (Table 2). Soil attributes on the first principal component (PC 1) also had relatively high factor loadings on the second component (PC 2), with Mg2⫹, Ca2⫹, and soil pH loadings the strongest (0.52, 0.58, and 0.39, respectively). It can thus be inferred that there is a significant control playing a common role in both PC 1 and PC 2.
Journal of Coastal Research, Vol. 24, No. 4C (Supplement), 2008
54
Kim, Yu, and Park
Table 2. Factor matrix after VARIMAX rotation of the soil attributes measured at the Sindu coastal dunefield, South Korea. Factor Loadings and Communality in PCA Group
Variable†
Mean
CV (%)‡
PC 1
PC 2
PC 3
PC 4
Communality
4.75 1.87 0.75 9.65 1.24
21.89a 61.50c 46.67b 180.49c 22.58a
0.82 0.79 0.75 0.72 0.70
0.15 0.52 0.21 0.58 ⫺0.17
0.20 0.09 ⫺0.23 0.04 0.06
0.05 ⫺0.02 ⫺0.08 ⫺0.06 0.11
0.734 0.909 0.669 0.849 0.532
6.98 7.13 74.67
10.60b 85.41c 10.07d
0.39 0.18 0.27
0.81 ⫺0.80 0.66
⫺0.03 ⫺0.10 ⫺0.10
⫺0.07 0.10 0.13
0.807 0.691 0.539
PC 1
K Mg EC Ca OM
PC 2
pH Water Fine
PC 3
TP Na
0.91 2.60
100.00c 26.15b
0.06 0.02
0.07 ⫺0.07
0.87 0.86
0.02 ⫺0.07
0.773 0.754
PC 4
NO
0.77
46.75a
0.02
⫺0.02
⫺0.04
0.98
0.970
Eigenvalue Variance explained (%) Cumulative percentage (%)
3.122 28.386 28.386
2.441 22.194 50.579
1.634 14.856 65.435
1.029 9.358 74.794
Kaiser-Meyer-Olkin measure of sampling adequacy ⫽ 0.767. Barlett test of sphericity ⫽ 1121.532, significance ⫽ 0.000. CV ⫽ coefficient of variation, PC ⫽ principal component, PCA ⫽ principal component analysis. † See Table 1 for the abbreviations. ‡ Coefficient of variation calculated after a transformation (a ⫽ squared root, b ⫽ logarithms, c ⫽ negative reciprocal squared root, d ⫽ square).
The correlation coefficient matrix (Table 3) between principal components and topographic attributes revealed distance from the seashore has a close correlation with the first two components (r ⫽ ⫺0.38 to ⫺0.62, p ⬍ 0.01). This result was in good accord with our multiple regression analysis (Table 4), where distance proved to be a significant explanatory variable for both PC 1 and PC 2 (standardized regression coefficient  ⫽ ⫺0.54 to ⫺0.55, p ⬍ 0.001). Thus, the close relationship noted for PC 1 and PC 2 may result from the common effect of distance from the seashore. In addition, it should also be noted that PC 2 showed the highest correlation coefficients with upslope area and wetness index (r ⫽ ⫺0.50 to ⫺0.55, p ⬍ 0.01; Table 3) and was significantly explained by the two variables in the regression model ( ⫽ ⫺0.21⬃⫺0.24, p ⬍ 0.01; Table 4).
Interpretation of Principal Components PC 1: Effect of Nutrients Input from Marine Sources Soil properties loading on PC 1 may be interpreted as an effect of nutrients input from the surface of sea water and beach by aeolian processes. It is well known that salt spray and sand depositions play a central role in the overall nutri-
ent budget of the dune soil system and that their magnitude is strongly controlled by the topographic position in relation to dominant onshore winds (CLAYTON, 1972; FAY and JEFFREY, 1992; VAN DER VALK, 1974; YU, RHEW, and KIM, 2004). Exchangeable cations in PC 1—potassium (K⫹), Mg2⫹, and Ca2⫹—are presumed to be from these sources, which is supported by their decreasing concentrations with distance from the seashore (e.g., Figures 2a and 2b). We posit that the spatial pattern of electrical conductivity (EC) was influenced by the pattern of these nutrients. EC increases as more salt is dissolved in water and so provides an indirect measurement of the salt content (BRADY and WEIL, 2002). High positive correlations of EC with the cations confirm the close geochemical relationship (e.g., r ⫽ 0.68, p ⬍ 0.01 with Ca2⫹). The input of organic matter may be attributed to the influence of tidal litter and fecal pellets made by small crabs on the beach. First, tidal litter is suggested as compensating for the lack of nutrients of inner dune soils when it is deposited at the top of the foreshore in strandlines (RANWELL, 1972). Second, the Sindu beach is well known for innumerable fecal pellets that a great number of Ocypoda stimpsoni make with sand grains and their secretion during low tides (KIM, 2004).
Table 3. Pearson’s correlation coefficient matrix between principal components and topographic attributes at the Sindu coastal dunefield, South Korea. Variables†
PC PC PC PC
1 2 3 4
ELEV
SLOP
ASPE
PLAN
PROF
UPAR
WETI
DIST
⫺0.37† 0.28† 0.23† 0.18‡
⫺0.40† 0.43† 0.17‡ ⫺0.13
⫺0.37† ⫺0.22† 0.10 ⫺0.13
⫺0.13 0.12 0.17‡ ⫺0.08
⫺0.15† 0.15‡ 0.17‡ 0.22†
0.06 ⫺0.50† ⫺0.18‡ 0.07
0.37† ⫺0.55† ⫺0.21† 0.11
⫺0.62† ⫺0.38† 0.21† 0.06
ASPE ⫽ slope aspect, DIST ⫽ distance from the seashore, ELEV ⫽ elevation, PC ⫽ principal component, PLAN ⫽ plan curvature, PROF ⫽ profile curvature, SLOP ⫽ slope gradient, UPAR ⫽ upslope area, WETI ⫽ wetness index. † Significance level less than 0.01 (two tailed). ‡ Significance level less than 0.05 (two tailed).
Journal of Coastal Research, Vol. 24, No. 4C (Supplement), 2008
Spatial Pattern of Dune Soil Properties
Table 4. Multiple regression models between principal components and topographic attributes at the Sindu coastal dunefield, South Korea.
Group†
Regression Models†
R2*
DW‡
Standard Error
PC 1
2.15e⫺16 ⫺ 0.55(DIST) ⫺ 0.17(ASPE)
0.40
1.651
0.777
PC 2
1.01e⫺15 ⫺ 0.24(WETI) ⫺ 0.54(DIST) ⫹ 0.32(ELEV) ⫺ 0.21(UPAR) ⫹ 0.15(SLOP)
0.59
1.498
0.644
PC 3
0.001 ⫹ 0.22(ELEV) ⫹ 0.15(PLAN)
0.07
1.514
0.971
PC 4
8.56e⫺18 ⫹ 0.22(PROF)
0.04
1.756
0.978
* R2, coefficient of determination. † See Table 3 for the abbreviations. ‡ Durbin-Watson test statistics.
55
PC 3: Effect of Unidentified Factor It is thought that PC 3 reflects the influence of an unidentified factor. Although the component seemed to have a degree of correlation with some topographic attributes (Table 3), regression analysis revealed the inability of these attributes to explain it (R2 ⫽ 0.07). In addition, it is difficult to interpret the spatial distribution of total phosphorus (total P) using any topographic indicator, such as relief and distance from the seashore (Figure 2e). It is thus necessary to consider factors other than topography in order to understand the spatial variation of total P and exchangeable sodium (Na⫹) in the Sindu dunefield.
PC 4: Effect of Biological Interaction between Vegetation and Soil PC 2: Effect of Topographic Relief and Nutrients Input The pattern of soil properties in PC 2 demonstrates the influence of both topographic relief and supply of nutrients from the marine environment. For instance, the low soil pH within dune slack and the microscale cross-shore gradient of pH on the foredune (Figure 2c) indicate low carbonate content (an effect of topographic relief) and cross-shore gradient of Ca2⫹ (an effect of salt spray inputs), respectively. In an earlier study, lower soil pH at the slack corresponded with a gradual decrease in the carbonate content through time (SALISBURY, 1925). Such a decrease occurs when carbonate in soils is exposed to rainfall and dissolves to a soluble bicarbonate form to percolate downward to the freshwater table, where it may flow out of the dune system (R ANWELL, 1972). The rapid leaching of carbonate at the Sindu dune slack is plausible in that about a month before our soil sampling, the site had experienced a long-term rainy season during which more than a quarter (ca. 290 mm) of annual precipitation occurred. On the other hand, within the foredune area, soil pH gradually decreases with distance from the seashore ( ⫽ ⫺0.87, p ⬍ 0.001; Figure 2c), as does the concentration of Ca2⫹ ( ⫽ ⫺0.81, p ⬍ 0.001; Figure 2b). Such a close correspondence between the two soil attributes probably resulted from a buffering effect of Ca2⫹ on soil pH (BRADY and WEIL, 2002), which is supported by a high positive correlation coefficient with each other (r ⫽ 0.77, p ⬍ 0.01). In short, on the foredune, the microscale spatial pattern of soil pH well reflects the crossshore gradient of Ca2⫹, an effect of nutrients input from marine sources. Soil moisture content (measured as a percentage) was tightly coupled to the dune relief, expressed as the relative elevation in the study area. Moisture content was highest in dune depressions and lower on dune ridges (Figure 2d). The variability in moisture was pronounced in spite of quite short vertical distance (generally less than 10 m) between the slack surface and the ridge crests. This implies that the uniform sandy substrate with macropores in the study dune allowed soil water to rapidly percolate from the surface of ridges downward into water table (cf. BEVEN and GERMANN, 1982; KELLMAN and ROULET, 1990).
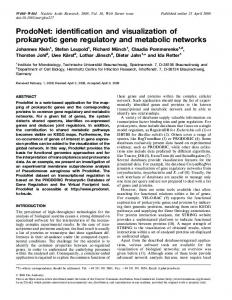
Like the case of PC 3, PC 4 may be interpreted as having no relation with the effect of topography of the Sindu coastal area. Correlation and regression analyses produced extremely low values of correlation coefficients and R2 (Tables 3 and 4). Furthermore, the interpolated map of nitrate distribution shows no constant or interpretable pattern in relation to landform or distance from the seashore (Figure 2f). In light of this evidence, the spatial distribution of nitrate may reflect vegetation cover, at least in the second dune area. There is a dense cover of R. pseudoaccacia in the inner dune ridge, where the concentration of nitrate is relatively high (Figure 3; KIM, 2004). Legumes such as Robinia offset the loss of nitrogen from soil pool through symbiotic nitrogen fixation (HOPKINS and HU¨NER, 2004). BORING and SWANK (1984) reported that R. pseudoaccacia significantly enhanced the symbiotic nitrogen fixation up to ca. 30 kg ha⫺1 year⫺1. The close relationship between the distribution of nitrate and the vegetation cover was further examined according to the observed spatial zonation of the dunefield. Based on dune configuration, distance from the seashore, and vegetation cover, we divided the study dune into four zones (Figure 1): foredune (zone A), dune slack (zone B), the second dune with grasses (zone C), and the second dune with R. pseudoaccacia (zone D). The boxplot in Figure 4 illustrates zone D has a relatively higher concentration of nitrate (milligram per kilogram) than that of the other three zones. The result of a Bonferroni test, one of the simplest multiple comparison procedures examining whether any two group means are equal (NORUSIS and SPSS INC., 1993), supported this difference with the 0.05 significance level.
Overall Best Topographic Indicators of Soil Properties Correlation, multiple regression, and geostatistical analyses and PCA enabled us to identify and visualize the spatial pattern of soil properties for the Sindu coastal dune system based on topographic information. From the interpretation of principal components, we inferred which topographic attributes were better indicators of soil spatial patterns. Our results suggest that distance from the seashore is the most important topographic control of soil spatial variability in the Sindu coastal area. It is inevitable that coastal dune environments are strongly influenced by the adjacent marine sphere.
Journal of Coastal Research, Vol. 24, No. 4C (Supplement), 2008
56
Kim, Yu, and Park
Figure 2. Spatial distributions of main soil properties representing four principal components in the Sindu coastal dunefield, South Korea. (Note: The three-dimensional map of Figure 1 was rotated ca. 180⬚ to make the study field more visible. Interpolated maps of all soil attributes grouped into the same principal component are not presented here because such attributes showed very similar spatial patterns. For example, only the maps of K⫹ and Ca2⫹ among five soil properties are presented for PC 1.)
Journal of Coastal Research, Vol. 24, No. 4C (Supplement), 2008
Spatial Pattern of Dune Soil Properties
57
Figure 3. Interpolated percentage coverage map (inverse distance weighted) of R. pseudoaccacia in the Sindu coastal dunefield, South Korea (Kim, 2004).
We have clearly shown this external effect through the crossshore gradient of major soil properties reflecting the input of materials from the surface of sea water and beach by aeolian processes. Many coastal ecologists have also emphasized the key role of this gradient when they described the zonal distribution of dune plant species (CARTER, 1988; HESP, 1991; HOLTON and JOHNSON, 1979). On the other hand, it should be noted that the distance factor would be less influential had it not been for the foredune ridge. This is because the foredune traps windblown salts and prevents sand movement toward inner dune areas, increasing the difference in the amount of deposited nutrients between windward and leeward sides (VAN DER VALK, 1974). In an ecological sense, foredunes protect dune slack from salt stress and sand burial in this way, and they significantly contribute to the plant zonation in the coastal dune ecosystem (AVIS and LUBKE, 1996; OOSTING and BILLINGS, 1942). Slope aspect, in this regard, is also a good representation of the spatial gradient of incoming nutrients (PC 1: r ⫽ ⫺0.37, p ⬍ 0.01 in Table 3 and  ⫽ ⫺0.17, p ⫽ 0.005 in Table 4). Next, relative vertical positions of dune surface serve as a proxy for depth to the freshwater table and thus water resource availability, which controls ecosystem, landscape, and successional patterns (HAYDEN et al., 1995). We showed that upslope area and wetness index can be effective proxies for the relative elevation. Upslope area is defined as the area above a given length of contour that contributes to flow across the contour (MOORE, GRAYSON, and LADSON, 1991). Because it is directly calculated from DEM, upslope area is called a ‘‘primary topographic attribute,’’ whereas wetness index is a ‘‘secondary topographic attribute’’ in that it is a product of the combination of two primary ones, upslope area and slope gradient. The spatial distributions of upslope area and wetness index well explain that of soil moisture content over the whole study dunefield visually (Figure 5 for wetness index) and statistically (upslope area:  ⫽ 0.34 and wetness index  ⫽ 0.26, p ⬍ 0.001 in Figure 2d). In short, it can be inferred that upslope area and wetness index well represent topographic relief, or relative surface elevation of dunefields, and thus represent the spatial pattern of available soil moisture
Figure 4. Comparison of nitrate contents (mg kg⫺1) among the four spatial zones in the Sindu coastal dunefield, South Korea (A ⫽ foredune, B ⫽ dune slack, C ⫽ second dune with grasses, D ⫽ second dune with R. pseudoaccacia). The highest value of zone D was supported by a Bonferroni test with the 0.05 significance level. See Figure 1 for the spatial zones.
and other geochemically related soil properties (e.g., wetness index:  ⫽ ⫺0.31, p ⬍ 0.001 for soil pH in Figure 2c). Although topographic attributes are often suggested as the main regulators of soil spatial pattern, biological interaction between vegetation and soil also merits attention. If there were a uniform distribution of vegetation over the study area,
Figure 5. Interpolated map of the spatial distribution of wetness index in the Sindu coastal dunefield, South Korea (produced from a 30 m ⫻ 30 m DEM). The distribution of upslope area was very similar to that of wetness index.
Journal of Coastal Research, Vol. 24, No. 4C (Supplement), 2008
58
Kim, Yu, and Park
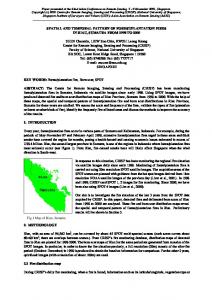
dune crest aided by strong onshore winds. Our model addresses that topography, geomorphic (aeolian) processes, vegetation, and edaphic conditions are closely connected in a causal chain not only within a specific zone but also across the whole dune area. Recognizing topography as the fundamental factor among these, we suggest this model for an understanding how a complex dune soil system is created from simple topographic effects by showing the continuous spatial patterns of soil properties across a dunefield.
CONCLUSIONS
Figure 6. A conceptual model: The spatial pattern of ecological processes and environmental indicators in the Sindu coastal dunefield, South Korea.
it would be easier to understand the way each soil property behaves differently in response to specific topographic gradients (PARK and BURT, 2002). However, various grasses, shrubs, and trees have a zonal, as well as patch, distribution in the Sindu dunefield, thereby complicating the contribution of individual species to the spatial variation of soil properties. These species are ‘‘ecosystem engineers’’ in that they modulate the availability and quality of soil resources around them (JONES, LAWTON, and SCHACHAK, 1984; VAN BREEMEN and FINZI, 1998), thereby generating a plant-induced spatial heterogeneity of soil properties at the study site (PERE´Z, 1995; SCHLESINGER and PILMANIS, 1998). R. pseudoaccacia, for instance, made soils around it contain more nitrate and other nutrients in the second dune ridge, and it prevented soil moisture from evaporating with its canopy cover (compare Figures 2 and 3).
A Conceptual Model of Ecological Patterns and Processes in Coastal Dunes Based on our findings, we developed a conceptual model that simplifies the spatial pattern of complex ecological processes and environmental indicators of the coastal dune (Figure 6). The model starts from a reductionist spatial zonation (foredune, dune slack, and second dune) in which soil variables and ecological processes of each zone are functionally different and separated from one another (see MALANSON, 1999). This approach, however, does not imply that the key processes and environmental indicators of each zone operate exclusively or are confined to a single area. Although they may be dominant and representative at each subfield, they can also influence other parts of the dunefield. For instance, nutrient supply from marine sources may be the most relevant process in the foredune, but the input of nutrients can also affect the cross-shore gradient of soil properties for inner dunefields if the process occurs over the height of the fore-
This study provided quantitative insight and spatially explicit visualization of the topographic correlates of complex soil patterns using fine-scaled GIS-based terrain analysis and geostatistical techniques in a coastal dune setting. A useful aspect of the proposed conceptual model is that it integrates complex ecological pattern and process relationships occurring in different parts (i.e., foredune, dune slack, and inner dune) into a continuous surface. It is, however, hard to exclude the possibility that some part of the model may be applicable only to the study area and so is a site-specific example of soil–landscape relationships. The effect of stormdriven overwash, for example, is not observable at Sindu. Overwash can be an important biogeomorphic influence on soil and vegetative patterns along cross-shoreline gradients of low-profile, wave-dominated, and microtidal dune systems (HAYDEN et al., 1995; MARTI´NEZ, MORENO-CASASOLA, and VA´ZQUEZ, 1997; STALLINS and PARKER, 2003). In addition, our model does not take into account some soil properties, such as total P and exchangeable Na⫹, because no clear topographic and vegetative indicator of their spatial patterns could be defined. Nevertheless, we posit that our major findings and conceptual model may provide generalizable insights to other dune areas. One key result, that distance from the seashore and topographic relief are the main indicators of soil spatial variability, does not result from the uniqueness of our study dune but is a good accordance with previous studies at dunes other than Sindu (e.g., HAYDEN et al., 1995; HOLTON and JOHNSON, 1979). This consistent finding closely relates to the fact that coastal dunes, wherever they occur, continuously receive a large amount of salts from marine sources and that the uniform sandy substrate with macropores allows soil moisture to move rapidly from dune ridges toward the water table of slack surface. Considering this general ecological and hydrological nature of dunes, it is expected that the ecology of Sindu can shed light on the soil–topography relationship at other dunes with few disturbance agents, such as stormdriven overwash.
ACKNOWLEDGMENTS The authors would like to thank Dr. David Cairns, Dr. Douglas Sherman, Dr. Nancy Jackson, and Hosahng Rhew for their helpful comments on the earlier version of the manuscript. The paper also benefited from insightful comments of Dr. Anthony Stallins and other anonymous reviewers and editors during the review procedure for publication. D.K.
Journal of Coastal Research, Vol. 24, No. 4C (Supplement), 2008
Spatial Pattern of Dune Soil Properties
greatly appreciates the unending support of Sung Hwan Kim, Young Ho Shin, and Kyoung Hwa Kwon in the field.
LITERATURE CITED ANDERSON, M.G. and BURT, T.P., 1978. The role of topography in controlling throughflow generation. Earth Surface Processes, 3, 331–344. ARMSTRONG, W., 1975. Waterlogged soils. In: ETHERINGTON, J.R. (ed.), Environment and Plant Ecology. Chichester, United Kingdom: Wiley, pp. 181–218. AVIS, A.M. and LUBKE, R.A., 1996. Dynamics and succession of coastal dune vegetation in the Eastern Cape, South Africa. Landscape and Urban Planning, 34, 237–254. BEVEN, K. and GERMANN, P., 1982. Macropores and water flow in soils. Water Resources Research, 18, 1311–1325. BIRKELAND, P.W., 1999. Soils and Geomorphology, 3rd edition. New York: Oxford University Press, 430p. BORING, L.R. and SWANK, W.T., 1984. Symbiotic nitrogen fixation in regenerating black locust (Robinia pseudoaccacia L.) stands. Forest Science, 30, 528–537. BRADY, N.C. and WEIL, R.R., 2002. The Nature and Properties of Soils, 13th edition. Upper Saddle River, New Jersey: Prentice Hall, 960p. BURROUGH, P.A., 1993. Soil variability: a late 20th century view. Soils and Fertilizers, 56, 529–562. CARTER, R.W.G., 1988. Coastal Environments: An Introduction to the Physical, Ecological, and Cultural Systems of Coastlines. New York: Academic Press, 617p. CATTELL, R.B., 1978. The Scientific Use of Factor Analysis in Behavioral and Life Science. New York: Plenum Press, 618p. CLAYTON, J.L., 1972. Salt spray and mineral cycling in two California coastal ecosystems. Ecology, 53, 74–81. FAY, P.J. and JEFFREY, D.W., 1992. The foreshore as a nitrogen source for marram grass. In: CARTER, R.W.G.; CURTIS, T.G.F., and SHEEHY-SKEFFINGTON, M.J. (eds.), Coastal Dunes: Geomorphology, Ecology, and Management for Conservation. Proceedings of the 3rd European Dune Congress (Galway, Ireland), 17–21 June 1992. Rotterdam: A.A. Balkema, pp. 177–188. DIGEM, 2002. DiGeM 2.0. http:downloads.sourceforge.net/saga-gis/ digem_2.0_bin.zip (accessed January 1, 2006). ENVIRONMENTAL SYSTEMS RESEARCH INSTITUTE, 2000. ESRI GIS and Mapping Software. http://www.esri.com (accessed January 1, 2006). FINNEY, H.R.; HOLOWAYCHUK, N., and HEDDLESON, M.R., 1962. The influence of microclimate on the morphology of certain soils of the Allegheny Plateau of Ohio. Soil Science Society of America Proceedings, 26, 287–292. FREEMAN, G.T., 1991. Calculating catchment area with divergent flow based on regular grid. Computers and Geosciences, 17, 413– 422. GERRARD, J., 1992. Soil Geomorphology: An Integration of Pedology and Geomorphology. New York: Chapman & Hall, 269p. GESSLER, P.E.; MOORE, I.D.; MCKENZIE, N.J., and RYAN, R.J., 1995. Soil–landscape modeling and spatial prediction of soil attributes. International Journal of Geographical Information Systems, 9, 421–432. GOLDEN SOFTWARE INC., 1999. Surfer威 7: User’s Guide. Golden, Colorado: Golden Software. GROOTJANS, A.P.; ERNST, W.H.O., and STUYFZAND, P.J., 1998. European dune slacks: strong interactions of biology, pedogenesis, and hydrology. Trends in Ecology & Evolution, 13, 96–100. HAYDEN, B.P.; SANTOS, M.C.F.V.; SHAO, G., and KOCHEL, R.C., 1995. Geomorphological controls on coastal vegetation at the Virginia Coast Reserve. Geomorphology, 13, 283–300. HESP, P.A., 1991. Ecological processes and plant adaptations on coastal dunes. Journal of Arid Environments, 21, 165–191. HOLTON, B., JR., and JOHNSON, A.F., 1979. Dune scrub communities and their correlation with environmental factors at Point Reyes National Seashore, California. Journal of Biogeography, 6, 317– 328.
59
HOPKINS, W.G. and HU¨NER, N.P.A., 2004. Introduction to Plant Physiology, 3rd edition. Hoboken, New Jersey: John Wiley & Sons, 560p. HUGGETT, R.J., 1975. Soil landscape systems: a model of soil genesis. Geoderma, 13, 1–22. HUGGETT, R.J. and CHEESMAN, J., 2002. Topography and the Environment. New York: Prentice Hall, 274p. JENNY, H., 1941. Factors of Soil Formation: A System of Quantitative Pedology. New York: McGraw-Hill, 281p. JONES, C.G.; LAWTON, J.H., and SCHACHAK, M., 1984. Organisms as ecosystem engineers. Oikos, 69, 373–386. KALUZNY, S.P.; VEGA, S.C.; CARDOSO, T.P., and SHELLY, A., 1998. S⫹ SpatialStats: User’s Manual for Windows and UNIX. New York: Springer, 327p. KELLMAN, M. and ROULET, N., 1990. Nutrient flux and retention in a tropical sand dune succession. Journal of Ecology, 78, 664–676. KIM, D., 2004. Spatial distribution of nutrients from sea water and aeolian sands in a coastal dunefield, South Korea. Journal of Korean Geography, 43, 57–79. LOTSPEICH, F.B. and SMITH, H.W., 1953. Soils of the Palouse loess: I. The Palouse catena. Soil Science, 76, 467–480. MALANSON, G.P., 1999. Considering complexity. Annals of the Association of American Geographers, 89, 746–753. MARTI´NEZ, M.L.; MORENO-CASASOLA, P., and VA´ZQUEZ, G., 1997. Effects of disturbance by sand movement and inundation by water on tropical dune vegetation dynamics. Canadian Journal of Botany, 75, 2005–2014. MAYNARD, D.G. and KALRA, Y.P., 1993. Nitrate and exchangeable ammonium nitrogen. In: CARTER, M.R. (ed.), Soil Sampling and Methods of Analysis. Boca Raton: Lewis Publishers, pp. 25–26. MCBRATNEY, A.B.; ODEH, I.O.A.; BISHOP, T.F.A.; DUNBAR, M.S., and SHATAR, T.M., 2000. An overview of pedometric techniques for use in soil survey. Geoderma, 97, 293–327. MOORE, I.D.; GRAYSON, R.B., and LADSON, A.R., 1991. Digital terrain modeling: a review of hydrological, geomorpological, and biological applications. Hydrological Processes, 5, 3–30. MOORE, I.D.; GESSLER, P.E.; NIELSON, G.A., and PETERSON, G.A., 1993. Soil attribute prediction using terrain analysis. Soil Science Society of America Journal, 57, 443–452. MORENO-CASASOLA, P., 1988. Patterns of plant species distribution on coastal dunes along the Gulf of Mexico. Journal of Biogeography, 15, 787–806. NORUSIS, M.J. and SPSS INC., 1993. SPSS: SPSS for Windows Base System User’s Guide. Chicago: SPSS, 828p. ODEH, I.O.A.; CHITTLEBOROUGH, D.J., and MCBRATNEY, A.B., 1991. Elucidation of soil–landform interrelationships by canonical ordination analysis. Geoderma, 49, 1–32. OOSTING, H.J. and BILLINGS, W.D., 1942. Factors effecting vegetational zonation on coastal dunes. Ecology, 23, 131–142. PARK, S.J. and BURT, T.P., 2002. Identification and characterization of pedogeomorphological processes on a hillslope. Soil Science Society of America Journal, 66, 1897–1910. PARKER, K.C. and BENDIX, J., 1996. Landscape-scale geomorphic influences on vegetation patterns in four environments. Physical Geography, 17, 113–141. PERE´Z, F.L., 1995. Plant-induced spatial patterns of surface soil properties near caulescent Andean rosettes. Geoderma, 68, 101– 121. RANWELL, D.S., 1972. Ecology of Salt Marshes and Sand Dunes. London: Chapman & Hall, 285p. RHODES, J.D., 1982. Soluble salts. In: PAGE, A.L. (ed.), Methods of Soil Analysis: Part 2. Chemical and Microbiological Properties, Agronomy No. 9, 2nd edition. Madison, Wisconsin: American Society of Agronomy, pp. 167–179. SALISBURY, E.J., 1925. Note on the edaphic succession in some dune soils with special reference to the time factor. Journal of Ecology, 13, 322–328. SALISBURY, E.J., 1952. Downs and Dunes: Their Plant Life and its Environment. London: Bell, 328p. SCHAT, H.; BOS, A.H., and SCHOLTEN, M., 1984. The mineral nutrition of some therophytes from oligotrophic dune slack soils. Acta Oecologia/Oecologia Plantarum, 5, 119–131.
Journal of Coastal Research, Vol. 24, No. 4C (Supplement), 2008
60
Kim, Yu, and Park
SCHLESINGER, W.H. and PILMANIS, A.M., 1998. Plant–soil interactions in deserts. Biogeochemistry, 42, 169–187. SIMARD, R.R., 1993. Ammonium acetate–extractable elements. In: CARTER, M.R. (ed.), Soil Sampling and Methods of Analysis. Boca Raton: Lewis Publishers, pp. 39–42. SOKAL, R.R. and ROHLF, F.J., 1995. Biometry: The Principles and Practice of Statistics in Biological Research, 3rd edition. New York: W.H. Freeman & Co., 887p. SONDHEIM, M.W.; SINGLTON, G.A., and LAVKULICH, L.M., 1981. Numerical analysis of a chronosequence, including the development of a chronofunction. Soil Science Society of America Journal, 45, 558–563. STALLINS, J.A., 2001. Soil and vegetation patterns in barrier-island dune environments. Physical Geography, 22, 79–98. STALLINS, J.A. and PARKER, A.J., 2003. The influence of complex systems interactions on barrier island dune vegetation pattern and process. Annals of the Association of American Geographers, 93, 13–29. SWANSON, F.J.; KRATZ, T.K.; CAINE, N., and WOODMANSEE, R.G., 1988. Landform effects on ecosystem patterns and processes. Bioscience, 38, 92–98. TER BRAAK, C.J.F., 1995. Ordination. In: JONGMAN, R.H.G.; TER BRAAK, C.J.F., and VAN TONGEREN, O.F.R. (eds.), Data Analysis in Community and Landscape Ecology. New York: Cambridge University Press, pp. 91–173. THOMPSON, J.A.; BELL, J.C., and BUTLER, C.A., 2001. Digital elevation model resolution: effects on terrain attribute calculation and quantitative soil–landscape modeling. Geoderma, 100, 67–89.
TOPP, G.C., 1993. Soil water content. In: CARTER, M.R. (ed.), Soil Sampling and Methods of Analysis. Boca Raton: Lewis Publishers, pp. 541–544. TSUI, C.C.; CHEN, Z.S., and HSIEH, C.F., 2004. Relationships between soil properties and slope position in a lowland rain forest of southern Taiwan. Geoderma, 123, 131–142. VAN BREEMEN, N. and FINZI, A.C., 1998. Plant–soil interactions: ecological aspects and evolutionary implications. Biogeochemistry, 42, 1–19. VAN DER VALK, A.G., 1974. Mineral cycling in coastal foredune plant communities in Cape Hatteras National Seashore. Ecology, 55, 1349–1358. WEBSTER, R. and OLIVER, M.A., 1990. Statistical Methods in Soil and Landscape Resource Survey. New York: Oxford University Press, 316p. WHITTAKER, R.H., 1967. Gradient analysis of vegetation. Biological Reviews, 49, 207–264. WILSON, J.P. and GALLANT, J.C., 2000. Digital terrain analysis. In: WILSON, J.P., and GALLANT, J.C. (eds.), Terrain Analysis: Principles and Application. New York: John Wiley & Sons, pp. 1–27. YU, K.B.; RHEW, H.S., and KIM, S.H., 2004. Aeolian sand as a nutrient carrier into the coastal dunefield. In: Proceedings of the 30th Congress of the International Geographical Union (Glasgow, United Kingdom), abstract in the CD-ROM. ZEVENBERGEN, L.W. and THORNE, C.R., 1987. Quantitative analysis of land surface topography. Earth Surface Processes and Landforms, 12, 47–56. ZHU, A.X., 1997. A similarity model for representing soil spatial information. Geoderma, 77, 217–242.
Journal of Coastal Research, Vol. 24, No. 4C (Supplement), 2008