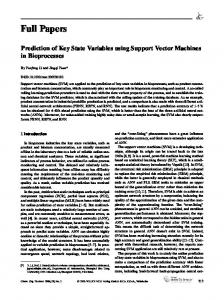
Identification of Key Variables Using Fuzzy Average With ... - CiteSeerX
Recommend Documents
(ecl). â 1 θv â1 . (16). In the same way, we can derive the optimal Fc and uci. ...... respectively, and gave a tutorial on âIntroduction to Clustering Techniquesâ.
ground theory, the assumptions and the models which allow us to process E in order to draw the ...... On the Rao-. Blackwell theorem for fuzzy random variables.
methods for input variable selection require generating different models while ... for model selection, there is no guarantee that a model based on a given set of.
Nov 18, 2015 - The factor analysis revealed four distinct gait domains, and the key variables ... supplementary material, which is available to authorized users.
Summary - The notion of Fuzzy Random Variable has been introduced to model random mechanisms generating imprecisely-valued data which can be properly ...
TTP1.How many months did it take you to become effective at your new job following your last expatriation? ⦠â¦...months and â¦.. weeks. TTP2.How quickly do ...
Application of the Fuzzy Weighted Average of Fuzzy Numbers in Decision Making Models. Ondrej Pavlacka. Department of Mathematical Analysis and. Applied ...
Support vector machines (SVM) are applied to the prediction of key state variables in ... rolling learning-prediction procedure is used to deal with the time variant ...
values of the identified DEGs were input into the VennPlex software (version 1.0.02; irp.nia.nih.gov/bioinformatics/vennâ plex.html) (22) to compare the DEGs in ...
TABLE. Page. 3.1 Performance of the Fuzzy Expert System Measured ... 5.1 Comparison of Fitness Evolution for Population Sizes of 30 and 50 â¦â¦. 35 .... Following is a brief review of the two approaches and the applications of GAs in .... technique
fuzzy variables are functions from possibility spaces to the set of random ... variables, some inequalities for random fuzzy variables are first proved based on the ...
Pos{~i ⢠B~, i = 1,2 ..... m} = rain Pos{6 ⢠B~}, l
1These algorithms are often referred to in the T2 fuzzy logic system (FLS) literature as the âKM ... 2This includes the special case when the fuzzy sets are interval sets. too restrictive ...... is author and/or editor of eight books, including. Un
Feilong Liu, Student Member, IEEE, and Jerry M. Mendel, Life Fellow, IEEE. AbstractâBy connecting work from two different problemsâ the fuzzy weighted ...
Page 1 ... Keywords- fuzzy clustering; particle swarm optimization. I. INTRODUCTION. Clustering is ... based optimization tool, which could be implemented and.
160. Allahviranloo, et al. Let. )10(. )8( β β. P. P. â then. )8(. ),();,( β. PYXYX. â. â and. )10(. ),( β. PYX. â . Hence, one of the three cases has occurred: 1. 1. 1. 1.
DAVID CAMACHO, CÃSAR HERNÃNDEZ, JOSÃ M. MOLINA. Computer Science Department ..... Brenner W., Zarnekow R., Wittig H.. Intelligent Software Agents.
likely to hire a preparer to provide a legally compliant return and to gain ... Tax Identification Number (PTIN) beginning in 2011 to further monitor these services.
timeâindependent, i.e., does not depend on t and is meant to compute the average asymptotically. One major shortcoming of the majority of the algorithms.
Sep 23, 2010 - Abstract. We derive nonparametric bounds for local average treatment effects without requiring the exclusion restriction assumption to hold or ...
S. M. M. Tahaghoghi. Hugh E. Williams ... tion boundaries. Our technique is a valuable new tool ... effects will increase as powerful video editing tools en-.
State variable that measures actual viewers loyalty. One of the measures of brand value defined by Aaker [1]. 14 Actual viewers. 6.47. Measures the success of ...
marketing campaigns, or the effects of implementing innovation policies in organi- ... the global impact of injecting strategic actions just over top-ranked key ...
Key words: System dynamics, social network analysis, centrality metrics, simula- ... marketing campaigns, or the effects of implementing innovation policies in organi- ... the global impact of injecting strategic actions just over top-ranked key ...
Identification of Key Variables Using Fuzzy Average With ... - CiteSeerX
puter Engineering, University of Louisville, Louisville, KY 40292 USA (e-mail: ... W. Karwowski is with the Department of Industrial Engineering, University.
IEEE TRANSACTIONS ON FUZZY SYSTEMS, VOL. 15, NO. 4, AUGUST 2007
673
Identification of Key Variables Using Fuzzy Average With Fuzzy Cluster Distribution Yanfeng Hou, Student Member, IEEE, Jacek M. Zurada, Fellow, IEEE, Waldemar Karwowski, William S. Marras, and Kermit Davis Abstract—Identification of the significance of input variables is very important for complex systems with high-dimensional input space. In this paper, a method using fuzzy average with fuzzy cluster distribution is proposed. To avoid the interference of different distributions of the sampling data, the distribution of fuzzy clusters in the sampling data is considered, instead of the original data set. To discover the input–output relationship, the methods of fuzzy rules and fuzzy C-means are first used to partition the original sampling data set into fuzzy clusters. A new data set with the same distribution of the fuzzy clusters is produced. The fuzzy average method is then applied to the new data set. By doing so, the interference of distribution of the original sampling data is removed. This method is straightforward and computationally easy. The performance is tested on both benchmark data and real-world data. Index Terms—Fuzzy cluster, variable identification.
I. INTRODUCTION
denotes the th measurement of input variable . The output data vectors are of the following form:
where
(2) measurement of the where denotes the th output variable . From the above sampling data of input–output pairs, the relationship between each input variable and the output variable relationship, ) should be found. (the relationship resides in that The difficulty of finding the the change of is caused by the joint influence of all the input variables, instead of only the influence of . B. Related Work
I
N modeling of complex systems whose input–output relationship is not well understood, it is very helpful to find out the significance of each variable to the output of the system. If inputs that have little or no influence on the output can be removed and emphasis is put on the important variables, a more parsimonious and more effective model can be built. Moreover, a better understanding to those systems can be achieved if how individual inputs affect the EMG/forces is discovered. A. Problem Statement
The problem being investigated can be stated as follows. For a system with one output variable and associated input variables, sampling data points are obtained. Each data point represents a joint measurement of all variables involved. The input data vectors are of such form
(1)
Manuscript received February 21, 2005; revised February 18, 2006 and May 2, 2006. This work was supported by the National Institute for Occupational Safety and Health under a research grant on the “Development of a Neuro-Fuzzy System to Predict Spinal Loading as a Function of Multiple Dimensions of Risk.” Y. Hou and J. M. Zurada are with the Department of Electrical and Computer Engineering, University of Louisville, Louisville, KY 40292 USA (e-mail: [email protected]; [email protected]). W. Karwowski is with the Department of Industrial Engineering, University of Louisville, Louisville, KY 40292 USA (e-mail: [email protected]). W. S. Marras is with the Institute for Ergonomics, The Ohio State University, Columbus, OH, 43210 USA (e-mail: [email protected]). K. Davis is with the Department of Environmental Health, University of Cincinnati, Cincinnati, OH, 45267 USA (e-mail: [email protected]). Digital Object Identifier 10.1109/TFUZZ.2006.889897
This problem has a broad applicability and some methods have been proposed. In [1], Bartlett used a neural network method. During training, the algorithm automatically constructs an appropriate neural network architecture. The importance of each input variable is provided as a by-product. This method cannot determine in what way each input variable affects the outputs. Also, different neural networks need to be developed, which is time consuming. Yuan and Klir used the full class of Mahalanobis distances to search by an evolutionary algorithm for the optimal distance—one under which the fuzzy c-means algorithm produces a fuzzy partition of the given data set that is as close as possible to the given crisp partition [2]. The contribution of each variable to this partition is then inferred from parameter values of the optimal Mahalanobis distance. This method employs evolutionary computation and is computationally intensive. The result obtained is not straightforward. Also, it brings no information on how input variables affect the outputs. Sugeno and Takahiro proposed an iterative algorithm for the input identification [3]. Different models are generated to search for the optimal combination of variables. The total number of combinations is 2 1, where is the number of input variables. For a high-dimensional system with many input variables, the number of models needed will be very large. Chiu used a backward selection procedure that starts with all possible variables and reduces one variable at each stage [4]. Premises in the fuzzy rules of an initial model are systematically removed to search for the best simplified model. However, after the iteration process of searching, different results may be obtained when three different criteria for model selection are used. Then a Takagi–Sugeno type model needs to be generated for each solution. The final conclusion is made based on the
IEEE TRANSACTIONS ON FUZZY SYSTEMS, VOL. 15, NO. 4, AUGUST 2007
comparison of the model errors, which makes the method complicated and time consuming. In [5] and [6], Lin et al. proposed their “fuzzy curves” data points are plotted method. For each input variable space. A fuzzy rule is defined according to each in the sampling data point in the following form: IF
is
THEN
is
where is a Gaussian membership function of . A “fuzzy curve” can be produced using the defuzzification relationship. The signifimethod, which stands for the cance of the input variables is ranked according to the ranges covered by the fuzzy curves. This method is easy to understand and to calculate. The result obtained is straightforward. Lin et al. used this method in fuzzy-neural system modeling to determine model structure and set the initial weights in the model [5]. This method was also used in many other papers such as [6]–[13]. In [6], the method is used to eliminate spurious inputs and dependent inputs. In [7], this method was used to set the initial parameters of the neurofuzzy model. In [8], it was used to rank the input variables and determine the optimal rules describing the behavior of the system. In [9], it was used to generate fuzzy models for short-term load forecasting. When trying to apply this method to the electromyographic (EMG) signal estimation system for manual lifting tasks, it is found that it did not always work well. The distribution of the sampling data set will affect the result. In other words, significance of the input variables obtained from this method may vary from sampling to sampling. Obviously, this should not happen because influence of each input variable is an inherent property of a system, regardless of the distribution of the sampling data. In Section II, limitation of the fuzzy curve method is pointed out and is improved with fuzzy average with fuzzy cluster distribution (FAFCD). In Section III, the proposed method is tested on benchmark data and the EMG estimation system. II. METHODS As mentioned in the prior section, in the method of fuzzy curves, a fuzzy rule is defined according to each sampling data . From data points, fuzzy rules can be obpoint tained. The fuzzy membership functions for input variable are Gaussian membership functions centered at
0
0
Fig. 1. (A) The x y relationship from defuzzification. (B) The x y relationship from defuzzification. (C) The distribution of inputs x and x .
where and are two input variables and is the output variable. and space Here the defuzzified curves of in are plotted in Fig. 1(A) and (B), respectively. The sample data were generated using formula (5) with and uniformly distributed in the interval [0,3] in Fig. 1(C). in the figure is the ratio of the range of covered by the curve to the whole range of . It is used to represent significance of the corresponding input variable instead of using the ranges covered by the fuzzy curves as in [5]. It can be seen that the curves can correctly reflect the relationship and relationship. However, can this still work if the distribution of the sample data changes? Fig. 2(A) gives us relationship when the data were a different result of the and shown in Fig. 2(B). It seems that if generated with the sampling data are not uniformly distributed, the curves will be distorted. This example shows that the fuzzy curve method puts restrictions on the distribution of sampling data. Below the reason will be pointed out and a new approach will be derived. A. The Method Depends on Distribution of Sampling Data
(3) where and are center and width of the membership function, respectively. Then the fuzzy curve is produced from defuzzification
As stated before, the importance of the input variables is ranked according to the ratio of the range of covered by the curve produced from defuzzification to the whole range of . Let us define the ratio as influence rate ; then for input variable (6)
(4) The authors of [5] demonstrated and validated this method using a nonlinear system defined as (5)
where is the highest point on the curve and is the lowest point on the curve. is the whole range of . and are calculated from (4). The membership to all the membership functions is calof each value of
HOU et al.: IDENTIFICATION OF KEY VARIABLES USING FUZZY AVERAGE WITH FUZZY CLUSTER DISTRIBUTION
culated for (4). In (3), the width of the Gaussian membership function is often taken as about 20% of the length of the input interval of . If the width is very small, only those membership functions with a center (mean of the Gaussian function) close to current value of will have a significant value, while the membership functions far from it will have a value close to zero. When (7)
675
Let us define the system function as (11) where is the system function and is the output vector. From (10), the average value of at in the space is (12) where , assuming data points at . For space is coneasier notation, fuzzy average of in the to represent , the fuzzy sidered. Using average of in the space becomes
Substituting (3) and (4) into (7) yields
(13)
(8)
when , only those membership functions with their centers equal to and need to be taken into account. The memand to the other membership functions are berships of zero. Suppose there are membership functions with a center and membership functions with a center equal to equal to ; then (8) becomes (9) where are the values of when ; and are the values of when . Equation (9) indicates that the range of the curve (when ) is the difference between the average value of at and the average value of at . at takes If is not approaching zero, the value of . But it is still a into account those data points around weighted average. Since it has a meaning of average carried in a fuzzy sense, we call it fuzzy average. After expressing the value as a weighted average of the defuzzified curve for at into account, the next thing that takes the points around needed is to find out what determines the value of this average. is considered. In For simplicity, the condition when is the this condition, the value of the fuzzy average at arithmetical average of at (10) is the fuzzy average value of at in the space. The value of depends on the values of at (the values of ). The values of are decided by both the system function and the values of the input variables.
where is the number of data points at each value of (they are not the same for different values of ). From (13), it can be seen that only when vectors are the same for all is determined only relationship. by , so that function (13) can reflect the is determined by all the input variables, and Otherwise and . therefore cannot reflect the relationship between Fig. 1 is the two-dimensional example with two input variand , in which has the same values at each value ables [Fig. 1 (C)]. The fuzzy average of in the space of relationship correctly. While in Fig. 2, reflects the does not have the same values at each value of . Therefore, relathe fuzzy average of cannot correctly reflect the tionship. relationship Thus it can be stated that to find out the using fuzzy average method, each of the input variables should have the same values along the axis of , respectively. For the real-world data, this requirement is normally hard to meet. However, if many sampling data points spread all the range of , the fuzzy average of in space can reflect the relationship as long as has roughly the same distribution at any value of . Fig. 3 shows the result of this condition. In Fig. 3(B), was generated randomly using Matlab command “rand” with uniform distribution. The fuzzy average method works in this situation [Fig. 3(A)]. For many practical applications, it cannot be assumed that all axis. This input variables have the same distribution along means for a certain system, if different sampling data sets are used, the fuzzy average may be different. Then the conclusion for the importance of input variables may be different. Therefore, a more representative data set is needed to determine the influence of input variables. B. Change the Distribution of Sampling Data Using Fuzzy Clustering Using fuzzy average method, the significance of variable can be correctly evaluated without the interference of other input variables only when all other input variables have the same distribution along axis. To transform the sampling data set into this form, fuzzy clustering is used to change the distribution of
676
Fig. 2. (A) The x tribution of inputs.
IEEE TRANSACTIONS ON FUZZY SYSTEMS, VOL. 15, NO. 4, AUGUST 2007
0 y relationship from defuzzification. (B) The altered disFig. 4. Clusters generated using FCM. “X” is the original data point; “O” is the fuzzy cluster center.
Fig. 3. (A) The x tribution of inputs.
0 y relationship from defuzzification. (B) The random dis-
the data set. Again the example of the system with two input variables and shown in Fig. 1 is used. Suppose more data points fall into a small region than into space [as in Fig. 2(B)]. Fuzzy other regions in the clustering methods are considered to divide the data points into groups. The number of data points in each group (fuzzy cluster) will be different since the distribution of the data is uneven. If one data point (for instance, the fuzzy cluster center) is used to represent each group, a new data set with the distribution of fuzzy clusters can be obtained. Since a different number of sampling data in small regions will be replaced by the same number of cluster center, a new data set with better distribution may be obtained. Below, the fuzzy C-means method is used to cluster the data. Then, after discussing the drawback in this application, an improved method is proposed. 1) Fuzzy C-Means Method: Each of the data points represents a point in the -dimensional Euclidean space ( is the input dimension). The purpose of clustering is to partition the data set into clusters in such a way that data points in each cluster are highly similar to each other, while data points assigned to different clusters have low degrees of similarity. Fuzzy C-means (FCM) allows one data point to belong to two or more clusters [14], [17]. It provides a method that groups data points in multidimensional space into a specific number of clusters. It is based on minimization of the following objective function: (14)
where is the number of clusters, is the degree of membership of in the cluster is the th of -dimensional measured data, is the -dimensional center of the cluster, and is a norm expressing the distance between measured data and cluster center. FCM is used to cluster the data shown in Fig. 2(B). The number of clusters is predefined as 50. Then the produced 50 centers of the clusters are used to form a new data set. After this process, the distribution of the obtained new data set is shown in Fig. 4. The crosses are the original data points and the circles are the centers of the clusters. Apparently, the distribution of the data did not change. Why can FCM clustering not change the distribution? It is known that during the iteration process of FCM, the membership is updated though (15) and the cluster centers are updated though (16) The membership and the cluster centers are updated to minimize the total weighted distance between data points and the cluster centers of the fuzzy partition. Thus it is reasonable that in areas where more data points exist, there must be more cluster centers in order to make the total weighted distance between all data points and the cluster centers smaller. Therefore the data distribution cannot be changed only using FCM. 2) Generate Even Cluster Distribution: To generate better cluster distribution, the input space is partitioned using fuzzy rules before applying FCM. A fuzzy rule base is built for the nonlinear system. Those data points that can excite a particular fuzzy rule with high firing strength are grouped to the same partition. The fuzzy rule base is in the following form. and is and and is THEN IF is is . and is and and is THEN IF is is .
HOU et al.: IDENTIFICATION OF KEY VARIABLES USING FUZZY AVERAGE WITH FUZZY CLUSTER DISTRIBUTION
IF is and is and and is THEN is where and are fuzzy sets of and , respectively. The fuzzy partitions generated by the fuzzy rules are shown of Gaussian membership function is in Fig. 5. If the width the same for all the fuzzy sets, the partition is an even partition. The method is implemented as follows: the first sampling data point is taken as the center of a cluster, and a corresponding fuzzy rule is built. The parameters are chosen as follows: (17) (18) where is the range of the input variables (normalized to the same range). For every sampling data point, the firing strength (degree of fulfillment) of each existing rule is calculated (19) AND operation is used in (19). If the firing strength (20) then the sampling data point is close to the data points in the partition. Thus it belongs to this partition. is a predefined threshold as the least acceptable degree, and it determines the extent of the similarity to be classified into the partition. If the firing strength is less than the threshold , then a new fuzzy rule (a new partition) should be created. After all the data are partitioned, FCM algorithm is used to cluster data points in each small partition. The same number of clusters is set for each small partition. Or, if the partition is small enough, only one cluster is set for each partition, and its center is found by FCM. It would be nice to use the centers of the clusters to represent the clusters. But for real-world systems, the corresponding output of the system to the centers are not available, if the centers are not coincident to the existing data points. So the closest sampling data point to the center of a cluster is used to represent the cluster. The closest data point is decided by its Euclidean distance to the center (21)
Fig. 6. Procedure of FAFCD.
There is a loss of information during this process, but the number of partitions can be controlled to make sure only redundant data points are removed while keeping enough data points to represent all the sampling data in the input space. This is done , then each sampling data point is a by adjusting . If , only one partition obtained. partition; if When only one cluster is set for each partition, the number of clusters is the same as the number of partitions. So if is too small, the distribution may not change and the number of clusters will be large; if is too large, some clusters may be combined into other clusters and their representation is lost when only the cluster center is kept. is taken as 1/30 of the range of the normalized input variables. This can partition the input space into many small partitions, which can represent the input space adequately, and at the same time the redundant sampling data points in each partition are removed. The procedure of FAFCD is shown in Fig. 6. Distribution of the data in Fig. 2(B) becomes better after being processed by the above method [see Fig. 7(B)]. Hence the space can reflect the relationfuzzy average of in ship correctly now [Fig. 7(A)]. These results are very similar to those generated in Fig. 1, which is a uniform distribution. C. Other Considerations Some considerations and improvements should be implemented. 1) Data Normalization: Before applying FAFCD, the data set should be preprocessed. Since different variables are measured in different units and with different numerical ranges, a bias may be introduced to the process. Thus the data need to be normalized (22)
is the value after normalization; is the data to be where is the minimum value of vector ; and normalized; is the maximum value of vector .
678
IEEE TRANSACTIONS ON FUZZY SYSTEMS, VOL. 15, NO. 4, AUGUST 2007
Fig. 7. Results using FAFCD. (A) The x (B) The distribution of inputs.
0y relationship from defuzzification.
2) Calculate Less Membership Functions: When using the fuzzy average method, all existing membership functions for each value of in (4) are calculated. If the center of a is far away from the current value membership function is big, the value of the membership of , which means function becomes very small and has not much influence on the , the value fuzzy average value. For instance, when of the membership function is very small
(23) Therefore only the membership functions whose centers are in the range of 3 need to be calculated. The values of the other membership functions are very small and can be neglected. This can reduce the number of membership functions to be calculated. For the example used in the simulation section, there are 29 880 data points, which means for each value of , 29 880 membership functions need to be calculated. If only the membership functions whose centers are in the range of 3 are calculated, this number can be reduced to 1/10 of the total number of membership functions. So the fuzzy average can be obtained much faster with almost no quality decrease. 3) Remove Outliers: During our clustering process, outliers often become individual clusters. When the cluster center is used to form a new data set, the outliers are kept. If the sampling data set has a large number of data points, those clusters containing very few data points (predefine a threshold) can be removed. Outliers normally can be removed by doing so. The threshold should be determined according to the total number of data points. III. SIMULATIONS AND RESULTS The performance of FAFCD is evaluated using two example data sets. In the first experiment, the algorithm is evaluated using the well-known example of gas furnace data set given by Box and Jenkins. In the second experiment, it is evaluated using the automobile fuel consumption prediction problem. Finally the method is applied to the EMG signal estimation system. A. Evaluate FAFCD on the Gas Furnace Data Set The method is applied to the well-known Box and Jenkins gas furnace data from [15]. This data set was also used in [3],
[4], and [16] to identify the key variables. This time series data as input and CO concentration set has the gas flow rate as output. There are 296 such input–output data pairs. As in [3] and [4], a dynamic process model is extracted from the data by taking ten variables as input and as output. Using to denote the ten-variable input vector, 290 data pairs obtained. FAFCD is applied to this data set to find significance of input variables. Fig. 8 shows the relationship between some input variables and the output. The inputs are normalized to (0,1). Table I shows the influence rate (defined earlier) of all the input variables. According to Table I, the top three input variables are deter, and . This result is similar mined as to [3]. In [3], different models were generated while searching for the optimal combination of variables. There were 24 models generated before the top three input variables were identified. If the importance of all the ten input variables needs to be ranked, the number of models needed will be even larger. The method used in [4] is also complicated and time consuming. To determine the important variables, premises in the fuzzy rules of an initial model are systematically removed to search for the best simplified model. After the searching process, different importance of top three input variables was obtained using three different criteria for model selection. Then for each solution, a Takagi–Sugeno type model was generated. The final conclusion was made based on the comparison of the model errors. Compared to these methods, the FAFCD approach is more straightforward and computationally efficient. B. Evaluate FAFCD on Automobile Fuel Consumption Prediction Problem The automobile fuel consumption prediction problem uses variables such as model year and horsepower to predict miles per gallon (MPG) of the automobiles. FAFCD is used to find the significance of those input variables to the MPG of the automobile. The data set used here is from the UCI Machine Learning Repository. It consists of 392 complete instances without missing values. Each instance is composed of six input variables (number of cylinders, displacement, horsepower, weight, acceleration, and model year) and one output variable (MPG). The input variables and output variable are denoted as and , respectively. Using FAFCD, the relationship can be obtained for each input variable. Fig. 9 shows and MPG. the relationship between two input variables From the result, it can be found how each input variable affects the output. The influence rate of each input variable is obtained using FAFCD. Table II shows the results for the six input variables. From the influence rate of each input variable, the conclusion is obtained that the variables weight and horsepower have the most significant influence on the MPG of an automobile. If the distribution/density of the original data set is changed by repeating some of the data points (Table III), the influence rate of acceleration obtained without clustering (the method used in [5]) becomes 0.6076 [Fig. 10(A)], while the influence
HOU et al.: IDENTIFICATION OF KEY VARIABLES USING FUZZY AVERAGE WITH FUZZY CLUSTER DISTRIBUTION
Fig. 8. Relationship between some input variables and the output obtained using FAFCD. x ; x respectively. (A) y (t 1) y (t) relationship. (B) y (t 4) y (t) relationship. (C) u(t 1)
0 0
0 0
TABLE I INFLUENCE RATE OF INPUT VARIABLES FOR GAS FURNACE DATA
rates of other variables remain almost unchanged. Then the conclusion becomes that acceleration is the most important variable, which is incorrect. If the FAFCD method is used, it can give an influence rate of acceleration of 0.5612 [Fig. 10(B)]. Thus the conclusion of significance of variables will not be affected. That is because in FAFCD, the distribution of fuzzy clusters is used instead of using the distribution of the original data set. C. Evaluate FAFCD on EMG Signal Estimation System EMG signal estimation system is a model in which kinematic parameters during a motion (kinematics variables) and anthropometric characteristics of subjects (subject variables) are used to estimate the corresponding EMG signals in ten trunk muscles generated during the manual lifting motion of the subjects. In this system, which variables affect the EMG
;x
0 0
679
0
0 4) ( 0 1) and 0 0 ( ) relationship.
, and x stand for y (t 1); y (t relationship. (D) u(t 4)
y (t)
;u t
y t
;
u (t
0 4),
signals is unknown because the muscle activities are not completely understood and are still under study. Our objective is to find out those variables that have significant influence on EMG signals. 1) Input Variables: Not knowing which variables affect the EMG signals, all the associated kinematic variables and subject variables are recorded. Tables IV and V show all the kinematic variables and subject variables, respectively. The 12 kinematic variables are dynamic variables which change their values during the motion. The 15 subject variables are static variables which are the anthropometric characteristics of the subjects, and they are the same during a motion for a particular subject. The sampling data set contains six trials of motions conducted by 249 subjects. Each trial has 20 sampling data points. Every subject conducted all the trials. Therefore the total number of data is points (24) where is the number of subjects and is the number of trials. Each data point consist of 27 input and ten output variables variables . The output variables are EMG signals of ten trunk muscles. relationships and identify 2) Results: To calculate the key variables of the system, the distribution of the original data set without clustering is first used. The results obtained are not satisfactory. For some of the input–output relationships, there is a drop in the middle of the range of variable . An example is shown in Fig. 11(A). This relationship is surely incorrect for
680
IEEE TRANSACTIONS ON FUZZY SYSTEMS, VOL. 15, NO. 4, AUGUST 2007
Fig. 9. Relationship between two input variables and the output obtained using FAFCD. (A) Weight (x )-MPG (y ) relationship. (B) Acceleration (x )-MPG (y ) relationship.
Fig. 10. Results on the modified MPG data using different methods. (A) Without clustering (method used in [5]). (B) Using FAFCD.
TABLE II INFLUENCE RATE OF INPUT VARIABLES FOR THE FUEL CONSUMPTION
TABLE III DATA POINTS REPEATED TWICE
some variables and is uninterpretable from the ergonomics point of view. Sometimes when different portions of the data set were
TABLE IV KINEMATIC VARIABLES (DYNAMIC)
TABLE V SUBJECT VARIABLES (STATIC)
used, different relationships were obtained. Therefore the distribution of the sampling data affected the result. Certain conditions may have appeared more frequently during the motion than other conditions and thus have distorted the fuzzy average curve. Then FAFCD is used to obtain the input–output relationships on the new data set produced using fuzzy clustering. Procedures in the flowchart as shown in Fig. 6 were followed. All input variables in the original data set are normalized to the range of [0,1]. The output variables (the normalized EMG signals) are
HOU et al.: IDENTIFICATION OF KEY VARIABLES USING FUZZY AVERAGE WITH FUZZY CLUSTER DISTRIBUTION
681
Fig. 12. Relationship between the kinematic variables (x axis) and EMG signals (y axis) of the muscle right latissimus dorsi (RLD). Variables from (A) to (L) are in the same sequence as in Table VII.
Fig. 11. The relationship between axis trunk velocity (x axis) and EMG signals (y axis). (A) Without clustering and (B) after clustering.
TABLE VI SUMMARY ABOUT THE CLUSTERS
also in the range of [0,1]. Then the data points were clustered as described in Section II. A summary of cluster properties is shown in Table VI. Those clusters containing fewer than ten data points (about 0.033% of the total) are considered as outliers and are removed from the data set. Then FCM algorithm was used to find centers of the rest clusters. By comparing the Euclidean distance of each data point in a cluster to the center of this cluster, the closest data point to the center is found. Using this data point to represent the corresponding cluster, a new data set with a different distribution to
the original data set was obtained. On this new data set, the fuzzy space was calculated. Fig. 11(B) average of in each shows the result of the same example as in Fig. 11(A), using FAFCD. As expected, the drop in Fig. 11(A) disappeared and the result has a clear physical explanation now. Fig. 12 shows the relationship between all kinematic variables and EMG signals of muscle right latissimus dorsi. Fig. 13 shows the relationship between all subject variables and EMG signals of this muscle. The relationships of inputs to the other muscles can be obtained similarly. With these relationships, a better understanding to the muscle activities can be gained. At the same time, the importance of the input variables is indicated by their influence rate . Table VII shows the influence rate of each kinematic variable to each output. The first row is the name of the muscle; the first column is the name of the kinematic variable. Table VIII shows the influence rate of each subject variable to each output. The first row is the name of the muscle; the first column is the name of the subject variable. Based on the influence rate, key variables can be identified. According to Tables VII and VIII, significance of the kinematic variables and subject variables are ranked as shown in Figs. 14 and 15, respectively. It is clear that kinematic variables are more significant than subject variables. Thus, these 12 kinematic variables should all be selected as inputs in modelling. This is a reasonable conclusion and agrees with our hypothesis. As for subject variables, four variables (standing height, shoulder height, lower arm length, and spine length) are more significant than the others. These variables should also be taken as inputs in modelling. However, by examining the two variables “standing height” and “shoulder height” in Table VIII, it
682
IEEE TRANSACTIONS ON FUZZY SYSTEMS, VOL. 15, NO. 4, AUGUST 2007
Fig. 13. Relationship between the subject variables (x axis) and EMG signals (y axis) of the muscle right latissimus dorsi. Variables from (A) to (O) are in the same sequence as in Table VIII.
is found that the influence rates of these two variables are very similar, for every muscle. In other words, these two variables are correlated. They are dependent variables to each other. Therefore, one of them can be removed. 3) Validation: As stated before, the result of FAFCD shows that kinematic variables are more significant than subject variables. This is a reasonable conclusion from the ergonomics point of view since kinematic variables are directly related to the muscular activities. For kinematic variables, it is certain that the variable “sagittal trunk moment” is the most significant variable in the EMG estimation system for manual lifting tasks. Result in Fig. 14 shows that FAFCD has correctly identified significance of this variable. For subject variables, four of them (standing height, shoulder height, lower arm length, and spine length) have been identified by FAFCD as the most significant subject variables. Coincidentally, these four variables apparently affect the moment arm during manual lifting tasks that involve a bending motion. To further validate the results given by FAFCD, two feedforward neural network models for EMG estimation were con-
structed. The “basic model” with one hidden layer described in [18] was used. In this traditional neural network structure, every input variable has an equivalent position. In Model I, all 12 kinematic variables and 15 subject variables are used as input; in Model II, only variables identified as significant variables are used, including all kinematic variables and three subject variables (shoulder height, lower arm length, and spine length). As stated before, standing height is correlated with shoulder height, so it is removed from Model II. The input dimension is decreased from 27 to 15. EMG signals of ten trunk muscles are output variables of the neural networks. Model performance was tested based on 1494 lifting trials (the same data set used for FAFCD). The conservative cross-validation method was employed. Every time 1/4 of the data is taken out for test and the other 3/4 used to train the model. A different 1/4 is taken for test and the rest used for training the next time. Continue this process until all the data are evaluated for test. Simulation results showed that removing 12 less significant subject variables did not notably decrease the performance of the EMG estimation model. Mean absolute error of all mus-
HOU et al.: IDENTIFICATION OF KEY VARIABLES USING FUZZY AVERAGE WITH FUZZY CLUSTER DISTRIBUTION
683
TABLE VII
INFLUENCE RATE OF KINEMATIC VARIABLES (SAG.
= SAGITTAL, LAT. = LATERAL, MOM. = MOMENT, ANG. = ANGLE, VEL. = VELOCITY, AND ACC. = ACCELERATION)
Fig. 15. Rank subject variables by their average influence rate (1: standing height, 2: shoulder height, 3: lower arm length, 4:spine length, 5: lower leg length, 6: body weight, 7: trunk breadth (xyphoid), 8: trunk circumference, 9: trunk depth (xyphoid), 10: trunk breadth (pelvis), 11: upper arm length, 12: elbow height, 13: upper leg length, 14: trunk depth (pelvis), 15: age).
cles for Model I and Model II are 7.47% and 7.52%, respectively.
forward and easy to implement. Knowing the significance of candidate input variables, complexity of the model and time of modelling may be greatly reduced.
IV. CONCLUSION FAFCD can find out the significance of specific input variables and how they influence the output, without the interference of the distribution of sampling data set. The method is straight-
REFERENCES [1] E. B. Bartlett, “Self determination of input variable importance by neural networks,” Neural, Parallel Sci. Comp., vol. 2, no. 1, pp. 103–114, 1994.
684
IEEE TRANSACTIONS ON FUZZY SYSTEMS, VOL. 15, NO. 4, AUGUST 2007
[2] B. Yuan and G. Klir, “Data-driven identification of key variables,” in Intelligent Hybrid Systems—Fuzzy Logic, Neural Networks, and Genetic Algorithms, D. Ruan, Ed. Boston, MA: Kluwer Academic, 1997, pp. 161–186. [3] M. Sugeno and T. Yasukawa, “A fuzzy-logic-based approach to qualitative modeling,” IEEE Trans. Fuzzy Syst., vol. 1, pp. 7–31, Feb. 1993. [4] S. L. Chiu, “Selecting input variables for fuzzy models,” J. Intell. Fuzzy Syst., vol. 4, pp. 243–256, 1996. [5] Y. Lin and G. A. Cunningham, “A new approach to fuzzy-neural system modeling,” IEEE Trans. Fuzzy Syst., vol. 3, pp. 190–198, May 1995. [6] Y. Lin, G. A. Cunningham, S. V. Coggeshall, and R. D. Jones, “Nonlinear system input structure identification: Two stage fuzzy curves and surfaces,” IEEE Trans. Syst., Man, Cybern. A, vol. 28, pp. 678–684, Sep. 1998. [7] M. F. Azeem, M. Hanmandlu, and N. Ahmad, “Structure identification of generalized adaptive neuro-fuzzy inference systems,” IEEE Trans. Fuzzy Syst., vol. 11, pp. 666–681, Oct. 2003. [8] E. C. Morabito and M. Versaci, “A fuzzy neural approach to localizing holes in conducting plates,” IEEE Trans. Magn., vol. 37, no. 5, pp. 3534–3537, Sep. 2001. [9] S. E. Papadakis, J. B. Theocharis, J. Kiartzis, and A. G. Bakirtzis, “A novel approach to short-term load forecasting using fuzzy neural networks,” IEEE Trans. Power Syst., vol. 13, pp. 480–492, May 1998. [10] A. H. Sung, “Ranking input importance in neural network modeling of engineering problems,” in Proc. IEEE World Congr. Comp. Intell., May 1998, vol. 1, pp. 316–321. [11] B. Bouqata, A. Bensaid, R. Palliam, and A. F. Gomez Skarmeta, “Time series prediction using crisp and fuzzy neural networks: A comparative study,” in Proc. IEEE/IAFE/INFORMS 2000 Conf. Comp. Intell. Financial Eng., Mar. 26–28, 2000, pp. 170–173. [12] M. F. Azeem, M. Hanmandlu, and N. Ahmad, “A new criteria for input variable identification of dynamical systems,” in Proc. IEEE Region 10 Int. Conf. Global Connectivity Energy, Comput, Commun. Contr., Dec. 17–19, 1998, vol. 1, pp. 230–233. [13] S. Papadakis and J. Theocharis, “An efficient fuzzy neural modeling approach using the fuzzy curve concept,” in Proc. 3rd IEEE Int. Conf. Electron., Circuits, Syst., Oct. 13–16, 1996, vol. 1, pp. 279–282. [14] E. S. Schrich, J. Ke, L. O. Hall, and D. B. Goldgof, “Fast accurate fuzzy clustering through data reduction,” IEEE Trans. Fuzzy Syst., vol. 11, pp. 262–270, Apr. 2003. [15] G. E. P. Box and G. M. Jenkins, Time Series Analysis, Forecasting and Control, 2nd ed. San Francisco, CA: Holden Day, 1976. [16] A. E. Gaweda, J. M. Zurada, and R. Setiono, “Input selection in datadriven fuzzy modeling,” in Proc. 10th IEEE Int. Conf. Fuzzy Syst., Dec. 2–5, 2001, vol. 3, pp. 1251–1254. [17] S. Auephanwiriyakul and J. M. Keller, “Analysis and efficient implementation of a linguistic fuzzy c-means,” IEEE Trans. Fuzzy Syst., vol. 10, pp. 563–582, Oct. 2002. [18] Y. Hou, J. M. Zurada, and W. Karwowski, “Prediction of EMG signals of trunk muscles in manual lifting using a neural network model,” in Proc. Int. Joint Conf. Neural Netw. (IJCNN 2004), Budapest, Hungary, Jul. 25–29, 2004, pp. 1935–1940. [19] J. Zurada, W. Karwowski, and W. S. Marras, “A neural network-based system for classification of industrial jobs with respect to the risk of low back disorders,” Appl. Ergon., vol. 28, no. 1, pp. 49–58, 1997. [20] Y. Hou, J. M. Zurada, W. Karwowski, and W. S. Maras, “A fuzzy approach for key variables identification of EMG evaluation system,” in Proc. Int. Joint Conf. Neural Netw. (IJCNN 2005), Montreal, PQ, Canada, Jul. 31–Aug. 4 2005, pp. 2520–2525. [21] W. Lee, W. Karwowski, W. S. Marras, and D. Rodrick, “A neuro-fuzzy model for estimating electromyographical activity of trunk muscles due to manual lifting,” Ergonomics, vol. 46, no. 1–3, pp. 285–309, Jan. 15, 2003.
Jacek M. Zurada (M’82–SM’83–F’96) is the Samuel T. Fife Alumni Professor and Chair of Electrical and Computer Engineering Department at the University of Louisville, Louisville, KY. He was a Visiting Professor at Princeton University, National University of Singapore, Nanyang Technological University, and the University of Karlsruhe, Germany. He is the author or coauthor of more than 250 journal and conference papers in the area of neural networks, computational intelligence, data mining, image processing, and VLSI circuits. He was coeditor of Knowledge-Based Neurocomputing (Cambridge, MA: MIT Press, 2000), author of the introduction to Artificial Neural Systems (PWS, 1992), contributor to Progress in Neural Networks (Ablex, 1994/1995), and coeditor of Computational Intelligence: Imitating Life (New York: IEEE Press, 1994). He is an Associate Editor of Neurocomputing. He has delivered numerous invited plenary conference presentations and seminars throughout the world. Dr. Zurada was an Associate Editor of IEEE TRANSACTIONS ON CIRCUITS AND SYSTEMS—PART I: FUNDAMENTAL THEORY AND APPLICATIONS and PART II: ANALOG AND DIGITAL SIGNAL PROCESSING. In 2001–2003, he was a member of the Editorial Board of the PROCEEDINGS OF IEEE. In 1998–2003, he was Editor-in-Chief of IEEE TRANSACTIONS ON NEURAL NETWORKS. He has received a number of awards for distinction in research and teaching, including the 1993 Presidential Award for Research, Scholarship and Creative Activity. In 2001, he received the University of Louisville President’s Distinguished Service Award for Service to the profession. In 2003, he received the title of Professor by the President of Poland, Aleksander Kwasniewski and the Honorary Professorship of Hebei University in China. Since 2005, he has served as Foreign Member of the Polish Academy of Sciences. He is Past President of the IEEE Computational Intelligence Society. He is a Distinguished Speaker of IEEE CIS.
Yanfeng Hou (S’05) received the B.S. degree in electrical engineering from Sichuan University, Sichuan, Chinam and the M.S. degree in electrical engineering from Wuhan University, Hubei, China. He is currently pursuing the Ph.D. degree in the Department of Electrical and Computer Engineering, University of Louisville, KY. His research interests are in the areas of artificial neural networks, fuzzy logic, data mining, and other artificial intelligence and machine learning-based methodologies with focus on ergonomics and
William S. Marras holds the Honda Endowed Chair in the Department of Industrial and Systems Engineering, The Ohio State University, Columbus. He is Director of the Biodynamics Laboratory and has joint appointments in the Departments of Orthopaedic Surgery, Physical Medicine, and Biomedical Engineering. His research is centered on occupational biomechanics issues. He is a pioneer in how motion influences the risk of musculoskeletal disorders in the workplace. His research includes workplace biomechanical epidemiologic studies, laboratory biomechanics studies, mathematical modeling, and clinical studies of the low back and upper extremity.
biomedical applications. Mr. Hou is a member of Tau Beta Pi and the IEEE CIS Standards Committee.
Waldemar Karwowski received the M.S. degree in production engineering and management from the Technical University of Wroclaw, Poland, in 1978, the Ph.D. degree in industrial engineering from Texas Tech University, Lubbock, in 1982, and the D.Sc. (Dr.Hab.) degree in management science from the Institute for Organization and Management in Industry, Warsaw, Poland, in 2004. He is the J. B. Speed School of Engineering Alumni Scholar for Research and a Professor of Industrial Engineering and Director of the Center for Industrial Ergonomics, University of Louisville, Louisville, KY. His research, teaching, and consulting activities focus on work system design, organizational and management ergonomics, human-system integration and safety of advanced manufacturing, and neurofuzzy modeling and fuzzy systems applications. Dr. Karwowski is a Fellow of the International Ergonomics Association, Human Factors and Ergonomics Society, Institute of Industrial Engineers, and The Ergonomics Society. He received the Doctor of Science Honoris Causa degree from the South Ukrainian State K. D. Ushynsky Pedagogical University of Odessa, Ukraine, in 2004 and the Technical Unviersity of Kosice, Slovakia, in 2006.
HOU et al.: IDENTIFICATION OF KEY VARIABLES USING FUZZY AVERAGE WITH FUZZY CLUSTER DISTRIBUTION
Kermit Davis received the doctorate degree from The Ohio State University, Columbus, in 2001. He was trained in industrial engineering with specialization in occupational ergonomics and low back biomechanics with special interest in multiple exposures, both physical and psychosocial stressors. He is with the Department of Environmental Health, University of Cincinnati, Cincinnati, OH. His current research is focusing on the effect of physical workplace demands as well as mental workload on the responses within the lower back. He has published numerous articles about the impact of workplace stressors on the lower back including
685
studies evaluating warehousing, patient handling, alternative modes of handling (e.g., team lifting, one hand lifting, pushing/pulling), injured populations, and ergonomic interventions (e.g., back belts, lifting hoists, adjustable fork lifts). Dr. Davis has received several major research awards including the Alphonse Chapanis Student Paper Award from the human Factors and Ergonomics Society, Volvo Award For Low Back Pain Research in Biomechanical Studies from the International Society for the Study of the Lumbar Spine, Alice Hamilton Award from the National Institute for Occupational Safety and Health, and Promising Young Scientist Award from the International Society of Biomechanics.