Journal of Communications Vol. 10, No. 1, January 2015
Identifying Influential Nodes for Efficient Routing in Opportunistic Networks Zhenxiang Gao1, Yan Shi1, and Shanzhi Chen2,3 1
State Key Laboratory of Networking and Switching Technology, Beijing University of Posts and Telecommunications, Beijing 100876, China 2 State Key Laboratory of Wireless Mobile Communications, China Academy of Telecommunications Technology, Beijing 100083, China 3 Datang Telecom Technology & Industry Group, Beijing 100083, China Email: {gaozx_bupt, shiyan}@bupt.edu.cn;
[email protected]
select the nodes with high centrality as bridge nodes for message delivery [6]. The measurements of node centrality in common use are degree centrality (DC), betweenness centrality (BC), and closeness centrality (CC) [7], [8]. But, there are some limitations and disadvantages of these metrics on influential nodes identification in opportunistic networks. Degree centrality is a straightforward and efficient metric but less relevant due to the metric does not take into consideration the global structure of the network. BC and CC are based on the shortest paths which depend literally on the number of intermediary nodes and are found by minimizing the number of intermediary nodes. They are difficult to apply in large-scale networks due to their computational complexity. Thus, how to effectively and efficiently identify influential nodes is of theoretical and practical significance to enable nodes to make right decisions while spreading or forwarding messages in opportunistic networks. In this paper, we propose the semi locally evaluated centrality to identify influential nodes for message delivery in opportunistic networks. Comparing with closeness centrality and betweenness centrality, our semi locally evaluated centrality metric performs much lower computational complexity. We also present a simple message forwarding algorithm to evaluate the benefits of the proposed semi locally evaluated centrality metric on message forwarding in opportunistic networks. The experiments on real-world mobility traces and synthetic mobility traces show that semi locally evaluated centrality metric can well identify influential nodes in opportunistic networks.
Abstract—Opportunistic networks exploit human mobility and consequent device-to-device contacts to opportunistically create data paths over time. Identifying influential nodes as relay is a crucial problem for efficient routing in opportunistic networks. The degree centrality method is very simple but of little relevance. Although closeness centrality and betweenness centrality can effectively identify influential nodes, they are incapable to be applied in large-scale networks due to the high computational complexity. In this paper, we focus on designing an effective centrality ranking metric with low computational complexity in opportunistic networks. We propose the semi locally evaluated centrality metric to identify influential nodes for message forwarding in opportunistic networks. We also present a simple message forwarding algorithm, and employ real world mobility traces and synthetic mobility traces to evaluate the benefits of the proposed semi locally evaluated centrality metric. Results demonstrate the efficiency of the proposed metric in opportunistic networks. Index Terms—Opportunistic networks, semi locally evaluated centrality metric, efficient routing.
I.
INTRODUCTION
Technological advances are leading to a world replete with small wireless devices with a variety of sensing and computing functions, thus paving the way for a multitude of opportunities for pairwise device contacts. Opportunistic networks which rely on the store-carry and forward paradigm use human mobility and consequent wireless contacts between mobile devices, to propagate information in a peer-to-peer manner [1], [2]. Designing and analyzing efficient protocols in opportunistic networks is challenging [3], forwarding schemes should balance the overhead from redundant copies with successful delivery and minimal delay. The consideration of social characteristics has opened new horizons in design of opportunistic routing strategies in recent years [4], [5]. This approach constructs a social graph based on the contacts of all nodes. One of the main objectives of social-based opportunistic routing is to
II. RELATED WORK Opportunistic networks employ store-carry-andforward paradigm to carry messages between the network nodes. Data forwarding becomes a challenging issue in this paradigm. Some literatures exploit node’s contact history to predict node's future steps as data forwarding decisions to improve the routing algorithm performances. Fresh [9] forwarded a message to the encountered node only if it had encountered the destination more recently than did
Manuscript received September 24, 2014; revised January 29, 2013. Corresponding author email:
[email protected]. doi:10.12720/jcm.10.1.48-54 ©2015 Engineering and Technology Publishing
48
Journal of Communications Vol. 10, No. 1, January 2015
where is the tuning parameter which determines the relative importance of the number of neighbors compared to the number of times as bridge node to combine both adjacent nodes and times as bridge node for measuring node’s local centrality. is defined as follows:
the source node itself. PRoPHET [10] made use of delivery predictability metric to calculate how likely a node would be able to deliver a message to the destination. In recent years, several research works consider the problem of designing opportunistic routing schemes that are aware of social properties. One of the primary analysis methods of social properties is node centrality measures. Degree centrality, closeness centrality and betweenness centrality have been widely used in network analysis. Some existing opportunistic routing solutions utilize these centrality metrics to identify influential nodes for routing decision. Bubble Rap [11] used degree centrality as its centrality index to find a node which had a higher ranking than the current node as relay. SocioAware Overlay [12] used closeness centrality to find a node which had the best visibility in the network as messaging brokers to effectively disseminate message in delay tolerant networks. SAMPhO [13] and SimBet [14] based on the identification of the betweenness centrality to use potential nodes to forward messages to the destination. In this paper, we extend their work to propose a novel centrality metric with low computation complexity. Our central idea is to consider the nearest and the next nearest neighbors and exploits node’s semi local centrality to identify influential nodes for message forwarding in opportunistic networks. We will show the detail of our metric in the next section.
1
2 2 2 (2) ei ( j ) e j ( ) i j (i ) j ( i ) We use pi ( j ) to represent the ratio of times of node i as bridge node for node j connecting with node i’s neighbors to total times of node i as bridge node for node i’s neighbors connecting with each other. pi ( j ) is denoted as follows:
pi ( j ) e i ( j )
SLC (i) LC (i)
(4)
O(mn n2 log(n)) where m is the number of links [17]. Intuitively, semi locally evaluated centrality metric which only explores the nearest and the next nearest neighbors’ mobility patterns saves complexity, it has lower computational complexity than global centrality metrics. The computational complexity of semi locally evaluated centrality metrics is O(k 3 ) where k is the average degree of the network. IV. MESSAGE FORWARDING STRATEGY In this section, we will present a simple message forwarding algorithm to evaluate the effectiveness of semi locally evaluated centrality on message forwarding. Since communication in opportunistic networks is challenging as it must handle time-varying links, long delay, and dynamic topology, social relations and behaviors among mobile users are usually long term characteristics and less volatile than node mobility. Thus, we extend jaccard similarity index [18] to propose a social relation exploring method. If two nodes contact with each other very frequently, they may have some knowledge between them. If two nodes have more other
propose the local centrality metric taking into account these features, as:
©2015 Engineering and Technology Publishing
pi ( j )
centrality that in O(mn) and O(mn n2 log(n)) time on un-weighted and weighted networks, respectively, where m is the number of links. Even if the full network topology is known, closeness centrality is too costly-
denote that e i ( j ) ET ( j (i) ) represents the number of times of node i as bridge node to enable message delivery between node j and node i ’s other neighbors where (i ) is the set of the neighbors of node i. Thus we
ei ( j )
LC ( j )
all pairs of nodes in a network is O(n3 ) [15]. Brandes [16] presents a fast technique to compute betweenness
set of entities V (nodes) and a set of connections E (edges) between these entities during time interval T. We
B. Computation Complexity Analysis Closeness centrality and betweenness centrality are based on the all-pairs shortest-paths. Using Floyd's algorithm, the complexity of the shortest paths between
T
j ( i )
(3)
j ( i )
A. Semi Locally Evaluated Centrality In order to decrease the computational complexity, we propose semi locally evaluated centrality metric to identify influential nodes in opportunistic networks. We first study node’s local centrality. To measure a node's local centrality, we should consider the following three behavioral features: a large number of neighbors, a large number of times as bridge node to enable message delivery between its neighbors, even distributions of times as bridge node to enable message delivery for its neighbors. We assume that the observed time T is finite, from the start time tstart until the end time tend . Define a
LC (i)
ei (k )
Semi locally evaluated centrality which considers both the nearest and the next nearest neighbors’ local centrality is proposed as follows:
III. INFLUENTIAL NODE EXPLORATION
T
k ( i )
(1)
49
Journal of Communications Vol. 10, No. 1, January 2015
acquaintances in common, they may have a higher probability of two people being acquainted. The social relation exploring method is defined as follows:
Si , j (t )
w w
k| ( i ) ( j )|
k| ( i ) ( j )|
i ,k
w j ,k
i ,k
w j ,k
and note that the only 84 nodes rather than the full 100 nodes appeared during this period. We define a connection as the period of time during which two devices are in mutual radio transmission range and can exchange data. Table I describes some characteristics of the data set. Synthetic mobility traces: we use Opportunistic Network Environment simulator (ONE) [20] which is a typical opportunistic networking evaluation system to generate synthetic mobility traces for routing performance evaluation. In the simulation, we generated 15 randomly located non-overlapping community regions (home, work, buildings, etc.) and we allocated 100 nodes (i.e., people) to these community regions. Then, for each node, we randomly assigned 5 different communities to visit regularly. The activity area of some nodes was limited; they could only access regular communities and even moved in a single community. For other nodes, their activity areas could be very wide; they could access more communities. The above activity patterns were also common in human real social life. Nodes moved according to Random Waypoint model within a community and moved according to Map Route movement model among communities. Related simulation parameters are shown in Table II.
(5)
(i ) is the set of the neighbors of node i . wi ,k is the contact times between nodes i and k till time t. where
In order to compare the effectiveness of semi locally evaluated centrality metric with three traditional centrality metrics (degree centrality, betweenness centrality and closeness centrality) on message delivery, we denote Centralityi (t ) as the value of node i’s centrality at time t based on one of the four centrality metrics. Thus the algorithm describes as follows. If a node i having a message destined to d meets with node j, node i first compares
Si ,d (t ) with S j ,d (t ) . If node j has
higher social relation strength to encounter d than node i does and S j ,d (t ) is not less than threshold , the message will be forwarded. Noting that here is a threshold ensuring that the social relations between node j and destination node d is strong enough. At last, if the social relation strength between node i and destination d is lower than and the node j also has lower social relation strength than to destination d but has higher centrality value, message will be forwarded to it as well. The pseudo-code for message forwarding algorithm is shown in Algorithm 1.
TABLE II: SIMULATION PARAMETERS Items
MIT data set
Network area
1000 1000 (m2 )
Community area
100 100 (m2 )
Transmit speed Communication range Message size Message TTL Node buffer size
250 KB / s
10 m 50 100 KB
24 h 1000MB
Node speed
0.5 1.0 m / s
Simulation time
260,000 s
B. Effectiveness Analysis of Semi Locally Evaluated Centrality Metric on Influential Nodes Identification V. SIMULATION AND EVALUATION
In this section, we will use Kendall’s tau (rank) correlation coefficients [21], [22] to evaluate the effectiveness of the proposed centrality metric on influential nodes identification in reality. Let ( x1 , y1 ) , ( x2 , y2 ) , … , ( xn , yn ) be a set of observations of the joint random variables X and Y respectively, such that all the values of xi and yi are
A. Simulation Scenarios and Parameter Settings TABLE I: MIT DATA SET DESCRIPTION Items participants Duration Av. Contacts per day Scanning rate Scanning distance
MIT data set
84 12 days 110 5 minutes 5 meters
unique. Any pair of observations ( xi , yi ) and ( x j , y j ) are said to be concordant if the ranks for both elements agree: that is, if both xi x j and yi y j or if both xi x j and
Real world mobility trace: we use MIT real world data set to evaluate the effectiveness of proposed centrality metric in reality. It was conducted from 2004-2005 at the MIT Media Laboratory [19]. We use the Bluetooth trace over 12 days in 2004 November ©2015 Engineering and Technology Publishing
yi y j . They are said to be discordant, if xi x j and yi y j or if xi x j and yi y j . If xi x j or yi y j , the pair is neither concordant nor discordant. Then Kendall’s Tau is defined as:
50
Journal of Communications Vol. 10, No. 1, January 2015
Nc Nd (6) 1 n(n 1) 2 where N c and N d are the number of concordant and discordant pairs, respectively. Betweenness centrality and closeness centrality rely on the identification and length of the shortest paths among nodes in the network. Therefore, in an effort to generalize these measures for opportunistic networks, a first step is to generalize how shortest distances are identified and their length defined. Opsahl’s shortest path [23] uses tuning parameter to incorporate both the number of ties and their tie weights when applied to weighted or unweighted networks. The tuning parameter allows researchers to define the relative importance they want. When 0 , it calculates shortest distance in unweighted networks. When 1 , the outcome is the same as the path obtained with Dijkstra’s algorithm. For 0 1 , a shorter path composed of weak ties is favored over a longer path with strong ties. Conversely, and when 1 , the impact of additional intermediary nodes is relatively unimportant compared to the strength
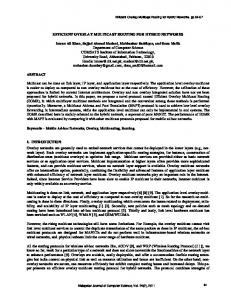
of the ties and paths with more intermediaries are favored. The tie weights of Opsahl’s shortest path are contact times. We first analyze the correlation between node’s local centrality (degree centrality, weighted degree centrality [24]) and node’s global centrality (closeness centrality, betweenness centrality) with MIT real world data set. In Fig. 1 (a) and Fig. 1 (b), the curves of the correlation between weighted degree centrality and betweenness centrality fluctuate more slightly than those of degree centrality. The correlation of weighted degree centrality and betweenness centrality is higher than that of degree centrality in weighted network. Since opportunistic network is not a binary network and links are differentiated and not all links are equally conducive to forwarding information, thus a certain rough approximation the node with higher frequency of contacting other nodes may has more chances to forward message as relay in opportunistic networks. However, in Fig. 2 (a) and Fig. 2 (b), degree centrality is more relevant with closeness centrality than weighed degree centrality. We know that the node with more neighbors may have higher capability to disseminate information in weighted or un-weighted networks.
Fig. 1. Illustration of the Kendall’s tau (rank) correlation coefficients of betweenness centrality with degree centrality and weighted degree centrality through temporal evolution.
Fig. 2. Illustration of the Kendall’s tau (rank) correlation coefficients of closeness centrality with degree centrality and weighted degree centrality through temporal evolution.
fluctuated by semi locally evaluated centrality. For betweenness centrality evaluating in Fig. 3 (a), the average Kendall’s tau (rank) correlation coefficients between semi locally evaluated centrality and betweenness centrality are close to 0.7 and lower than the correlations with closeness centrality. For closeness centrality evaluating in Fig. 3 (b), the average Kendall’s
We then analyze the correlation between semi locally evaluated centrality metric and global centrality with various of Opsahl’ shortest path and window time size. The results are shown in Fig. 3. The Kendall’s tau (rank) correlation coefficients are slightly fluctuated with tuning parameter and window time increasing. Thus a certain rough approximation the global centrality ranking may be ©2015 Engineering and Technology Publishing
51
Journal of Communications Vol. 10, No. 1, January 2015
tau (rank) correlation coefficients are more than 0.8, and the curve is slightly ascending with tuning parameter and window time increasing. Comparatively speaking, semi locally evaluated centrality has stronger correlation with closeness centrality than betweenness centrality.
Comparing with degree centrality and weighted degree centrality, semi locally evaluated centrality performs higher correlations with global centrality than degree centrality and weighted centrality in both un-weighted and weighted networks.
Fig. 3. Illustration of the Kendall’s tau (rank) correlation coefficients between semi locally evaluated centrality and global centrality.
Fig. 4. Comparing the delivery ratio by different centrality metrics..
Fig. 5. Comparing the average hops by different centrality metrics.
Fig. 6. Comparing the average latency by different centrality metrics.
©2015 Engineering and Technology Publishing
52
Journal of Communications Vol. 10, No. 1, January 2015
evaluated centrality metric also performs better than that with degree centrality metric. The simulation results with different traces show that semi locally evaluated centrality metric with low computational complexity performs well on message forwarding in opportunistic networks.
C. Performance Analysis of the Proposed Forwarding Strategy with Different Centrality Metrics In the simulation, we use real world mobility traces and synthetic mobility traces to compare the performance of the routing algorithm based on semi locally evaluated centrality metric with the routing algorithm based on the three traditional centrality metrics(betweenness centrality metric [8], closeness centrality metric [8] and degree centrality metric [8]) on message forwarding. 1/5 of the simulation time will be used as warm up period during which nodes build their initial contact history for getting preset nodes’ social relations and centrality values. Each message copy has a maximum hop count: 16, i.e. messages exceed 16 hops before reaching destinations will be discarded. The threshold is empirically set to 0.5. During the simulation period, each node has sufficiently large buffer space to store each message it receives. For the comparison of the algorithm with different centrality metrics, we use the following three metrics: message delivery ratio, average cost and average latency. Delivery ratio is the proportion of messages that are delivered to their destinations among the total messages generated. Average hops are the average number of hops per message during the simulation period. Finally, average latency is defined as the average time between creation of a message and its delivery to the target node. As it is seen in the Fig. 4, the message forwarding algorithm with closeness centrality metric achieves the highest delivery ratio. The delivery ratio of the algorithm with semi locally evaluated centrality metric is nearly to that with closeness centrality metric and achieves better performance than the algorithm with betweenness centrality metric or degree centrality metric. Fig. 5 compares the average hops by the message forwarding algorithms with different centrality metrics during the simulation. While betweenness centrality measures the number of times of a particular node which lies between the shortest paths in the network, the message forwarding algorithm with betweenness centrality metric achieves the lowest communication cost. The average hops of the message forwarding algorithm with semi locally evaluated centrality metric is very close to that with closeness centrality metric due to semi locally evaluated centrality ranking has strong correlation with closeness centrality ranking and performs better than that with degree centrality. In Fig. 6, the message forwarding algorithm with semi locally evaluated centrality metric achieves the lowest average latency. That is because the message forwarding algorithm with semi locally evaluated centrality metric employs more nodes as relay to deliver the message to the destination with lower latency than the algorithm with betweenness centrality metric or closeness centrality metric. Since degree centrality measures nodes’ local centrality and does not take into consideration the global structure of the network, the algorithm with semi locally
©2015 Engineering and Technology Publishing
VI. CONCLUSION This paper was motivated by the need for identifying influential nodes with low computation complexity for message forwarding in opportunistic networks. We proposed the locally evaluated centrality metric which exploited the nearest and the next nearest neighbors’ mobility patterns to identify influential nodes for message forwarding in opportunistic networks. Our metric performs much lower computational complexity than those of betweenness and closeness centralities. Simulations results based on the real world mobility traces and synthetic mobility traces demonstrated that our metric which performed very close to closeness centrality can well identify influential nodes for message forwarding in opportunistic networks. ACKNOWLEDGMENT This work was supported by the National Science Foundation Projects (Grant No. 61300183) and the National Science Fund for Distinguished Young Scholars (Grant No. 61425012 ) in China. REFERENCES M. Conti and M. Kumar, “Opportunities in Opportunistic Computing,” IEEE Computer, vol. 43, no. 1, pp. 42-50, Jan. 2010. [2] M. Conti, S. Giordano, M. May, and A. Passarella, “From opportunistic networks to opportunistic computing,” Communications Magazine, IEEE, vol. 48 no. 9, pp. 126–139, 2010. [3] B. Jedari and F. Xia, “A survey on routing and data dissemination in opportunistic mobile social networks,” arXiv Preprint, 2013. [4] F. Li, L. Zhao, C. Zhang, et al., “Routing with multi-level crosscommunity social groups in mobile opportunistic networks,” Personal and Ubiquitous Computing, vol. 18 no. 2, pp. 385-396, 2014. [5] H. A. Nguyen and S. Giordano, “Context information prediction for socialbased routing in opportunistic networks,” IEEE. Ad Hoc Netw., vol. 10, pp. 1557 ¨C 1569, Nov. 2012. [6] J. W. Chang and C. Chen, “CROP: Community-relevance-based opportunistic routing in delay tolerant networks,” in Proc. Wireless Communications and Networking Conference, 2013, pp. 1938-1943. [7] A. Landher, B. Friedl, and J. Heidemann, “A critical review of centrality measures in social networks,” Business & Information System Engineering, vol. 2, no. 6, pp. 371-385, Dec. 2010. [8] L. C. Freeman, “Centrality in social networks conceptual clarification,” Social networks, vol. 1, no. 3, pp. 215–239, 1979. [9] H. Dubois-Ferriere, M. Grossglauser, and M. Vetterli, “Age matters: Efficient route discovery in mobile ad hoc networks using encounter ages,” in Proc. 4th MOBIHOC/ACM, 2003, pp. 257-266. [10] A. Lindgren, A. Doria, and O. Schelen, “Probabilistic routing in intermittently connected networks,” ACM SIGMOBILE. Mobile. Comput. Commun. Rev, vol. 7, pp. 19-20, 2003. [1]
53
Journal of Communications Vol. 10, No. 1, January 2015
[11] P. Hui, J. Crowcroft, and E. Yoneki, “Bubble rap: Social-based forwarding in delay-tolerant networks,” IEEE Transactions on Mobile Computing, vol. 10, no. 11, pp. 1576-1589, 2011. [12] E. Yoneki, P. Hui, S. Chan, and J. Crowcroft, “A socio-aware overlay for publish/subscribe communication in delay tolerant networks,” in Proc. of ACM MSWiM, 2007, pp. 225–234. [13] N. Vastardis, K. Yang, and S. Leng, “Socially-aware multi-phase opportunistic routing for distributed mobile social networks,” Wireless Personal Communications, vol. 79, pp. 1343-1368, 2014. [14] E. M. Daly and M. Haahr, “Social network analysis for routing in disconnected delay-tolerant manets,” in Proc. 8th ACM International Symposium on Mobile ad Hoc Networking and Computing, 2007, pp. 32-40. [15] R. W. Floyd, “Algorithm 97: Shortest path,” Communications of the ACM, vol. 5, no. 6, pp. 345, Jun. 1962. [16] U. Brandes, “A faster algorithm for betweenness centrality,” Journal of Mathematical Sociology, vol. 25, no. 2, pp. 163-177, 2001. [17] K. Wehmuth and A. Ziviani, “Distributed assessment of the closeness centrality ranking in complex networks,” in Proc. Fourth Annual Workshop on Simplifying Complex Networks for Practitioners. ACM, 2012. [18] L. Lü and T. Zhou, “Link prediction in complex networks: A survey,” Physica A: Statistical Mechanics and its Applications, vol. 390, no. 6, pp. 1150-1170, 2011. [19] N. Eagle, A. S. Pentland, and D. Lazer, “Inferring friendship network structure by using mobile phone data,” Proc. Nat’l Academy of Sciences, vol. 106, no. 36, pp. 15274-15278, Sept. 2009. [20] A. Keränen, J. Ott, and T. Kärkkäinen, “The ONE simulator for DTN protocol evaluation,” in Proc. SIMUTools ’09, ICST, New York, NY, USA, 2009. [21] M. Kendall, “A new measure of rank correlation,” Biometrika, vol. 30, pp. 81–89, 1938. [22] J. Myers and A. Well, Research Design and Statistical Analysis, New York: Harper Collins, 1991. [23] T. Opsahl, F. Agneessens, and J. Skvoretz, “Node centrality in weighted networks: Generalizing degree and shortest paths,” Social Networks, vol. 32, no. 3, pp. 245-251, Jul. 2010. [24] A. Barrat, M. Barthelemy, and R. Pastor-Satorras, “The architecture of complex weighted networks,” Proceedings of the
©2015 Engineering and Technology Publishing
National Academy of Sciences of the United States of America, vol. 101, no. 11, pp. 3747-3752, Sept. 2004. Zhenxiang Gao is currently working toward the Ph.D. degree with State Key Laboratory of Networking and Switching Technology, Beijing University of Posts and Telecommunications (BUPT), Beijing, China. His current research interests include protocol design and performance optimization of opportunistic networks and mobile computing.
Yan Shi received her Ph.D. degree from Beijing University of Posts and Telecommunications (BUPT) in 2007. She is currently a research staff of the State Key Laboratory of Networking and Switching Technology. Her current research interests include network architecture evolution, protocol design and performance optimization of future networks and mobile computing, especially mobility management technology.
Shanzhi Chen received his Ph.D. degree from Beijing University of Posts and Telecommunications (BUPT), China, in 1997. He joined Datang Telecom Technology Industry Group in 1994, and has served as CTO since 2008. He is a member of the steering expert group on information technology of the 863 Program of China, and director of the State Key Laboratory of Wireless Mobile Communications (CATT). He devoted his works to the development of TD-SCDMA 3G and TD-LTE-advanced 4G from 2004. He received State Science and Technology Progress Awards in 2001 and 2012 respectively. His current research interests include network architecture, mobile communication technology, Internet of Things (IoT) and emergency communication.
54