Identifying Issues in Customer Relationship Management at Merck-Medco
Gholamreza Torkzadeh and Jerry Cha-Jan Chang Department of MIS College of Business University of Nevada, Las Vegas Gregory W. Hansen Vice President Customer Service Operations Merck-Medco
September 2004 Revised March 2005
Please direct correspondence to: Reza Torkzadeh Department of MIS College of Business University of Nevada, Las Vegas 4505 Maryland Parkway - Box 456034 Phone: (702) 895-3796 E-mail:
[email protected]
Identifying Issues in Customer Relationship Management at Merck-Medco Abstract This paper reports the results of a study designed in close collaboration with Merck-Medco to identify key barriers to the success of their customer relationship management. To identify the key factors, we first used focus groups of principle users of the system to brainstorm and generate a list of scenarios and issues. A team of managers, supervisors and customer service representatives then consolidated this list. A 54-item survey was derived from the list and used to collect 1460 responses from the user groups within the company. Data were equally divided into two sets. Exploratory factor analysis was used with the first data set to identify principal factors that explained the majority of problem areas. Structural equation modeling was used with the second data set to further examine, shorten, and confirm the initial list of factors. The study results suggest a five-factor 13-items model that describe barrier to the success of customer relationship management in terms of ‘standard operating procedure compliance’, ‘accountability and ownership’, ‘callback information content’, ‘customer contact process’, and ‘dispensing and replacement process’. These factors explained the majority of customer relationship problems in the company. These measures can be used by the company to plan and monitor remedial response. Evidence of reliability and construct validity is presented for the measurement models and decision-making implications are discussed. Subject Areas: Information System Application, Customer Relationship Management, Call Centers, Structural Equation Model, Instrument Development.
2
1. Introduction To manage prescription drug benefit for sixty million customers, Merck-Medco has made a significant investment in its customer relationship management (CRM) over the recent years. Computer applications and system procedures are developed and used to schedule customer service representatives and balance call traffic to ensure speed and service quality. A network of six call centers in five states within the continent of the US handles over 40 million customer calls per year. Frequently, clients have service penalties associated with the speed of answer and thus the service is painstakingly managed to avoid penalty. Ideally, the company would like for the customer service representatives to analyze customer data online and be able to resolve customer issues at the first contact. Yet, the call centers and customer service representatives are not always able to resolve all issues online. The unresolved cases are queued for follow-up by a team of customer service representatives within each dispensing pharmacy. The majority of customer and client complaints have been traced to this queuing process. The company has for the past few years struggled to refine this process with limited success. Reasons for member dissatisfaction are numerous and difficult to prioritize. In this paper, we report the results of a collaborative effort between academe and practice to improve customer relationship management at Merck-Medco. With a few exceptions such as BP and IBM [12, 26], very few studies of this kind are reported in research journals. This study was designed to accomplish two objectives that together will help management develop strategies for increasing CRM success. The first objective was to identify primary factors that result in member dissatisfaction with customer relationship management, more specifically with the call center. The second objective was to produce a reliable and valid set of measures that can
3
be used by the company and others to monitor employee training effectiveness and remedial plans. The methodology, sample, and procedures were decided with these objectives in mind. The subjects in this study were people who directly interacted with the system on a daily basis to make decisions and serve customers. Through close collaboration with the firm, we collected a large sample that represents over 75% of all user groups. The level of participation was influenced by the users’ desire to improve the system and the management involvement in the study. In the following section we will review the literature on CRM and clarify the construct. The literature review describes call center issues in a broader perspective of customer relationship management. Section 3 provides the background for Merck-Medco. Section 4 describes research methodology followed by section 5 that describes data analysis and results. Discussion and conclusions are provided in sections 6 and 7, respectively.
2. Customer Relationship Management Customer relationship management incorporates information acquisition, information storage, and decision support functions to provide customized customer service [23]. It enables customer representatives to analyze data and address customer needs in order to promote greater customer satisfaction and retention. It helps organizations to interact with their customers through a variety of means including phone, web, e-mail, and salesperson. Customer representatives can access data on customer profile, product, logistics and the like to analyze problems and provide online and rapid response to customer queries. Companies use CRM to not only create a customer profile, but also to anticipate customer needs, conduct market research, and prompt customer purchase [26]. It is suggested that it costs up to twelve times more to gain a new customer than to retain an existing one [33]. A
4
problem needs to be resolved on the first contact or the chances are the customer with an option to go elsewhere will never call back [39]. Because of the potential benefits, organizations commit significant hardware, software, and human resources and often restructure their processes in order to implement CRM. It took IBM a 4-year initiative to re-engineer its customer relationship management [26]. However, despite the extensive commitment, it is suggested that many of these systems fail to fulfill expectations [33, 35, 46]. The lack of proper integration of data across organizational functions is suggested as one of the reasons why many companies struggle with their CRM systems [41]. The interplay between technological, organizational, and individual factors also affects outcomes of these systems [22, 24]. In a recent study, Goodhue et al. [19] examined challenges and opportunities of CRM in several organizations. They suggest that the growth of CRM is driven by the changing demands of the business for quality service, the availability of large amount of data, and the role of information technology. They suggest that in order to benefit fully from CRM, firms may need to undergo a major change in organizational culture and business practices. Organizational change requires significant commitment and has high potential in terms of opportunities and challenges. The authors recommend different levels of integration, transformation, and application for CRM depending on the organizational needs and maturity. A significant portion of customer dissatisfaction is due to employees’ inability or unwillingness to respond to service failures [38]. In the financial services sector, for example, more than 70 percent of customers defect because of dissatisfaction with service quality [8]. Organizations with service failure and recovery problems need to communicate commitment to customers and strengthen bonds [4], CRM can help these organizations.
5
In the pharmaceutical industry, CRM has become a great investment and plays a significant part in managing customer requests. Accurate data, effective processing, and crossfunctional integration are critical success factors in improving customer satisfaction. Product information (e.g., specification, inventory, price, delivery method) are readily available to customer representatives to facilitate immediate and accurate response to customers in their first contact. Callbacks are minimized as they involve cost (in employee time) and the risk of losing the customer. Processes are streamlined and quality control is imbedded within the system in order to ensure continuous and consistent monitoring of customer service. Measures of service quality have been developed and used in research studies of marketing [29], MIS [45], and call centers [13]. Information technology plays an important role in CRM success [5, 26, 31]. Describing the role of technology in service quality, Harvey et al. [21] point out the important gains that come from producing and delivering more value to the customer. They suggest a model that describes how services that provide ‘value-added partnerships’ can be created through information technology. Improved service quality is perceived through close interaction and realtime flow of information. Integration of telephone communications, database, local area networks and other information system applications have clearly enhanced the CRM function [1, 36]. Information technology applications can be used to create customer ‘empowerment’ that will ultimately result in customer satisfaction [36]. Organizational web sites are increasingly used to deliver services as well as accumulate customer information. CRM professionals who are trained in information technology and marketing [32] have been in great demand in recent years [47].
6
Despite the important role that information technology plays in CRM, academic IS research has been lacking [40]. Benbasat and Zmud [3] encourage practice of relevance where results of research studies can be used in practical decision-making processes. This study was carried out at Merck-Medco, a large U.S. pharmaceutical corporation, in order to analyze CRM issues and to formalize recommendations for remedial plans.
3. Background Merck-Medco is a wholly owned subsidiary of Merck and Co. Inc. that specializes in prescription benefit management. Merck focuses on discovering breakthrough medicines and subsequently manufacturing, marketing and selling them. Merck-Medco dispenses medications produced by over 60 manufacturers on behalf of its clients. Merck-Medco clients include major employers, government agencies, health management organizations, and insurance providers. The employees or members of these organizations are provided with a prescription drug benefit that Merck-Medco manages on behalf of its clients. Currently, Merck-Medco represents over 60 million Americans through its various clients and fills over 500 million prescriptions per year. This benefit is utilized in two ways. First, Merck-Medco negotiates contracts with retail pharmacy chains to provide its clients prescription coverage at discounted costs. Members are provided with a prescription drug card that they present to the retail pharmacist along with their prescription. The retail pharmacist uses this card to access member-specific coverage information through a proprietary Merck-Medco online system. This system provides the pharmacist with information about the member’s drug history, co-pay and eligibility. After filling the medication for the member, the pharmacist uses the same system to process a claim to be reimbursed for the negotiated drug cost and administrative fee for dispensing the medication.
7
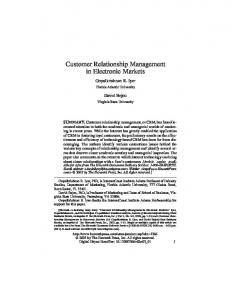
Members also have the option of using a home delivery pharmacy. Merck-Medco operates 12 home delivery pharmacies across the country. These pharmacies are divided into prescription processing centers and prescription dispensing centers. A member can submit a prescription through five different means: mail, fax, phone voice response system, Internet or by speaking with a customer service representative. Each client submits all of his or her prescriptions to the same prescription processing center. Depending upon the type of medication, the actual prescription could be dispensed through a different prescription dispensing center. Once a prescription processing center receives a prescription, it is responsible for entering all information necessary to prepare for dispensing. The process for accomplishing this varies based on whether the order is for a new prescription or a refill of an existing prescription. In the case of the refills, members are issued a bar-coded sticker that can be scanned to access all of the necessary information from the original prescription. A new prescription is more complex. All documents received through the mail are scanned into images that can be retrieved later for any purpose. In the case of new prescriptions, once the images are available, a pharmacist enters the information into the system on the right side of the screen while looking at the images on the left side of the screen. The order is then subjected to a series of administrative and professional edits. The administrative edits look for current eligibility, drug coverage information, account balance and address or personal profile information. The professional edits include drug utilization review that ensures they are not taking multiple drugs that interact with each other or an allergy that would be impacted by the drug. If there were any questions about what the doctor prescribed then a call would be made by a pharmacist. There are also edits that target specific medications that have lower cost but therapeutically equivalent alternatives. Pharmacists then call doctors to discuss switching the
8
medication to the alternative. This is primarily focused on saving the plan and customer money while maintaining the same therapeutic outcomes. There are also some disease management edits that concentrate on prescribing behaviors relative to specific disease states. These would also prompt a call to a doctor to discuss the appropriateness of the medication prescribed by the doctor. Once all of these edits are identified and resolved, the prescription is then ready to be dispensed (see figure 1). As mentioned earlier, the type of prescription dictates where it will actually be dispensed from. There are two automated pharmacies that dispense primarily pills, tablets and capsules. Therefore, a prescription that is capable of being dispensed through automation would be electronically transferred to one of these two pharmacies. If the prescription is a prepackaged item, refrigerated medication, a narcotic, a controlled substance, or a compounded medication, it is dispensed in any one of seven pharmacies across the country. The remaining three pharmacies are strictly prescription processing centers and do not dispense any medications. The following table outlines the locations and functions of each pharmacy in the United States: Prescription processing centers only Prescription dispensing centers only Prescription processing and dispensing Automated dispensing pharmacies
Spokane, WA, Irving, TX and Fairfield, OH Willingboro, NJ Las Vegas, NV, Columbus, OH, Pittsburgh, PA Harrisburg, PA, Wilmington, MA, Parsippany, NJ and Tampa, FL Las Vegas, NV and Willingboro, NJ
------------------------------------Insert Figure 1 about here -------------------------------------Integrated throughout the prescription processing and dispensing process are extensive customer service capabilities. All information relative to past prescriptions and prescriptions currently in process is accessible by a customer service representative (CSR) via another
9
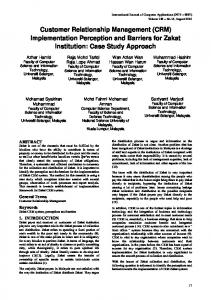
proprietary system. In addition, client plan design and personal profile information is also available within this system. With 60 million customers to support, customer service handles over 40 million calls per year through its network of six call centers. They are located in Tampa (Florida), Parsippany (New Jersey), Columbus (Ohio), Dublin (Ohio), Irving (Texas) and Las Vegas (Nevada). A complex set of systems and applications are used to schedule CSRs and balance call traffic to ensure the speed with which calls are answered meets the expectations of clients. Frequently, clients have service penalties associated with the average speed of answer so this is painstakingly managed to avoid any penalty. These six call centers have the ability to route telephone calls transparently to a customer. Any question can be answered by any CSR in any call center via the system. This allows customer service to balance call traffic based on staffing and demand in real time. Although the call centers and CSRs have integrated systems, they are not always capable of resolving a member’s issue via the system. In these cases, there is a follow-up system to address the member’s question or concern. A common example is when a member calls about the status of their order that is currently in process. If the member needs the medication earlier than when the system projects it will be dispensed, then a message is sent electronically to the dispensing pharmacy. Within each dispensing pharmacy is a team of CSRs who are staffed exclusively to follow up on member issues that the call center CSRs are unable to resolve. This team would work these electronic messages called queues. Each queue is defined based on its pharmacy location and the nature of the request. For instance, a member who had their medication dispensed from Tampa, FL and needs to have it replaced because it was lost in the mail would be queued to FLRPLC or Florida Replacement. There are 26 different queues that are
10
used by each dispensing pharmacy. If the specific nature of the request does not fit into one of the first 25 queues then the CSR would use the 26th queue, which is a general queue. Figure 2 shows a simplified customer service process. The majority of customer and client complaints are traced to the queuing process of Call Center CSR Enter Unresolved Issues into Queues (third box) and Dispensing Pharmacy CSR Resolve Queued Issues (fourth box) in Figure 2. ------------------------------------Insert Figure 2 about here --------------------------------------
4. Research Methods Measures of service quality have been developed by researchers in marketing [29, 30], information systems [45], and call centers [9]. These measures, however, are more general and do not relate to specific issues such as CSR and queuing process that are important components of the CRM system at Merck-Medco. Thus, we decided to start with a clean slate for identifying and prioritizing problems that caused customer dissatisfaction and were primary concerns of the management at Merck-Medco. The process started by conducting focus groups in two of the call centers and four of the pharmacies. Teams of six customer service representatives at each site were asked to brainstorm a list of scenarios and issues that cause member dissatisfaction relative to the queuing process. A team of managers, supervisors and CSRs in the Las Vegas site combined the lists and consolidated them. They primarily sought to eliminate redundancy. Once the consolidated list was complete, they sent the list out to all of the pharmacies and call centers asking them to add any items that were not already addressed in the list. Therefore, every site had input. The descriptions were then edited into the form of neutral problem statements.
11
The next step was to use a team of three CSRs from the call center and three CSRs from the pharmacy in NV, since they were co-located, to categorize the list. They reviewed the entire list and then brainstormed various categories. These categories were then narrowed to a list that the team felt would capture all of the individual statements. The statements were then assigned to each category through consensus discussion. Once every statement had been assigned a category, one more consolidation step took place to eliminate categories with only a few statements. The final list included 54 statements in five categories. The list was then formatted as a survey where a five-point scale from strongly agrees to strongly disagree was applied. A brief opening paragraph provided context for the survey participants. A pilot survey of 25 CSRs was completed to assess the time to take the survey and ensure there were no confusing statements. After completing the survey, the team of 25 was asked for input on the clarity of the survey itself. The consensus was that the survey form was fine and required no further modifications. The survey was then converted to both an online version and hard copy. The online version was administered to a sample of CSRs in the call centers via the system they had access to. Because the CSRs in the pharmacies used a different system, they were unable to complete the survey online. They therefore filled out the hard copy version. The current staff of 1500 CSRs in the call centers and the staff of 400 CSRs in the pharmacies completed a total of 1460 surveys – a 77% response rate.
5. Data Analysis There are two objectives in this data analysis. The first is to identify salient factors that affected CRM process at Merck-Medco. This would help the company develop an action plan for improving the process. An exploratory factor analysis is an appropriate tool to identify these
12
salient factors. The second objective is to develop a reliable and valid instrument that can be used to assess the effectiveness of the action plan. A confirmatory factor analysis is recommended to reinforce confidence in the instrument [7]. In order to accomplish both objectives, data were randomly split into two equal parts. The first half is used with exploratory factor analysis to determine the salient factors and produce a set of items that measure CRM process failure at Merck-Medco. The second half is used with confirmatory procedures to modify and finalize the factors and their measures produced based on the first part of data. Exploratory analysis First, as suggested by Churchill [11], the researchers purified the items (to eliminate ‘garbage items’). Two criteria were used to eliminate the items: corrected-item total correlation (each item’s correlation with the sum of the other items in its category) and reliability. The domain sampling model provides a rationale for corrected-item total correlation procedure. The key assumption in the domain sampling model is that all items, if they belong to the domain of the concept, have an equal amount of common core. If all the items in a measure are drawn from the domain of a single construct, responses to those items should be highly inter-correlated. After this, an exploratory factor analysis of the remaining items was conducted to identify items that were not factorially pure. Items that loaded on more than one factor at 0.50 or above were eliminated. This cut-off point is higher than what has been used by other researchers [15]. Exploratory factor analysis using principle components as extraction method with Varimax rotation was used to determine the number of factors. If the factor analysis would result in ambiguous structure or produce many items with multiple loadings, we reevaluated the corrected-item total correlation results and carefully examined close-call items. To the extent
13
possible, we also considered item content to make sure all items within a factor measured similar content. This was possible because the researchers were familiar with the nature of the problem through discussions with the staff at Merck-Medco. This was also necessary since we had developed the initial list of items based on practice rather than theory. Thus, an iterative process of using corrected item-total correlation and exploratory factor analysis was used to determine the number of factors. Reliability was calculated at each stage to make sure it remains higher than 0.80. The process started with 13 initial factors and resulted in 7 factors with 21 items shown in Table 1 and described in Table 2. Eigen values for the seven factors are greater than 1.0 and range from 5.374 to 1.002. All factor loadings are above 0.64, much higher than the commonly used threshold of 0.5. The seven factors accounted for 65% of variances. The seven factor solution was easily interpreted and labeled as standard operating procedure compliance (5 items), accountability and ownership (4 items), callback information content (3 items), customer contact process (3 items), billing issues (2 items), dispensing and replacement process (2 items) and queuing procedure (2 items). Managers and supervisors who closely collaborated with the researchers throughout the study could easily relate to these factors. These factors would be useful for Merck-Medco to make closer examination of their system and develop a useful remedial action plan.
Confirmatory analysis
------------------------------------Insert Table 1 about here -------------------------------------------------------------------------Insert Table 2 about here --------------------------------------
14
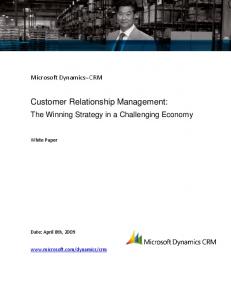
The results of exploratory factor analysis were encouraging and provided a theoretical basis to conduct confirmatory factor analysis. Figure 3 presents the confirmatory measurement model to be tested. The confirmatory factor analysis follows the measurement property assessment paradigm used in other studies [16, 37, 44] and was conducted using SIMPLIS in LISERL 8.3. The results are presented in Table 3. Since some items have low factor loading and the fit indices were less than satisfactory, further refinements were needed. ------------------------------------Insert Figure 3. about here -------------------------------------------------------------------------Insert Table 3. about here -------------------------------------Following Segars’ [37] procedure to refine and purify the measures, each factor with more than 3 items is tested separately to improve model fit first. This is done by examining modification indexes of each single factor measurement model and adding error correlations that were suggested. One error correlation is added to factor 1 since reading of the item suggests they could be correlated and no modification was necessary for factor two. These are the only two factors with more than three items. The next step is to test measurement models with pair of factors. In this process, items with cross loading were identified and eliminated. A total of 21 paired tests were conducted with only one item eliminated. The last step is to combine all seven factors into a single measurement model and test the model fit. This model included the reduced number of items and the error correlation identified earlier. At this stage, items with factor loading less than .45 [34] or cross loadings were eliminated one by one. Factors 5 and 7 ended up with only one item and therefore were removed from the model. The process resulted in a five-factor 13-item model shown in Figure 4. Table 4
15
presents the standardized parameter estimates, fit indices, and final item descriptions for this model. Compared to the initial model, the final model has much better model fit, as shown by the fit indices. This procedure establishes convergent validity and unidimensionality. ------------------------------------Insert Figure 4 about here -------------------------------------------------------------------------Insert Table 4 about here -------------------------------------The next step in confirmatory analysis is to examine discriminant validity and construct reliability. Discriminant validity can be established by comparing the model fit of an unconstrained model that estimates the correlation between a pair of factors and a constrained model that fixes the correlation between the factors to unity. Discriminant validity is demonstrated when the unconstrained model has a significantly better fit than the constrained model. The difference in model fit is evaluated by the chi-square difference between the models. A significance of the chi-square difference is a chi-square variate with one degree of freedom. Tests of all possible pairs for the five factors were conducted and the results are presented in Table 5. All chi-square differences are significant at .001 level, this supports discriminant validity. Construct reliability can be assessed using either a formula for composite reliability or average variance extracted [20, 37]. Those numbers are also presented in Table 5. All factors except dispensing and replacement process have acceptable composite reliability and average variance extracted. ------------------------------------Insert Table 5 about here --------------------------------------
6. Discussion
16
Organizations continuously rethink their processes in order to improve them by extending the boundaries of information technology application. Practitioners and academics alike have long accepted the delivery of quality service to customers as a success factor. Information technology has played an increasingly important role in the successful delivery of this service to the customer. This study illustrates the complexity of customer relationship management function and employee concerns regarding the processes involved. These issues are different from what existing service quality measures and studies address. Service quality studies address issues of customer (i.e., front end issues) while the current study addresses issues internal to the system and processes (i.e., back end issues). There are great expectations for what CRM can accomplish in terms of customer profile, product information, rapid response, predicting customer needs, retaining customers, conducting market research, promoting sale, and reducing cost. However, despite considerable organizational and executive commitments these expectations have not always been materialized. The perception of a widening gap between the potential of customer relationship management (that is, what it can ideally achieve) and its actual accomplishments has increased the need for better understanding of the nature of the problem and for better measures of factors that influence outcomes. This research was designed to address the perceived gap that exists between the potential of customer representative management and what it actually accomplished in a large U.S. pharmaceutical company. Although this research is company specific, we believe that our findings have relevance to other CRM environments (similar to [17, 27]). Because of the nature of the problem situation, the approach taken in this study includes a combination of qualitative and quantitative methods. Case study methodology was used to determine the scope and boundaries of the problem. Quantitative methods, especially
17
multivariate analysis, were used to more specifically identify influential factors within the determined scope. We feel that a combination of these two methodologies is quite appropriate for situations where there is no widely accepted theory base for study questions or where existing theories might not be appropriate for the practical problem at hand. In studying information technology failure, for example, Lyytinen and Hirschheim [25] argue that any analysis is an interpretive activity to understand the problem and to find solution. It is prudent to formulate study questions based on experience and careful case study approach rather than borrowing a well-established theory from other disciplines that poorly fits the problem. The company, Merck-Medco, greatly depends on CRM to interact with their customers. Doctors and patients in the company’s member plans send their prescriptions by mail, fax, phone, or through website. At automated pharmacies like the ones in Las Vegas, Nevada or Willingboro, New Jersey, 99% of the prescriptions are filled within 24 hours of receipt. Some of these pharmacies may fill more than 800,000 prescriptions per week [18]. Before a prescription is filled, potential drug interactions are automatically checked and issues are flagged and forwarded to a registered pharmacist for investigation and resolution. There are numerous other issues that customer service representatives use the system to respond to. For example, a member patient may request drugs to be sent to a different address while on holiday or may request a speedy delivery before travel. These messages are received at call centers and queued for action at pharmacies or packaging centers responsible for that particular package. For some time, the company has been experiencing problems with their CRM that result in complaints from customer representatives. This led to a close collaboration between the company and the researchers and influenced the design, implementation, and data collection for this study. The study involved broad participation that included senior executives, managers,
18
supervisors, and customer representatives. Customer representatives throughout the company showed interest in addressing CRM issues and streamlining customer query and response system. Participants from call centers throughout the organization were involved in different stages of they study including design and data gathering. More than 75% of system users responded to survey questions. The results of this study point to numerous processes that are either not followed or clearly understood by customer service representatives. Through exploratory factor analysis, this study specifically identifies issues that relate to standard operating procedure, accountability and ownership, call back information content, customer contact process, billing issues, and dispensing and replacement process. Collectively these issues have resulted in CRM failure in the company. Two factors (billing issues and queuing procedure) were dropped during the confirmatory factor analysis phase in order to improve measurement rigor. Below we describe each factor that has been identified as a barrier to CRM success in the company and will briefly address possible remedies. Although the shorter five-factor model is easier to use and supported by confirmatory analysis, the discussion will include the larger list of actors identified in the exploratory phase of the study to help the management of CRM at Merck-Medco. Standard operating procedure – Data analysis suggests that compliance with standard operating procedure explains current complaints more than any other factor. It includes wrongly sequenced queues, closing of incomplete files, forwarding incomplete electronic forms, and the like. This issue relates to employee behavior and may be addressed through training as well as improved description of procedures. However, training alone or improved description of procedure may not be adequate if non-compliance is widely spread and has become routine or if the system’s information product does not readily support compliance with standard operating procedure. The
19
current CRM system can be revamped, improved, or redesigned so that it will enforce much of standard operating procedure and make compliance a part of interaction with the system. Joshi and Rai [22] studied the influence of information product on work and suggest greater attention to the need for designing quality systems that not only meet primary information delivery objectives, but also take into account the task and organizational design issues for the user. Accountability and ownership – The issue of accountability is another readily identified factor that has created discontent among CRM users and customer service representatives. Under the current system, it is difficult to determine who is accountable for events such as filing customer contact forms without action, violating queue sequence for customer contact form, keeping commitments made to customers, and not verifying address prior to refill and shipping. This has created role ambiguity and role conflict with adverse effect on information product intended outcome [22]. The interaction between task needs and technology application has created a problem that cannot be addressed through defining responsibilities alone. Levels of responsibility and accountability need to be established and communicated and violations are readily identified. Information technology is expected to provide appropriate control to management for work process and quality performance [42]. Information content must be extended to include control for accountability. Call back information content – The third factor influencing CRM outcome at the company relates to the quality of information generated through the use of customer contact form. This information is unclear or even wrong and is used to generate customer queries and determine queues. This in turn influences queue procedure that is identified as another factor affecting customer representatives. Information technology is expected to empower the individual employee to provide accurate and timely response to customers. Information content plays a
20
critical role in employee satisfaction with information system [2, 10, 14]. Lack of employee confidence in information content has an adverse influence on system use [43]. The system needs to be revamped to more effectively and more easily control for information quality at data entry, data integration, and data manipulation level. Customer contact process – Information technology and CRM are expected to provide the mechanism through which long-term, individualized relationships with customers can be created and maintained. Massey, et al. [26] suggest that CRM centers on gaining a steady or increasing business from current customers, not necessarily a constant stream of new customers. To accomplish this, the company must ask what makes a specific customer unique and then tailor services in response to that uniqueness [28]. The current system fails to create an environment that helps sustain a steady business from customers. The customer contact form was designed to collect information on a single issue rather than multiple ones. As currently practiced, this form generates multiple issues and that in turn complicates routing of issues to appropriate pharmacies or packaging centers. The system should facilitate generation of separate forms for multiple issues and avoid providing the option of multiple issues on a single form. Billing questions – This factor illustrates ineffective integration of accounting function (e.g., accounts receivable) with CRM in the company. Customer service representatives are not familiar with how to respond to customer queries for billing; the system does not help them explain expenses to customers. Customer service representatives have difficulty interpreting accounting codes on the billing screen. The system needs to more fully integrate accounting function and help customer representatives respond accurately to billing questions. Lack of proper integration is suggested as one of the causes of failure in CRM [41].
21
Dispensing and replacement process – Since a number of pharmacies and packaging centers are involved in dispensing medicines to customers, it is important to link back recurring customer requests or changes to specific center or pharmacy designated to fill that prescription. Customer service representatives often have difficulty queuing a replacement request. The system does not automatically identify where a replacement request should be queued. The dispensing and replacement process is unclear to many customer representatives and the existence of ‘front end’ and ‘back end’ pharmacies makes it more difficult to know where to queue issues. The process needs to be streamlined and the system should be redesigned to assist customer representatives in managing dispensing as well as replacement requests. These issues may not have existed at the time the system was developed. Rapid growth and packaging and dispensing automation have further complicated the process. Queuing procedure – There seems to be a significant confusion over the queue system and how and where customer contact form should be queued. In the current system, queuing occurs because a customer service representative in a call center cannot systemically resolve the customers concerns online. There is a need for an environment that integrates all systems at the company and that will enable customer service representatives in call centers to resolve the vast majority of member needs without the need to queue anything. The system needs to be redesigned to eliminate the need for customer service representatives to memorize procedures for each pharmacy and generate standard form that is easily understood by all representatives and pharmacy people alike. These issues can be viewed under two broad categories of ‘people’ and ‘system’. This grouping facilitates generalization of the issues and determination of remedial actions. Table 6 summarizes our analysis of these issues relative to ‘people’ or ‘technology’. This breakdown is
22
similar to Bostrom’s [6] argument that each work system is made up of two interacting subsystems: the technical and the social. The technical subsystem relates to processes, tasks and technologies while social subsystem involves people attributes such as skills and attitudes as well as organizational attributes such as reward systems and authority structure. This model provides a useful framework that helps identify the interaction between two sets of influential variables. The interaction between system and people issues is evident in majority of the factors identified as causing dissatisfaction with CRM in this company. Further, these factors interact among themselves and sometime exasperate the situation. ------------------------------------Insert Table 6 about here -------------------------------------Finally, it is important to realize that while some of these issues are linked to employee and user behavior, many of them are inherent attributes of the system and existing processes. Over the course of the last few years, extensive training efforts have been aimed at addressing these issues at Merck-Medco with minimal effectiveness, suggesting that systems related issues are as problematic. Given the number and extent of issues and concerns and the potential impact that they have on the business, a complete redesign of the systems that customer service representatives use to access customer and prescription data may be necessary. In any redesign of the system, one of the key objectives must be to eliminate or minimize the number of issues that need to be queued. To accomplish this, the multiple systems that are not currently integrated need to be able to directly communicate with each other. An integrated system will enable a customer service representative in a call center to resolve member needs online without the need to queue. Results of this study further suggest a need to streamline processes used to service customers.
23
7. Conclusions This study identifies factors that affect the success of customer relationship management at a US pharmaceutical company, Merck-Medco. Through a close collaboration with the company, we generated a comprehensive list of potential issues, developed a survey, collected company wide data, and used multivariate methods to determine salient factors that caused problem in their CRM. Results of the exploratory factor analysis suggest seven factors (standard operating procedure compliance, accountability and ownership, callback information content, customer contact process, billing issues, dispensing and replacement process and queuing procedure) that describe CRM issues at Merck-Medco. A confirmatory analysis produced a fivefactor model measurement instrument. These measures are useful in assessing the results of remedial plans. These factors are summarized and discussed in organizational and technical contexts. More research is needed to better understand the interaction between the technical and organizational dimensions of technology application. This study used customer representatives as respondents. Future research should consider the use of actual customers for collecting data. This study also benefited from management involvement for data collection. Data collection using actual customers will eliminate that intervention and its possible influence.
24
References [1]
O.Z. Aksin and P.T. Harker, Modeling a phone center: Analysis of a multichannel, multiresource processor shared loss system, Management Science 47, 2001, pp. 324-336.
[2]
J.E. Bailey and S.W. Pearson, Development of a tool for measuring and analyzing computer user satisfaction, Management Science 29, 1983, pp. 530-545.
[3]
I. Benbasat and R.W. Zmud, Empirical research in information systems: The practice of relevance, MIS Quarterly 23, 1999, pp. 3-16.
[4]
L.L. Berry and A. Parasuraman, Marketing services: Competing through quality Free Press, New York, 1991.
[5]
M. Bitner, S.W. Brown and M.L. Meuter, Technology infusion in service encounters, Journal of the Academy of Marketing Science 28, 2000, pp. 138-150.
[6]
R.P. Bostrom, Conflict handling and power in the redesign process: A field study investigation of the relationship between management information system users and systems maintenance personnel, University of Minnesota, 1978.
[7]
M.-C. Boudreau, D. Gefen and D.W. Straub, Validation in Information Systems Research: A State-of-the-Art Assessment, MIS Quarterly 25, 2001, pp. 1-16.
[8]
J.W. Bowen and R.B. Hedges, Increasing service quality in retail banking, Journal of Retail Banking 15, 1993, pp. 21-28.
[9]
A. Burgers, K. de Ruyter, C. Keen and S. Streukens, Customer expectation dimensions of voice-to-voice service encounters: a scale-- development study, International Journal of Service Industry Management 11, 2000, pp. 142-161.
[10] M.M. Caldeira and J.M. Ward, Understanding the successful adoption and use of IS/IT in SMEs: An explanation from Portuguese manufacturing industries, Information Systems Journal 12, 2002, pp. 121-152. [11] G.A. Churchill, A paradigm for developing better measures of marketing constructs, Journal of Marketing Research 16, 1979, pp. 64-73. [12] J. Cross, M.J. Earl and J.L. Sampler, Transformation of the IT function at British Petroleum, MIS Quarterly 21, 1997, pp. 401-423. [13] A.M. Dean, Service quality in call centres: Implications for customer loyalty, Managing Service Quality 12, 2002, pp. 414-423. [14] W.J. Doll and G. Torkzadeh, The measurement of end-user computing satisfaction, MIS Quarterly 12, 1988, pp. 259-274. [15] W.J. Doll and G. Torkzadeh, Developing a multidimensional measure of system-use in an organizational context, Information & Management 33, 1998, pp. 171-185. [16] W.J. Doll, W. Xia and G. Torkzadeh, A confirmatory factor analysis of the end-user computing satisfaction instrument, MIS Quarterly 18, 1994, pp. 453-461. [17] P.A. Essex, S.R. Magal and d.E. Masteller, Determinants of information center success, Journal of Management Information Systems 15, 1998, pp. 95-117.
25
[18] H. Forcinio, What does pharmacy automation mean for packaging?, Pharmaceutical Technology , 2002, pp. 22-26. [19] D.L. Goodhue, B.H. Wixom and H.J. Watson, Realizing business benefits through CRM: Hitting the right target in the right way, MIS Quarterly Executive 1, 2002, pp. 79-94. [20] J.F.J. Hair, R.E. Anderson, R.L. Tatham and W.C. Black, Multivariate Data Analysis Prentice Hall, Upper Saddle River, NJ, 1998. [21] J. Harvey, E. Lefebvre and L. Lefebvre, Technology and the creation of value in services: A conceptual model, Technovation 13, 1993, pp. 481-495. [22] K. Joshi and A. Rai, Impact of the quality of information products on information system users'job satisfaction: An empirical investigation, Information Systems Journal 10, 2000, pp. 323-345. [23] P.K. Kannan, Introduction to the special issue: Decision support issues in customer relationship management and interactive marketing for e-commerce, Decision Support Systems 32, 2001, pp. 83-84. [24] H.C. Lucas and J. Baroudi, The role of information technology in organization design, Journal of Management Information Systems 10, 1994, pp. 9-23. [25] K. Lyytinen and R. Hirschheim, Information systems failures - A survey and classification of empirical literature, Oxford, UK, (4), 1987, pp. 257-309. [26] A.P. Massey, M.M. Montoya-Weiss and K. Holcom, Re-engineering the customer relationship: Leveraging knowledge assets at IBM, Decision Support Systems 32, 2001, pp. 155-170. [27] L.R. Matheson and R.E. Tarjan, Culturally induced information impactedness, Journal of Management Information Systems 15, 1998, [28] R.M. Morgan and S.D. Hunt, The commitment-trust theory of relationship marketing, Journal of Marketing 58, 1994, pp. 20-38. [29] A. Parasuraman, V.A. Zeithaml and L.L. Berry, SERVQUAL: A multiple-item scale for measuring consumer perceptions of service quality, Journal of Retailing 64, 1988, pp. 1240. [30] A. Parasuraman, V.A. Zeithaml and L.L. Berry, Alternative scales for measuring service quality: A comparative assessment based on psychometric and diagnostic criteria, Journal of Retailing 70, 1994, pp. 210-230. [31] J. Peppard, Customer relationship management (CRM) in financial services, European Management Journal 18, 2000, pp. 312-327. [32] M. Pontes and C.O. Kelly, The identification of inbound call center agents'competencies that are related to callers'repurchase intentions, Journal of Interactive Marketing 14, 2000, pp. 41-49. [33] B. Price, Making CRM come to life, E-Business Review , 2002, pp. 25-31. [34] B. Raghunathan, T.S. Raghunathan and Q. Tu, Dimensionality of the strategic grid framework: The construct and its measurement, Information Systems Research 10, 1999, pp. 343-355. 26
[35] D.K. Rigby, F.F. Reichheld and P. Schefter, Avoid the four perils of CRM, Harvard Business Review 80, 2002, pp. 101-109. [36] L.A. Schlesinger and L. Haskett, The service driven service company, Harvard Business Review , 1991, pp. 71-81. [37] A.H. Segars, Assessing the unidimensionality of measurement: A paradigm and illustration within the context of information systems research, Omega 25, 1997, pp. 107-121. [38] A.K. Smith and R.N. Bolton, An experimental investigation of customer reactions to service failure and recovery encounters, Journal of Service Research 1, 1999, pp. 65-81. [39] J. Stuller, Making call-center voices smile: A business case for better training, Training , 1999, pp. 26-32. [40] R. Subramanyam and M.S. Krishnan, Business value of IT-enabled call centers: An empirical analysis, Proceedings of the Twenty-Second International Conference on Information Systems, New Orleans, LA, 2001, pp. 55-64. [41] R.S. Swift, Excutive response: CRM is changing our eras, the information we require, and our processes, MIS Quarterly Executive 1, 2002, pp. 95-96. [42] G. Torkzadeh and W.J. Doll, The Development of a tool for measuring the perceived impact of information technology on work, Omega 27, 1999, pp. 327-339. [43] G. Torkzadeh and D.J. Dwyer, A path analytic study of determinants of information system usage, Omega 22, 1994, pp. 339-348. [44] G. Torkzadeh, X. Koufteros and K. Pflughoeft, Confirmatory factor analysis of a computer self-efficacy instrument, Structural Equation Modeling Journal 8, 2001, [45] T.P. Van Dyke, L.A. Kappelman and V.R. Prybutok, Measuring information systems service quality: Concerns on the use of the SERVQUAL questionnaire, MIS Quarterly 21, 1997, pp. 195-208. [46] N. Woodcock and M. Starkey, I wouldn' t start from here: Finding a way to CRM projects, Journal of Database Marketing 9, 2001, pp. 61-74. [47] L. Yu, Successful customer-relationship management, Sloan Management Review , 2001, pp. 18-19.
27
Table 1. Factor structure Items
Factor 1
F1-1 F1-2 F1-3 F1-4 F1-5
.702 .772 .770 .812 .649
F2-1 F2-2 F2-3 F2-4
Factor 2
Factor 3
Factor 4
Factor 5
Factor 6
.754 .814 .818 .707
F3-1 F3-2 F3-3
.647 .796 .722
F4-1 F4-2 F4-3
.695 .779 .681
F5-1 F5-2
.796 .815
F6-1 F6-2
.791 .807
F7-1 F7-2 Variance explained (Total) Eigenvalues Factor correlations Factor 2 Factor 3 Factor 4 Factor 5 Factor 6 Factor 7
Factor 7
.757 .681 15.22%
12.53%
8.51%
8.18%
7.14%
6.89%
5.374
1.839
1.753
1.442
1.194
1.035
.423** .429** .343** .110** .088* .386**
.292** .258** .176** .132** .158**
.244* .159** .211** .249**
.254** .096** .218**
.206** .172**
.142**
6.47% 64.95% 1.002
28
Table 2. Factors and items descriptions Factor 1: Standard operating procedure compliance F1-1 CCFs that are queued are not worked in a timely manner. F1-2 CCFs are closed without documented comments. F1-3 CCFs are returned via the FEED process with no resolution. F1-4 CCFs are closed with no action taken. F1-5 CCFs are closed with no resolution documented. Factor 2: Accountability and ownership F2-1 No one is accountable when a CCF is closed without any action. F2-2 There is no accountability in the queuing process. F2-3 No one is accountable when a CCF is mis-queued. F2-4 No one has ownership of a member' s issue. Factor 3: Callback information content F3-1 The system auto-populates wrong information on the CCF. F3-2 Cancel callback queues contain wrong reason codes for the cancellations. F3-3 Cancel callback queues contain unclear reason codes for the cancellations. Factor 4: Customer contact process F4-1 CCFs are created with incomplete or unclear information. F4-2 CCFs are routed to the wrong pharmacy. F4-3 CCFs are created which contain multiple issues. Factor 5: Billing issues F5-1 It is difficult to know how to handle members calls related to billing. F5-2 Member calls for billing explanations should be routed to A/R. Factor 6: Dispensing and replacement process F6-1 The pharmacy dispensing process is unclear to me. F6-2 The system is unclear as to where I should queue a replacement request. Factor 7: Queuing procedure F7-1 It is difficult to remember the control prescription procedures for each pharmacy. F7-2 CCFs need a standardized format for ease of queuing. Acronyms A/R: Accounts receivable CCF: Customer contact form FEED: electronic means to pass information between departments/sites
29
Table 3. Completely standardized parameter estimates and t-values Item Factor Loading (λ) Standard Error F1-1 .56 ---& F1-2 .71 .089 F1-3 .70 .088 F1 F1-4 .79 .091 F1-5 .74 .084 F2-1 .76 ---& F2-2 .83 .048 F2 F2-3 .76 .049 F2-4 .61 .047 F3-1 .44 ---& F3-2 .75 .14 F3 F3-3 .75 .16 F4-1 .67 ---& F4-2 .66 .089 F4 F4-3 .40 .068 F5-1 .63 ---& F5 F5-2 .58 .16 F6-1 .53 ---& F6 F6-2 .53 .18 F7-2 .61 ---& F7 F7-2 .41 .073 & Indicates a parameter fixed at 1.0 in the original solution.
Latent Variable
t-Value ---& 13.85 13.75 14.70 14.25 ---& 20.82 19.52 15.71 ---& 10.06 10.07 ---& 10.93 8.24 ---& 6.46 ---& 5.53 ---& 7.22
R-Square .32 .50 .49 .62 .55 .58 .69 .58 .38 .20 .56 .57 .45 .44 .16 .40 .34 .29 .29 .37 .17
Fit Indices: χ2=406.33, df=168, p=0.00000, χ2/df=2.42, RMSEA=0.044, p(RMSEA