398
Int. J. Web Engineering and Technology, Vol. 5, No. 4, 2009
Identifying web navigation behaviour and patterns automatically from clickstream data I-Hsien Ting* Department of Information Management, National University of Kaohsiung, No. 700 Kaohsiung University Road, 811, Kaohsiung City, Taiwan E-mail:
[email protected] *Corresponding author
Lillian Clark Department of Human Resource and Marketing Management, Portsmouth Business School, University of Portsmouth, Richmond Building, Portland Street, Portsmouth PO1 3DE, UK E-mail:
[email protected]
Chris Kimble Management Information Systems, Euromed Marseille Ecole de Management, Domaine de Luminy, BP 921, 13288, Marseille Cedex 9, France E-mail:
[email protected] Abstract: A user’s clickstream, such as that which is found in server-side logs, can be a rich source of data concerning the ways in which a user navigates a site, but the volume and level of detail found in these logs makes it difficult to identify and categorise specific navigational patterns. In this paper, we describe the three-step automatic pattern discovery (APD) method, a tool that utilises sequential mining to extract a user’s navigation route based on two levels of basic navigational elements. This paper contains descriptions of two studies in which the APD was used; the first makes use of APD to analyse the usage of an educational website; the second describes how APD was used to improve the design of a technical support website in a university department. Keywords: navigation behaviour; web usage mining; clickstream; sequential mining. Reference to this paper should be made as follows: Ting, I-H., Clark, L. and Kimble, C. (2009) ‘Identifying web navigation behaviour and patterns automatically from clickstream data’, Int. J. Web Engineering and Technology, Vol. 5, No. 4, pp.398–426. Biographical notes: I-Hsien Ting is an Assistant Professor in Department of Information Management, National University of Kaohsiung, Taiwan. He has received a PhD from the Department of Computer Science at the University of York, UK. His research interests are mainly focused on web intelligence, web data mining, digital games and artificial intelligence.
Copyright © 2009 Inderscience Enterprises Ltd.
Identifying web navigation behaviour and patterns
399
Lillian Clark has over 25 years experience within the IT industry in a variety of technical and marketing roles. Her research interests include online consumer behaviour, human-computing interaction, digital media marketing and e-Commerce. She is currently Course Leader for the MA Marketing Digital Media programme at the University of Portsmouth. Chris Kimble is an Associate Professor of Management Information Systems at Euromed Management in Marseille, France and is affiliated to the CREGOR Laboratory, Université Montpellier II, France. Before this, he lectured on information systems and management at the University of York (UK), Information Technology at the University of Newcastle (UK) and was a Researcher with both the Business School and the Computer Science department at the University of Northumbria (UK). His broad field of research is how to manage the fit between digital technologies and the social world.
1
Introduction
The analysis of clickstream data (e.g., server-side logs) can aid our understanding of users’ navigational behaviour by providing detailed information on the patterns generated as they navigate through a website. However, the analysis of clickstream data is not without problems. The size and nature of clickstream logs can make pattern detection difficult and classification time-consuming. Furthermore, the data that is present in the clickstream consists only of the data generated by the users of a particular website; the behaviour of users when they transfer to and return from external websites cannot be collected. Similarly, features such as server and browser caching mean that even the raw data that is stored on a server can be incomplete and will require further processing before it accurately represents the user’s clickstream. Finally, no matter how complete and accurate a clickstream might be, it can say nothing definitive about the reasons and motivations of the users that generate the clickstream (Clark et al., 2006). Nonetheless, a detailed knowledge of how users navigate their way through a site is important for a variety of reasons. It is needed for the development of web-based applications, especially when including features such as recommendations, advertising or personalisation (Mobasher et al., 2002); it is also critical for usability testing (Chi, 2002), performance evaluation and website redesign (Ivory and Hearst, 2001). In applications such as online learning environments, the identification of navigation strategies and patterns is important for understanding, helping instructors to improve the website design and students to get the best from e-learning. This article is one of a series of papers that looks at the application of knowledge discovery in database (KDD) to website design. In our previous work (Ting et al., 2004), we have described how the ‘Footstep’ graph can be used as a way to visualise users’ navigation patterns in clickstream data for subsequent identification and categorisation. We have also shown how certain types of patterns such as ‘stairs’, ‘mountain’ and ‘fingers’ can be used to represent a user’s navigational strategy for traversing a site. For example, in Clark et al. (2006) we demonstrated that the various patterns that reflect a user’s navigation strategy, such as scanning, navigation, searching, exploring and wandering (Canter et al., 1985), could be represented by combining stairs, mountain and fingers patterns. The next stage is to automate pattern detection and classification in order
400
I-H. Ting et al.
to be able to process large data files efficiently; it is this which forms the focus of the work described in this paper. The paper describes a methodology that we have termed the automatic pattern discovery (APD) method. APD is based on the concept of using sequential mining to analyse users’ navigational behaviour by detecting basic navigational elements and assembling them into sets of predefined patterns. APD provides sufficient flexibility to be able to define any desired set of patterns. This feature is particularly important when APD is used to improve certain aspects of a website’s design as it allows a designer to specify a preferred navigational path, or sequence of paths, and to detect how users deviate from these paths. The remainder of this paper is organised into six sections. Section 2 outlines some of the basic ideas behind web usage mining, pattern identification and the footstep graph. Section 3 describes the three-step APD process: pre-processing, route transformation and pattern discovery. In Section 4, the basic elements of users’ navigation behaviour and the algorithms for the pattern detection steps of the APD process are described. Sections 5 and 6 provide examples of the application of APD. Section 5 describes an example of the use of APD to track student’s use of an education website, while Section 6 describes how APD was used in the ‘support’ website of a university department to improve the design of the website. Finally, Section 7 presents some conclusions.
2
Web usage mining and pattern identification
2.1 Web usage mining Web usage mining is a research field that applies the techniques of data mining in order to analyse clickstream data. There are a number of well-known methodologies deployed in web usage mining, such as visualisation, classification and clustering, association rule mining, sequential and web traversal pattern mining, etc.
2.1.1 Visualisation techniques Visualisation techniques are a mechanism for the analysis and understanding of user browsing behaviour from clickstream data (Hong and Landay, 2001; Dwinnell, 2002). Through these techniques, the browsing patterns of users can be discovered more readily than by merely looking at the clickstream data directly. The most basic way to visualise the clickstream is by using a spanning tree technique, in which the clickstream data for an individual user is converted into a browsing map (tree-like graph), which is sometimes called a ‘footstep map’. Navigation visualiser (Herder and Weinreich, 2005), Graphviz (Yang et al., 2006) and history graph (Hirsch et al., 1997) are all examples of techniques based on this kind of visualisation. In Ting et al. (2004) we introduced the ‘footstep’ graph, a visualisation tool for identifying users’ navigation patterns. The footstep graph is based on a simple x-y plot where the x-axis represents time (in seconds) and the distance between points indicates the time between two nodes (pages visited). The y-axis represents the nodes on the user’s navigation route and the changes in the vertical axis indicate a transition from one node to another. The footstep graph not only indicates the time-trends of a user’s navigation history but also illustrates the relationship between each navigation node, transforming
Identifying web navigation behaviour and patterns
401
complex and unorganised clickstream data into a form more suitable for understanding and interpretation. An example of a basic footstep graph is shown in Figure 2.
2.1.2 Clustering and classification Classification algorithms are used to organise users into different categories according to their browsing behaviour, and interesting classification rules can be derived from these results. For example, a classification algorithm can organise users according to their browsing time, from which rules such as “30% of users browse product/food during the hours 8:00–10:00 PM” can be developed (Srivastava et al., 2000). Clustering is used to group together a set of items (web pages) having similar characteristics. In web usage mining, clustering algorithms can be used to discover usage clusters, which in turn are used to group together users with similar browsing behaviour. These two web usage mining techniques, classification and clustering, are very similar in nature and are commonly used for grouping like items together. For navigational behaviour analysis, these techniques can be used to group similar browsing paths into a class or cluster, and they also can be used to cluster or classify the web pages that have often been visited together (Velasquez et al., 2003). For example, a clustering based PageGather algorithm has been proposed by Perkowitz and Etzioni (2000), which can be used to cluster co-occurrence and high similarity web pages.
2.1.3 Association rule mining The association rule mining technique is used to indicate those pages that are most often referenced together and to discover the direct or indirect relationships between web pages (Tan and Kumar, 2002; Ceglar and Roddic, 2006; Pierrakos et al., 2003). For example, an association rule would take the form ‘the people who view web page index.htm and also view product.htm’. Association rule mining is a useful web usage mining technique that can help to analyse user browsing behaviour in order to discover the relationship between browsed pages. Furthermore, the two measurements support and confidence are available to measure the relevance of the association rules.
2.1.4 Sequential and web traversal mining A sequential pattern is one web page browsed after another, or one set of web pages browsed after another set. For instance, a sequential pattern could be expressed as “30 % of users exhibit browsing behaviour that follows the sequential pattern web page A, web page B, then web page C”. Similarity measurement of sequences is essential for discovering sequential patterns, and some basic concepts about similarity, such as subsequences, common subsequences and longest subsequences, are necessary. A sequence Z is called a subsequence of sequence X, if all the elements of Z occur in X in the same order. Thus if X = {a, b, c, d, e, f, g} then Z = {b, d, e} is a subsequence of X. Given two sequences X and Y, if Z is a subsequence of both X and Y, we say that Z is a common subsequence of X and Y. For example, if X = {a, b, c, d, e, f, g} and Y = {b, d, e, h, i} then all the common subsequences (CS) of X and Y are {b},{d},{e}, {b, d},{d, e},{b, e},{b, d, e}. Generally, such intersections between sequences are found by using a dynamic programming algorithm (Banerjee and Ghosh, 2001). One of the
402
I-H. Ting et al.
most interesting applications of this is the identification of large subsequences, in particular the longest common subsequence (LCS). In the example above, the LCS is {b, d, e} (Chen et al., 2003). Website traversal mining is a technique that applies the concept of sequential mining to analysis of clickstream data in order to model user navigational behaviour (Chen et al., 1998). Currently, there are two major website traversal patterns for modelling the navigation behaviours and interests of users: frequent traversal pattern (El-Sayed et al., 2004) and co-occurrence pattern. Frequent traversal pattern is a case of association rule mining with a set of items (non-empty) in sequence (or time) order. Like the concept of LCS discussed above, the longest frequent traversal pattern is often the most interesting one. Co-occurrence pattern is a type of website traversal pattern in which a starting or ending node is fixed into a traversal path to find the most frequently occurring pattern (Kothari et al., 2003).
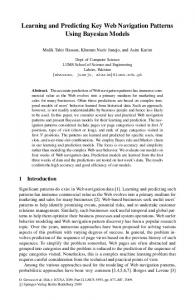
2.2 Why do we need to identify patterns? 2.2.1 An experiment for understanding web navigation behaviour In order to understand navigation behaviour of web users, we initially arranged an experiment as part of our previous research (Ting et al., 2004), based on the ‘think-aloud’ research method, as shown in Figure 1. The initial experiment was conducted on the client-side where a full and complete set of data could be collected. Our intention was that once an interesting pattern had been discovered on the client side, it would later be matched to patterns discovered in server-side clickstream data to identify and confirm the pattern. Figure 1 A conceptual model of our methodology
Client Side Think-Aloud
Server Side Client Side Logging Log File
Video Audio
Log file
User Interesting Pattern
Server Side
Interesting Pattern
Server Side
Log file
Log file
Interesting Pattern
Interesting Pattern
Identifying web navigation behaviour and patterns
403
The clickstream from the experiment was logged directly in a log file using a client-side logging agent. The user’s thoughts, reactions and intentions were recorded on audio and video. The client-side logging agent recorded all requests directly, without caching, and the user was asked to ‘think aloud’ while they browsed the site so that their experience of the site could be captured. Thus, the complete pattern of the user’s requests in the client-side clickstream data could be linked to a record of the user’s expressed thoughts and behaviour while they browsed the site. Using this approach, we were able to identify patterns of browsing behaviour that could be linked directly to the user’s experiences at the time that the pattern occurred. We then designed an experiment based on the above methodology that analysed user browsing behaviour when presented with a series of predefined tasks to be completed on a number of selected websites. Four online bookshops and six participants were selected and four tasks designed to be repeated at each site. A large number of online bookshops were surveyed to find sites with identifiable weaknesses and a series of tasks were designed to highlight those weaknesses. The four bookshops were Blackwell’s (http://www.blackwell.co.uk), Aaron’s (http://www.aarons-books.co.uk), Amazon (http://www.amazon.co.uk) and John Smith & Son (http://www.johnsmith.co.uk). The four tasks in the experiment and the objectives of each task are listed in Table 1. Table 1
The four tasks
Number
The description of the task
The objective of the task
Task 1
Find the book Harry Potter and the Chamber of Secrets and put it in the basket.
To test the basic function for finding a book in the website.
Task 2
Browse the catalogue and find a computer programming book that is suitable for a beginner and put it in the basket. Do not use search function.
To test the catalogue functions by finding a book about a particular subject.
Task 3
Find a third book that is related to the first book and put it in the basket.
To test the recommendations ability of the website.
Task 4
Find information about refund and return policy for the books you bought.
To test the ease of access to basic information.
The experience of the participants in the experiments was captured using the ‘think-aloud’ method and the clickstream data was logged to a client-side log file. The collected clickstream data were then processed and used to identify participants’ browsing patterns via the footstep graph and connected with their experiences to identify the meaning of these patterns. From this experiment, we found certain frequently occurring patterns that were illustrative of user navigation behaviour. A
Stairs patterns
The stairs pattern is created when the user moves forward through previously unvisited pages in the website and the downstairs pattern is produced when the user moves back through pages they have visited before. An example of a stairs pattern is shown in Figure 3(a). These patterns are similar to Canter’s ‘path’ pattern, which indicates that the user is exploring the website (Canter et al., 1985). According to the audio/video data, participants felt they moved smoothly through the website to accomplish their tasks. There were however, two problems identified when
404
I-H. Ting et al.
participants used a stairs pattern. The first problem was when there were many stairs in the stairs pattern, as more stairs could mean that the user needed to complete more steps to accomplish the task, in turn suggesting that the structure of the website was too complex for the task. The second problem was when the time between two nodes was long, which could mean that the user had to look through a lot of information on the page before being able to move on the next page. B
Mountain pattern
The mountain pattern, where a downstairs pattern is immediately followed by an upstairs one, is found when the user moves through several pages in order to reach or return from a specific page. An example of a mountain pattern is shown in Figure 3(b). This pattern is equivalent to Canter’s ‘loop’ pattern, which indicates that the user is searching the site for a specific target (Canter et al., 1985). In our experiment, participants often spent a long time browsing but returned to the original web page without completing the task. However, in a real-world situation this pattern could occur when a user returns to the original web page in order to start a new task. C
Fingers pattern
The fingers pattern is found when the user moves directly from one page within the site to another and then directly returns to the original page. An example of a fingers pattern is shown in Figure 3(c). This pattern is equivalent to Canter’s ‘spike’ pattern and indicates that the user may have fallen into a navigation loop (Canter et al., 1985). One of the reasons for an occurrence of a fingers pattern is when a website does not consistently display commonly related links in some pages, causing the user to back up to an earlier page in order to find the link to the page they want to go to. However, the fingers pattern does not necessarily mean that there is a potential problem with the website, as it could indicate a conscious design choice by the website designer to drive users on specific paths through the site, or could simply result from a specific user’s browsing habits. From the above experiment, we learned that there is a very strong relationship between navigational behaviour and the patterns identified in the footstep graph. By identifying these patterns from the clickstream data, we can develop our understanding of the user’s navigational experience and behaviour and apply this understanding to website redesign and improvement. Figure 2 A sample footstep graph (see online version for colours)
Identifying web navigation behaviour and patterns
405
Figure 3 (a) An example of a stairs pattern (b) an example of a mountain pattern (c) an example of a fingers pattern (see online version for colours)
(a)
(b)
(c)
2.3 Why is the APD necessary? In analysing clickstream data, we face the challenge of identifying and categorising patterns from the large number of user sessions typically generated by a busy website. Clark et al. (2006) discovered that even when visualisation tools such as footstep graphs are used, manual classification of the patterns generated could be time-consuming and prone to error. Therefore, a methodology is needed that cannot only process large volumes of clickstream data but can also automatically identify the large number of user session patterns that may exist.
2.4 Current APD methodology Frequent website traversal pattern mining techniques are useful for modelling the browsing behaviours of users. Such techniques are widely used for predicting the browsing paths of users (Mobasher et al., 2002), and essential for the applications of adaptive websites and personalisation (Perkowitz and Etzioni, 2000). However, discovering potential website design problems is a key point for website design improvement. It is not easy to find potential website design problems when just using current website traversal patterns or co-occurrence patterns mining. Take a site where there is a discovered frequent website traversal pattern {AÆBÆCÆD} and the frequency is 20. This pattern and the related frequency
406
I-H. Ting et al.
measurement can be useful for predicting user browsing paths, linking recommendations, etc. However, it is not easy to find potential website design problems using this information. Even if the path is the most frequently occurring traversal path, there is no clue to identify the efficiency of such a path. In order to identify potential website design problems, more measurement and detailed analysis of the frequent traversal pattern is necessary. Currently, many researchers are focusing on how to discover user navigation patterns automatically. Most of this research is based on the ‘forward’ (unsupervised) method of analysing navigational behaviour, using such popular and traditional data mining techniques as association rule mining and clustering and sequential mining (Yen and Lee, 2003; Ezeife and Lu, 2005). While these approaches easily generate patterns, they do not provide interpretations of the patterns found. Some researchers try to provide interpretations for these patterns (Berendt and Spiliopoulou, 2000; Xing and Shen, 2004), while some others do not (Yen and Lee, 2003; Ezeife and Lu, 2005). Visualisation is another approach to discovering user navigation patterns (Chi, 2002; Eick, 2002). The advantage of visualisation is that the patterns found can be readily distinguished by human eyes and interpreted, however visualisation was not originally intended to be used for automatic pattern detection. In cases where it is necessary for us to transform visualised patterns to a database for analysis, pattern identification becomes a difficult and time-consuming task. ScentTrails is another methodology to model the browsing and searching behaviour of users, it highlights hyperlinks to indicate path to search results. This visualisation enables users to browse smoothly between searching and browsing. However, this technique is focusing client-side assistant to the browsing but not focusing on how to analyse server-side clickstream data (Chi et al., 2007; Olston and Chi, 2003). Siochi and Hix (1997) also developed an interface evaluation using maximal repeating pattern analysis, but the technique was still developed based on client-side analysis as well as the system LeNDI that proposed by El-Ramly et al. (2001). Lartillot (2005) developed a methodology to discover musical patterns by focusing on two parametric dimensions, melodic and rhythmic. By applying a pattern matching method, he was able to automatically identify and explain the various patterns found. In this paper, we propose an approach that is based on backward (supervised) pattern discovery plus Lartillot’s concepts, in order to identify and explain user navigational patterns from clickstream data. Our approach utilises footstep graph visualisation for pattern definition along with a tool for APD.
3
Automatic pattern discovery (APD)
The complete APD process contains three main steps: clickstream data pre-processing, navigation route transformation and APD. In turn, the APD step contains three further sub-steps: navigation route segmentation, pattern definition and pattern detection. Figure 4 shows the whole APD process; the individual steps are discussed in detail below.
Identifying web navigation behaviour and patterns Figure 4 The APD process (see online version for colours)
407
408
I-H. Ting et al.
3.1 Clickstream data pre-processing Clickstream data pre-processing is a necessary step not only for APD but also for any web usage mining technology. A standard data pre-processing procedure has been well developed in current web usage mining research (Cooley et al., 1999a). In general, the clickstream data pre-processing procedure should include the following steps: data cleaning, user identification, session identification, ‘bot’ detection and data formatting. In the data cleaning step, the noise and unnecessary records that are contained in the raw clickstream data are removed. Due to the characteristics of server side logging and HTTP protocol, the data and files embedded in a web page require separate requests to the web server, and all of these requests are recorded in the clickstream data. However, these embedded files are not the main focus of web usage mining. Therefore, a clickstream record can be removed if the filename extension of the requested URL is an image file (such as gif, jpg, etc.), an audio file, a video file, a script file or a template file (Cooley et al., 1999b). In addition, if the status code in clickstream data refers to a web server error response, then the record can also be removed. Finally, certain symbols in clickstream data are treated as noise and are removed. In the user identification step, it is accepted practice to use the IP address information as an indicator for identifying the user, as it is the simplest means of such identification. However, if different users browse a website though the same proxy server the same IP address will be recorded in clickstream data for these users. To overcome this limitation, Cooley et al. (1999a) propose a heuristic method using more indicators, such as user’s browsing agent and user’s operation system. However, this method still can not uniquely identify the user as different users with the same proxy server may also be using the same browser and the same operation system. In these circumstances, using cookie data to identify the user is a suitable work-around as each user has a unique ID number in their cookie data (Pabarskaite and Raudys, 2007; Han and Kamber, 2001). A bot (also known as robot, crawler or spider) is software that can traverse a website automatically. In recent years, the bot technique has been widely used by many search engines and web agents (In our research, more than 70% of the clickstream records were generated by bots). There are many different applications for bots, such as collecting web pages for storing in a search engine’s database, offline browsing, checking links, etc. However, these applications are not relevant for browsing behaviour analysis, as they do not represent ‘real’ users. Generally, clickstream data generated by bots can be cleaned according to a known bot list or the bot’s behaviour (Tan and Kumar, 2002). The simplest way to detect and clean the bots is by maintaining a bot list. The bot list can be maintained from sources in which bot names or IP addresses are registered in their databases or detected by parsing user agents’ information in the clickstream data. However, it is not enough to detect bot access using a bots list, as many bots are still unregistered or not well-behaved. Therefore, a heuristic method of bot detection is used, incorporating both the bots list and the characteristics of bot request behaviour in clickstream data. Some clickstream data may be lost due to caching, such as web page caching when using the ‘back’ function provided by a browser, or proxy server caching when a user browses the internet through a proxy server. The browser will not send requests to the website server when using the ‘back’ function, and consequently the user’s backward browsing behaviour will not be recorded in server side clickstream data. However, the user’s backward browsing is important information for web usage mining, and this kind
Identifying web navigation behaviour and patterns
409
of missing data will affect the quality of pattern discovery. Figure 5 shows an example of backward browsing behaviour, in which the user browses page 1, then page 2, then selects the back button provided by the browser to go back to page 1, then browses page 3 via page 1. Figure 5 An example of backward browsing behaviour (see online version for colours)
1
2
Back
1
3
As shown in Table 2, this browsing behaviour as recorded in client side clickstream data would be page 1Æpage 2Æpage 1Æpage 3. However, the same behaviour recorded in server side clickstream data would be page 1Æpage 2Æpage 3. Table 2
The backward browsing behaviour in server and client side clickstream data
Server side clickstream data
Client side clickstream data
Page1.htm
Page1.htm
Page2.htm
Page2.htm
Page3.htm
Page1.htm Page3.htm
As back button usage is very important for understanding browsing behaviour and essential for identifying potential website design problems, it is therefore necessary to restore the ‘lost’ clickstream data in the pre-processing step before performing any web usage mining technique in order to get results that are more accurate. To address this issue, we developed the pattern restore method (PRM) algorithm (Ting et al., 2005). The PRM algorithm uses information on the structure of the website together with information on the referrer to restore lost data, along.
3.2 Users’ navigation route transformation In order to discover a user’s navigational pattern the navigation route must first be transformed to a number-based sequence so that the order of the sequence can be measured. For example, a user’s navigation route (pre-processed clickstream data) is shown in Table 3. After its transformation, a number-based sequence emerges as shown in Table 4. In this case, the sequence starts from zero and the increasing order of the sequence is ten. The transformation algorithm will search each node in the user’s navigation route and assign each one a sequence number. In addition, the algorithm will also check whether each node has occurred before in the user’s navigational route. If so, the algorithm will assign the same sequence number to the same nodes (e.g., the node No. 3 /support/index.php has already occurred in the user’s navigational route and has a sequence number ‘0’, so the sequence number for the node No. 3 is also ‘0’) After the user’s navigational route has been transformed to a number-based sequence, the order of the sequence can be used to detect the basic navigation elements in order to
410
I-H. Ting et al.
develop the user’s navigation pattern. The basic navigation elements are discussed in Section 4.1 of this paper. Table 3
A sample user navigation route
No.
Date and time
Accessed URL
1
15/06/2005,02:24:16
/support/index.php
2
15/06/2005,02:25:18
/support/contact.php
3
15/06/2005,02:26:20
/support/index.php
4
15/06/2005,02:27:22
/support/who.php
5
15/06/2005,02:28:25
/support/index.php
6
15/06/2005,02:29:16
/support/query.php
7
15/06/2005,02:29:30
/support/index.php
8
15/06/2005,02:29:45
/support/priority.php
9
15/06/2005,02:30:05
/support/index.php
Table 4
A number-based sequence and time duration after the navigation route transformation
Number-based sequence
Time duration
Accessed URL
0
0
/support/index.php
10
62
/support/contact.php
0
62
/support/index.php
20
62
/support/who.php
0
63
/support/index.php
30
51
/support/query.php
0
14
/support/index.php
40
15
/support/priority.php
0
20
/support/index.php
3.3 Automatic pattern discovery (APD) In web usage mining, the sequential pattern is defined as one web page browsed after another, or one set of web pages browsed after another set. For instance, a sequential pattern could be expressed as “30 % of user browsing behaviour follows the sequential pattern web page A, web page B, then web page C”. In sequential mining, the focus is always on the segmentation or transformation method of the sequence (Agrawal and Srikant, 1995), as a good sequence segmentation method can help the sequential mining algorithm to generate better analysis results (Zhou et al., 2004). In the APD, the segmentation method is more straightforward than other sequential mining methods. As the APD methodology compares the sequence order of each node in the users’ navigation route and the relationship between every two nodes (a length-2 sliding-window pattern matching method), the segmentation method used by the APD is to divide each node of a user’s navigational route into individual elements. For example, a user’s navigational route A = {0Æ10Æ20Æ30Æ40Æ50} (the arrow symbol in A means from one node to another node) will be divided to A’ = {0, 10, 20, 30, 40, 50}, and a segmented route will never look like
Identifying web navigation behaviour and patterns
411
A2’ = {0, 10, 20Æ30, 40Æ50}, because the consecutive nodes (a navigational route containing sequence information between nodes) are not allowed in a user’s navigational route after segmentation. The segmented users’ navigation route can then be used for the pattern detection step.
4
Basic users’ navigation elements, pattern detection and pattern definition
In this section, the sub-steps of pattern detection and pattern definition in the APD methodology are introduced. However, before we can examine the detail of the APD methodology the underlying idea behind the basic navigational elements must be discussed.
4.1 Basic navigation elements The APD extracts a user’s navigational routes based on two levels of basic navigational elements. Level-1 elements consist of same, up, and down elements; level-2 elements combine selected elements of level-1 into peak and trough elements. These two levels of basic navigational elements are described in detail below.
4.1.1 Level-1 elements The segmented user navigation route is transformed to basic level-1 elements by comparing the relationship between every two nodes. These elements are known as ‘same’, ‘up’ and ‘down’. A
Same
A ‘same’ element occurs when the user consecutively browses the same web pages by either refreshing a page, opening the same page in a different window/tab or other similar activity. If there are two nodes in the user’s navigation route {Ai, Ai + 1} and Ai = Ai + 1 (e.g., {20, 20}) then the relationship between these two pages will be assigned the level-1 element ‘same’. Figure 6 presents an example of a same element in a footstep graph. B
Up
An ‘up’ element occurs when the user has moved through the website by using forward navigation behaviour, i.e., moving from one web page to another web page they have not yet visited during the session. For example, if there are two nodes {Ai, Ai + 1} in a user’s navigation route and Ai < Ai + 1 (e.g., {20, 30}), then the relationship between these two pages will be assigned the level-1 element ‘up’. Figure 7 presents an example of up elements in a footstep graph. C
Down
A ‘down’ element occurs when the user has moved through a website by using backward navigation to one they have visited before, causing the order of the sequence to be lower. If there are two navigational nodes {Ai, Ai + 1} in a user’s navigational route and Ai > Ai + 1 (e.g., {20, 10}), then the relationship between these two pages will be
412
I-H. Ting et al.
assigned the level-1 element ‘down’. Figure 8 shows an example of a down element in a footstep graph. Figure 6 An example of the same element (see online version for colours)
Figure 7 An example of the up element (see online version for colours)
Figure 8 An example of the down element (see online version for colours)
After transformation of a segmented user navigation route to a level-1 based navigation route, the route should only consists of level-1 elements: up, down or same. For example, for a navigation route A = {0, 0, 10, 20, 10, 0, 10, 0} the user’s level-1 based navigation route would be A’ = {same, up, up, down, down, up, down}.
Identifying web navigation behaviour and patterns
413
4.1.2 Level-2 elements The next level of navigational elements, level-2 elements, is based on measuring the relationship between each contiguous element of the user navigation route to discover changes in navigational directions or turning points. These level-2 elements, peak and trough, are used to define these turning points. A
Peak
A ‘peak’ occurs when the navigation direction shifts from a forward to a backwards direction. For example if there are two nodes {Bi, Bi + 1} in a navigational route, and Bi = up and Bi + 1 = down (e.g., {up, down}) then the relationship between these two nodes will be assigned the level-2 element peak. B
Trough
A ‘trough’ occurs when the navigation direction shifts from backwards to forwards. For example if there are two nodes {Bi, Bi + 1} in a navigational route, and Bi = down and Bi + 1 = up (e.g., {down, up}) then the relationship between these two nodes will be assigned the level-2 element trough. Figure 9 presents an example of both peak and trough elements in a footstep graph. Figure 9 An example of the peak and the trough elements (see online version for colours)
After a user’s navigational route has been converted to the basic navigation elements, the route should consist of the elements same, up, and down and the elements peak and trough. For example a level-1 navigation route of A = {same, up, up, down, down, up, down}, becomes the level-2 based route of A’ = {same, up, peak, trough, peak, down} which in turn becomes the navigational route used for subsequent pattern detection.
4.2 Pattern detection and pattern definition 4.2.1 Level-1 and level-2 element detection The pattern detection step of the APD methodology sequentially processes the raw user navigation route based on the concept of level-1 and level-2 elements. The algorithms for level-1 and level-2 navigation route transformations are shown in Figures 10 and 11 respectively.
414
I-H. Ting et al.
Figure 10 The algorithm of level-1 based navigation route transformation Starting algorithm level-1 elements detection: For each raw users’ navigation node Ai If Ai ≠ last node of users’ navigation route then If Ai < Ai+1 then Level-1 elements Bj = ‘up’ (j = 0…n) Else if Ai > Ai+1 then Level-1 elements Bj = ‘down’ Else if Ai = Ai+1 then Level-1 elements Bj = ‘same’ End if End if Next j Next Figure 11 The algorithm of level-2 based navigation route transformation
Starting algorithm level-2 elements detection: For each level-1 users’ navigation node Cp If Cp ≠ last node of users’ navigation route then If Cp = ‘Up’ and Cp+1 = ‘down’ then Level-2 elements Dq = ‘peak’ (q = 0…m) Else if Cp = ‘Down’ and Cp+1 = ‘up’ then Level-2 elements Dq = ‘trough’ Else if Dq = Cp End if End if Next q Next
4.2.2 Pattern definition Before pattern detection, it is essential for the website designer (or some other relevant stakeholder) to define what patterns are of interest. However, the way in which the user’s navigation patterns are defined may vary. For example, some stakeholders may define a mountain pattern as being {up, peak, down, trough, up} rather than simply {up, peak, down}, or maintain that a fingers pattern should contain at least two fingers {trough, peak, trough, peak, trough} rather than one finger only {trough, peak, trough}. The pattern definition must therefore be flexible as there is no standard definition for any one pattern. In Section 5.1, a case study will be discussed to show how user’s navigation patterns were identified based on a particular set of stakeholder definitions.
Identifying web navigation behaviour and patterns
415
4.2.3 Pattern detection Once elements have been detected and desirable patterns defined, the pattern detection step can detect these patterns automatically by matching the navigation routes and the pattern rules according to the pattern detection algorithm. The algorithm for pattern detection is shown in Figure 12. Figure 12 The algorithm for pattern detection Starting algorithm pattern detection: For each defined pattern Gi = [E0,…, Ej] (i = 0…n) For each level-2 elements Dq (q = 0…m) in level-2 users’ navigation route If [Dq,…,Dq + m] = [E0,…,Ei] then [Dq,…,Dq+m] = Gi End if Next Next
4.3 Combining patterns While the stairs, mountain and finger patterns help us identify particular components of navigation behaviour, certain types of user behaviour are manifested by various combinations of these patterns. For example, Canter et al. (1985) identifies sessions that contain a mix of basic patterns as ‘exploring’ behaviour, so in order to identify such behaviour we may need to look for sessions containing complex combinations of stairs, mountain and fingers patterns rather than any one specific pattern. By using the APD, we can define and detect the complex patterns, or indeed any combination of the basic patterns described above.
5
An example of pattern definition and discovery
In this section, we briefly discuss a case study in which the APD was used to discover navigation patterns automatically. In this example, we collected clickstream data from an educational teaching website (http://www-users.cs.york.ac.uk/~kimble/teaching/mis/ mis.html). The case study is described in detail in Clark et al. (2006).
5.1 An examples of pattern definition As discussed in Section 4.2, a definition of the relevant pattern rules is essential for using the APD. For this particular case study, the rules for upstairs, downstairs, mountain, and fingers patterns, based on the level-2 based navigation routes, were defined as follows: A
The mountain pattern
If there are consecutive elements {up, peak, trough}, {up, peak, down}, {trough, peak, down}, {up, peak}, and {peak, down} in the level-2 based navigation route, then they should be recognised as a mountain pattern.
416 B
I-H. Ting et al. The fingers pattern
If there are consecutive elements {peak, trough}, in the level-2 based navigation route, then they should be recognised as a fingers pattern. All remaining {peak} elements in the level-2 based navigation route should be recognised as a fingers pattern. C
The downstairs pattern
All remaining {down} elements in the level-2 based navigation route should be recognised as a downstairs pattern. D
The upstairs pattern
All remaining {up} elements in the level-2 based navigation route should be recognised as an upstairs pattern.
5.2 Pattern discovery After the pattern rules were defined, the APD method was used to process and analyse the clickstream data from the website. We used the standard data pre-processing procedure, including a PRM (Ting et al., 2005), to pre-process the raw clickstream data. Then the pre-processed clickstream data was transformed to number-based sequence and each navigation route (session) in the clickstream data was segmented based on the segmentation method of the APD. A sample of the results of this processing is shown in Table 5. Table 5
Segmented navigation routes after transformation
Session number 1 2
0, 1, 2 0, 1, 2, 1, 2
Number-based sequence
6
0, 0, 1, 0, 2, 0, 3, 0, 4, 0, 5, 6, 7, 6, 7, 8, 6, 4, 6, 5, 0
7
0, 1, 2, 3
9
0, 1, 0, 2, 3, 4, 3, 5
10
0, 1, 2, 0, 1, 3, 4, 0, 5, 0, 6, 0, 7, 0, 1, 0, 7
The segmented navigation routes were then transformed to level-2 based navigation routes by using level-1 and level-2 based navigation route transformation algorithms. Table 6 shows the resulting level-1 based user’s navigation routes and Table 7 the level-2 based user’s navigation routes. Table 6
Level-1 based user’s navigation routes
Session number 1 2 6 7 9 10
Number-based sequence up, up up, up, down, up same, up, down, up, down, up, down, up, down, up, up, up, down, up , up, down, down, up, down, down up, up, up up, down, up, up, up, down, up up, up, down, up, up, up, down, up, down, up, down, up, down, up, down, up
Identifying web navigation behaviour and patterns Table 7
Level-2 based users’ navigation routes
Session number
Number-based sequence
1
up, up
2
up, peak, trough, up
6
same, peak, trough, peak, trough, peak, trough, peak, trough, up, up, peak, trough, up, peak, down, trough, peak, down, down
7
up, up
9
peak, trough, up, up, peak, trough, up
10
up, peak, trough, up, up, peak, trough, peak, trough, peak, trough, peak, trough, peak, trough, up
Table 8
417
User’s navigation patterns identified from APD
Session number
Patterns
1
upstairs
2
mountain, upstairs
6
fingers, finger, finger, finger, mountain, mountain, mountain
7
upstairs
9
finger, mountain, upstairs
10
mountain, mountain, finger, finger, finger, finger, upstairs
Finally, the user navigation patterns were automatically identified and categories according to the pre-defined pattern rules and pattern detection algorithm as shown in Table 8. Figures 13, 14 and 15 depict the footstep graphs of sessions 1, 2 and 10. Figure 13 Footstep graph of session 1 (see online version for colours)
Figure 14 Footstep graph of session 2 (see online version for colours)
418
I-H. Ting et al.
Figure 15 Footstep graph of session 10 (see online version for colours)
6
Empirical study
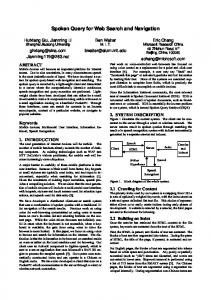
6.1 Introduction In order to present how the APD can be used in a real-world situation to understand user behaviour and identify areas for website design improvement, a project was developed in collaboration with the Computer Science Department of the University of York to analyse their support website. Figure 16 The old home page of the support website (see online version for colours)
Identifying web navigation behaviour and patterns
419
The support website is a sub-site of the departmental website, and belongs to the support office of the Computer Science Department. This website provides information about the departmental computing system, such as software, hardware and network, and is restricted to internal student and staff use only. A survey of the structure and design of the whole computer science departmental website found that the support sub-site provides most of the requisite information. However, the site is not appropriately structured for the presentation of such information. Figure 16 shows the original home page of the support website, which provides many links to all available information on a single web page, and which makes it difficult to find specific information. The support website was therefore chosen as a target for analysis of the browsing behaviour of users and discovery of potential website design problems. The technique used in this project was the APD methodology. The first objective was to improve the design of the home page of the support website, and therefore that page was used as the starting page for the analysis. The analysis of the clickstream data was carried out over a period of one month, with 5,647 total user sessions. Table 9 shows results of analysis using the APD methods. The fields ‘stairs pattern’, ‘fingers pattern’ and ‘others pattern’ in Table 9 denote the percentage frequency of the pattern (e.g., the percentage of fingers pattern = [how many times the fingers pattern occurs] / [fingers pattern + stairs pattern + others pattern]). The top ten results are presented in Table 9, sorted by the percentage of fingers and patterns, as the fingers pattern was considered a problematic pattern in this case. Table 9
Top ten: the people who view support homepage then view (total sessions: 5,647)
URL
Stairs pattern
Fingers pattern
Others pattern
Wireless.php
21.1%
64.6%
14.3%
Appsoft.php
27.8%
61.1%
11.1%
Laptop.php
53.4%
56.7%
9.9%
Network.php
36.4%
56.2%
7.4%
Print.php
32.6%
46.3%
21.1%
DiskSpace.php
42.2%
42.2%
15.6%
Mail.php
43.9%
36.4%
19.7%
Docs.php
46.6%
33.0%
20.4%
Query.php
61.1%
27.2%
11.7%
6.2 Recommendation and action In examining Table 9, we see that within the rule, ‘the people who view the support home page then view wireless.php, appsoft.php, laptop.php’, the percentage of the fingers pattern is very high. This indicates that these three web pages are popular pages in the website, but users do not seem to find it easy to reach these pages from the home page. One possible explanation for these results, as discussed in the previous section, is that the users can not find their destination web pages very easily from the support homepage. This in turn suggests that it is necessary to improve the website’s design to reduce the frequency of the fingers pattern.
420
I-H. Ting et al.
Given these results, we concluded that the design of the support home page could be improved through highlighting links to these three web pages. (The homepage has already provided links to these pages, but the links are not obvious). In this recommendation, enough flexibility remains to allow the website designer to decide how to highlight the links according to their own design idea, such as font size, font colour, linking type, description of the links. Figure 17 is the redesigned home page. The website designer added another linking area called ‘most popular pages’ and links to the three popular web pages were included in this area. The website designer also added some descriptions that explain the meaning of the three links. Figure 17 The redesigned home page of the support sub website (see online version for colours)
6.3 Performance evaluation of website design improvement After the home page redesign, an analysis was done to measure how often the fingers and stairs patterns occurred when users browsed these three pages. In this analysis, the frequency of fingers and stairs patterns was counted, and then the percentage of fingers and stairs patterns among total fingers and stairs pattern was calculated. Figures 18 and 19 show respectively the percentage of fingers patterns and the percentage of stairs patterns when users browsed from the support home page to appsoft.php page. In these figures, the x-axis is the time, marked in weeks and the y-axis the percentage of patterns.
Identifying web navigation behaviour and patterns
421
Figure 18 The percentage of fingers patterns when users browse from support homepage to appsoft.php page (see online version for colours)
Figure 18 shows that the percentage of fingers patterns decreased after the design of the support home page was changed in the week marked ‘*’. The only exception happens around the week marked ‘**’, which is the beginning of the new academic year. In addition, the percentage of stairs patterns increases after the design of the support home page has been changed (as shown in Figure 19) Figure 19 The percentage of stairs patterns when users browse from support homepage to appsoft.php page (see online version for colours)
These results show that a number of users changed their browsing behaviour in browsing appsoft.php from the support home page. Their browsing pattern changed from fingers pattern to stairs pattern, and this was considered an improvement by stakeholders. Figure 20 shows the percentage of finger patterns when users browsed from the support home page to wireless.php page and Figure 21 shows the percentage of stairs patterns when users browse from support home page to wireless.php page.
422
I-H. Ting et al.
Figure 20 The percentage of fingers patterns when users browse wireless.php page (see online version for colours)
Figure 21 The percentage of stairs patterns when users browse wireless.php page (see online version for colours)
Figure 22 shows the percentage of fingers patterns when users browsed from the support home page to laptop.php page and Figure 23 shows the percentage of stairs patterns when users browsed from support home page to laptop.php page. These results demonstrate that once the design of the support home page was changed, there was an obvious decrease in the percentage of fingers patterns and an increase in the percentage of stairs patterns (see Figure 23). Once the design of the support home page had been changed, there was a clear decrease in the percentage of fingers patterns (representing exploratory navigation) and a related increase in the percentage of stairs patterns (representing purposeful, directed navigation). Table 10 is a summary of average percentages of fingers and stairs patterns and the standard deviation of these two patterns in the three web pages, both before and after the support home page was changed. This table provides more clear evidence of the improvement generated by the re-design of the home page.
Identifying web navigation behaviour and patterns
423
Figure 22 The percentage of fingers patterns when users browse laptop.php page (see online version for colours)
Figure 23 The percentage of stairs patterns when users browse laptop.php page (see online version for colours)
Table 10
A summary table of average percentage of patterns and standard deviation of three web pages Appsoft.php
Wireless.php
Laptop.php
Fingers
Stairs
Fingers
Stairs
Fingers
Stairs
Average percentage (before website redesign)
55.1%
44.9%
53%
47%
65.8%
34.2%
Average percentage (after website redesign)
15.2%
84.8%
13.9%
86.1%
15.9%
84.1%
Standard deviation (before website redesign)
9.1%
9.1%
11.4%
11.4%
18%
18%
Standard deviation (after website redesign)
11.2%
11.2%
5%
7.3%
9.2%
9.2%
424
7
I-H. Ting et al.
Conclusions
In this paper, we have described a sequence mining approach that we term the APD method. We have also introduced the concepts of level-1 and level-2 elements of user’s navigation behaviour, which constitute a vital part of the APD method. We have presented two case studies that demonstrate that APD can be used to identify pre-defined user navigation patterns automatically and shown that users’ navigation patterns can be automatically identified and categorised, even when large amounts of data are involved. We believe that such an approach can be an important tool that has the potential for application in many areas. APD has obvious applications in the field of web usage mining and in research into user’s navigational behaviour. APD may also a useful tool when used in conjunction with e-learning environments so that the navigation strategies and patterns of learners can be identified efficiently. As was the case in one of our studies, APD can also be used as a tool to help the improvement of website design, either in simple terms of usability or, in conjunction with input from marketing departments, as a means to fine tune a site to particular market segments.
References Agrawal, R. and Srikant, R. (1995) ‘Mining sequential patterns’, Proceeding of International Conference on Data Engineering, Taipei, Taiwan, IEEE Computer Society, pp.3–14. Banerjee, A. and Ghosh, J. (2001) ‘Clickstream clustering using weighted longest common subsequences’, Proceedings of the 1st SIAM International Conference on Data Mining: Workshop on Web Mining, Chicago, USA, pp.33–40. Berendt, B. and Spiliopoulou, M. (2000) ‘Analysis of navigation behaviour in web sites integrating multiple information systems’, The VLDB Journal, Vol. 9, No. 1, pp.56–75, Springer-Verlag. Canter, D., Rivers, R. and Storrs, G. (1985) ‘Characterising users navigation through complex data structures’, Behaviour and Information Technology, Vol. 4, No. 2, pp.93–102. Ceglar, A. and Roddick, J.F. (2006) ‘Association mining’, ACM Computing Surveys, Vol. 38, No. 2, Article 5. Chen, M.S., Park, J.S. and Yu, P.S. (1998) ‘Efficient data mining for path traversal patterns’, IEEE Transaction on Knowledge Data Engineering, Vol. 10, No. 2, pp.209–221. Chen, Z., Fowler, R.H., Fu, A.W.C. and Wang, C. (2003) ‘Linear and sublinear time algorithms for mining frequent traversal path patterns from very large web logs’, Proceedings of the Seventh International Database Engineering & Applications Symposium, pp.117–122. Chi, E.H. (2002) ‘Improving web usability through visualisation’, IEEE Internet Computing, pp.64–71. Chi, E.H., Hong, L., Heiser, J., Card, S.K. and Gumbrecht, M. (2007) ‘ScentIndex and ScentHighlights: productive reading techniques for conceptually reorganizing subject indexes and highlighting passages’, Information Visuallization, Vol. 6, pp.32–47. Clark, L., Ting, I., Kimble, C., Wright, P. and Kudenko, D. (2006) ‘Combining ethnographic and clickstream data to identify navigation strategies’, Information Research, Vol. 11, No. 2, Paper 249, available at http://InformationR.net/ir/11-2/paper249.html ]. Cooley, R., Mobasher, B. and Srivastava, J. (1999a) ‘Data preparation for mining world wide web navigation patterns’, Journal of Knowledge and Information System, Vol. 1, No. 1, pp.5–32. Cooley, R., Tan, P.N. and Srivastava, J. (1999b) ‘Discovery of interesting usage patterns from web data’, LNCS, Vol. 1836, pp.163–182, Springer-Verlag. Dwinnell, W. (2002) ‘Data visualization tips for data mining: pattern recognition provides data insight’, PCAI Journal, pp.51–57.
Identifying web navigation behaviour and patterns
425
Eick, S.G. (2002) ‘Visual analysis of website navigation patterns’, in Borner, K. and Chen, C. (Eds.): Visual Interface to Digital Libraries, pp.65–77. El-Ramly, M., Iglinski, P., Stroulia, E., Sorenson, P. and Matichuk, B. (2001) ‘Modeling the system-user dialog using interaction traces’, Proceedings of the Eighth Working Conference on Reverse Engineering (WCRE 2001), p.208. El-Sayed, M., Ruiz, C. and Rundensteiner, E.A. (2004) ‘FS-miner: efficient and incremental mining of frequent sequence patterns in web logs’, Proceedings of the WIDM 2004 Conference, Washington, DC, USA, pp.128–135. Ezeife, C.I. and Lu, Y. (2005) ‘Mining web log sequential patterns with position coded pre-order linked WAP-tree’, Data Mining and Knowledge Discovery, Vol. 10, No. 1, pp.5–38. Han, J. and Kamber, M. (2001) Data Mining: Concepts and Techniques, Morgan Kaufmann Publishers, USA. Herder, E. and Weinreich, H. (2005) ‘Interactive web usage mining with the navigation visualizer’, Proceedings of Conference on Human Factors in Computing Systems (CHI 2005), Portland, Oregon, USA, pp.1451–1454. Hirsch, F.J., Meeks, S. and Brooks, C.L. (1997) ‘Creating custom graphical web views based on user browsing history’, A Poster Presentation at the Sixth International World Wide Web Conference, Santa Clara, California, USA. Hong, J.I. and Landay, J.A. (2001) ‘WebQuilt: a framework for capturing and visualizing the web experience’, Proceedings of The Tenth International World Wide Web Conference (WWW10), Hong Kong, China, pp.717–724. Ivory, M.Y. and Hearst, M.A. (2001) ‘The state of the art in automating usability evaluation of user interfaces’, ACM Computing Surveys, Vol. 33, No. 4, pp.470–516. Kothari, R., Mittal, P., Jain, V. and Mohania, M. (2003) ‘On using page cooccurrences for computing clickstream similarity’, Proceedings of SIAM International Conference on Data Mining, 1–3 May 2003, San Francisco, CA, USA. Lartillot, O. (2005) ‘Efficient extraction of closed motivic patterns in multi-dimensional symbolic representations of music’, Proc. of the 2005 IEEE/WIC/ACM International Conference on Web Intelligence (WI 2005), France, IEEE Computer Society, pp.220–235. Mobasher, B., Dai, H., Luo, T. and Nakagawa, M. (2002) ‘Discovery and evaluation of aggregate usage profiles for web personalization’, Data Mining and Knowledge Discovery, Vol. 6, No. 1, pp.61–82. Olston, C. and Chi, E.H. (2003) ‘ScentTrails: integrating browsing and searching on the web’, ACM Transactions on Computer-Human Interaction, Vol. 10, No. 3, pp.177–197. Pabarskaite, Z. and Raudys, A. (2007) ‘A process of knowledge discovery from web log data: systematization and critical review’, Journal of Intelligent Information Systems, Vol. 28, No. 1, pp.79–104. Perkowitz, M. and Etzioni, O. (2000) ‘Adaptive web sites: examining the potential use of automated adaptation to improve web sites for visitor’, Communications of the ACM, Vol. 47, No. 8, pp.152–158. Pierrakos, D., Paliouras, G., Papatheodorou, C. and Spyropoulos, C.D. (2003) ‘Web usage mining as a tool for personalization: a survey’, User Modelling and User Adapted Interaction, Vol. 13, No. 4, pp.311–372. Siochi, A.C. and Hix, D. (1997) ‘A study of computer-supported user interface evaluation using maximal repeating pattern analysis’, Proceedings of the SIGCHI Conference on Human Factors in Computing Systems: Reaching through Technology, New Orleans, Louisiana, USA, pp.301–305. Srivastava, J., Cooley, R., Deshpande, M. and Tan, P.N. (2000) ‘Web usage mining: discovery and applications of usage patterns from web data’, 2000 SIGKDD Explorations, Vol. 1, No. 2, pp.12–23. Tan, P.N. and Kumar, V. (2002) ‘Discovery of the web robot sessions based on their navigational patterns’, Data Mining and Knowledge Discovery, Vol. 6, No. 1, pp.9–35.
426
I-H. Ting et al.
Ting, I.H., Kimble, C. and Kudenko, D. (2004) ‘Visualising and classifying the pattern of user’s navigation behaviour for website design recommendation’, Proc. of the International Workshop on Knowledge Discovery in Data Stream, Pisa, Italy, pp.101–102. Ting, I.H., Kimble, C. and Kudenko, D. (2005) ‘A pattern restore method for restoring missing patterns in server side clickstream data’, in Zhang, Y. et al. (Eds.): APWeb 2005, LNCS 3399, pp.501–512, Springer-Verlag. Velasquez, J.D., Yasuda, H., Aoki, T. and Weber, R. (2003) ‘Using the KDD process to support web site reconfigurations’, Proceedings of the IEEE/WIC International Conference on Web Intelligence, IEEE Computer Society, pp.511–515. Xing, D. and Shen, J. (2004) ‘Efficient data mining for web navigation patterns’, Information and Software Technology, Vol. 46, No. 1, pp.55–63. Yang, Z., Wang, Y. and Kitsuregawa, M. (2006) ‘An effective systems for mining web log’, Proceedings of APWEB 2006 Conference, Harbin, China, pp.40–52. Yen, S.J. and Lee, Y.S. (2003) ‘An efficient data mining algorithm for discovering web access patterns’, in Zhou, X. et al. (Eds.): APWeb 2003, LNCS 2642, pp.187–192, Springer-Verlag. Zhou, R., Hui, S.C. and Fong, A.C.M. (2004) ‘An efficient approach for mining periodic sequential access patterns’, in C. Zhang et al. (Eds): LNAI 3157, pp.485–494, Springer-Verlag.