patterns and present Bayesian models for their learning and prediction. The nav ... behavior modeling and Web navigation pattern discovery has been a popular ...
Learning and Predicting Key Web Navigation Patterns Using Bayesian Models Malik Tahir Hassan, Khurum Nazir Junejo, and Asim Karim Dept. of Computer Science LUMS School of Science and Engineering Lahore, Pakistan {mhassan, junejo, akarim}@lums.edu.pk
Abstract. The accurate prediction of Web navigation patterns has immense commercial value as the Web evolves into a primary medium for marketing and sales for many businesses. Often these predictions are based on complex temporal models of users’ behavior learned from historical data. Such an approach, however, is not readily understandable by business people and hence less likely to be used. In this paper, we consider several key and practical Web navigation patterns and present Bayesian models for their learning and prediction. The navigation patterns considered include pages (or page categories) visited in first N positions, type of visit (short or long), and rank of page categories visited in first N positions. The patterns are learned and predicted for specific users, time slots, and user-time slot combinations. We employ Bayes rule and Markov chain in our learning and prediction models. The focus is on accuracy and simplicity rather than modeling the complex Web user behavior. We evaluate our models on four weeks of Web navigation data. Prediction models are learned from the first three weeks of data and the predictions are tested on last week’s data. The results confirm the high accuracy and good efficiency of our models.
1 Introduction Significant patterns do exist in Web navigation data [1]. Learning and predicting such patterns has immense commercial value as the Web evolves into a primary medium for marketing and sales for many businesses [2]. Web-based businesses seek useful users’ patterns to help identify promising events, potential risks, and to undertake customer relations management. Similarly, such businesses seek useful temporal and global patterns to help them optimize their business processes and system operations. Web surfer behavior modeling and Web navigation pattern discovery has been a popular research topic. Over the years, numerous approaches have been proposed for solving various aspects of this problem with varying degrees of success. In general, the problem involves prediction of the sequence of page views based on the previous history of such sequences. To simplify the problem somewhat, Web pages are often abstracted and grouped into categories and the problem is reduced to the prediction of the sequence of page categories visited. Nonetheless, this is a complex machine learning problem that requires careful consideration from the technical and practical points of view. Among the various approaches used for the modeling of Web navigation patterns, probabilistic approaches have been very common [3,4,5,6,7]. Borges and Levene [3] O. Gervasi et al. (Eds.): ICCSA 2009, Part II, LNCS 5593, pp. 877–887, 2009. c Springer-Verlag Berlin Heidelberg 2009 �
878
M.T. Hassan, K.N. Junejo, and A. Karim
propose the use of N-gram probabilistic models which assume that the probability of a page visit depends only on the last N pages browsed. Similarly, Manavoglu et al. [4] present probabilistic user behavior models by applying maximum entropy and Markov mixture models. For prediction for known users, they propose a Markov model. Another probabilistic solution is presented by Deshpande and Karypis [5]. They try to reduce the state complexity resulting from all kth-order Markov models by pruning many of the non-affecting states. Eirinaki et al. [6] present a hybrid probabilistic predictive model by extending the properties of Markov models with link-based methods such as PageRank. Such an approach is applicable only when link information of the pages is known. Lu et al. [7] group or cluster clickstream data using a pair-wise alignment algorithm. Then, a first-order Markov model is built for each cluster of sessions. Jing et al. [8] present an extension of hidden Markov model to form interest navigation patterns for different users. Awad et al. [9] have combined Markov models and SVM for surfing predictions. They also incorporated domain knowledge. The majority of the approaches try to tackle the general Web surfer behavior modeling problem rather than focusing on specific Web navigation pattern learning and prediction. This often makes the solutions complex and difficult to interpret especially by business people. In this paper, we consider four key patterns and the associated learning and prediction problems: (1) predicting short and long visit sessions, (2) predicting page categories visited in first N positions, (3) predicting number of page views per page category visited, and (4) predicting rank of page categories visited among the first N positions. Models are learned and predictions are made given a specific user, time slot, or user-time slot combination. These four problems capture key Web navigation patterns of practical value. Moreover, they represent simpler problems as compared to the general Web surfer behavior modeling problem, resulting in readily understandable solutions. We present Bayesian models for learning and predicting these patterns. In particular, we develop Bayes classifiers for each problem, invoking the na¨ıve Bayes assumption of conditional independence of the input given the class. We model the sequence of page categories visited as a Markov chain. The na¨ıve Bayes assumption and the first-order Markov property are used to improve efficiency of the solutions. The performance of our models is evaluated on four weeks of data made available by the ECML/PKDD Discovery Challenge [10]. The results show high prediction accuracy comparable to those made by SVM (for pattern 1). Moreover, our models are simpler and easier to understand by non-technical people. The rest of the paper is organized as follows. We formally describe the Web navigation pattern learning and prediction problems in Section 2. Our Bayesian models for learning and predicting these patterns are presented in Section 3. Section 4 presents the evaluation setup including a description of the data and the evaluation criteria. Results and discussion of our evaluations are given in Section 5. We conclude in Section 6.
2 Problem Setting Let variable X = {U, T } identify a visit session, where variables U and T denote the user ID and the starting timestamp of the visit session, respectively. A visit session or
Learning and Predicting Key Web Navigation Patterns
879
path is described by a sequence of page categories visited during that session. Individual Web pages are abstracted and grouped into a finite number of page categories. Variable Ci identifies the category visited at position i of the sequence, and a visit session is a sequence of one or more categories. A visit session can have the same page category visited at different positions; however, two consecutive page categories must be different. The range of the number of page views for a given page category is captured by the variable Ri , where i denotes the ith position in the sequence. All variables have discrete and finite sets of possible values. The variable T is discretized into time slots. The historical training data available for learning contains unique visit sessions represented by instantiations of the variables X, Ci ’s, and Ri ’s. The test data contain different instantiations of the variable X only. It is worth noting that although the problem setting defined above is based on sequences of page categories visited, our models can be applied equally to settings with sequences of Web pages visited. In the latter setting, the variable Ci captures the Web page visited in position i of a visit session. The grouping of related Web pages into categories is commonly used in practice to reduce complexity. Grouping can be done on the basis of topic, theme, domain, or other measure of Web page relatedness. We divide the general problem of Web navigation pattern learning and prediction into four key sub-problems corresponding to four key patterns. Problem 1 is to learn to predict short or long visit sessions. A visit session is said to be short if it is of length 1 (i.e. it contains only one page category); otherwise, it is said to be long. Problem 2 is to learn to predict the first N page categories visited in visit sessions. Problem 3 is to learn to predict the range of the number of pages viewed in positions 1, 2, . . . , N of visit sessions. Problem 4 is to learn the ranking of page categories in visit sessions (i.e. probability ordered page categories). These problems are solved for the cases when, besides the navigation sequences, X is known, only U is known, only T is known, and nothing is known. The objective in each problem is to predict the output as accurately as possible.
3 Bayesian Models for Web Navigation Patterns We present Bayesian solutions to the four problems described in the previous section. The Bayesian approach has been adopted for the following reasons: (1) it is simple and intuitive, providing insight into the problem and its solution, (2) it is adaptable to concept drift, and (3) it is computationally efficient and acceptably accurate. In particular, we build a Bayes classifier for each of the four problems, as described in the following sub-sections. 3.1 Pattern 1: Short and Long Visit Sessions Learning and predicting short and long visit sessions can be used to segment navigation data given user ID, timestamp, or both. This pattern represents a two-class classification problem. We present a na¨ıve Bayes classifier for its solution. Given a visit session X, the most probable class z � = Z ∈ {long, shart} is given by z� =
arg max z∈{long,short}
P (Z = z)P (X|Z = z)
(1)
880
M.T. Hassan, K.N. Junejo, and A. Karim
where P (.) denotes the probability of the enclosed event. If we assume that the user ID U and the timestamp T are conditionally independent of each other given class Z, we get the na¨ıve Bayes classification: z� =
arg max z∈{long,short}
P (Z = z)P (U |Z = z)P (T |Z = z).
(2)
This represents the most probable class under the na¨ıve Bayes assumption. If we do not consider the timestamp T or user ID U of a visit session, the corresponding probability term in the right hand side of Equation (2) drops out further simplifying the model. If we do not consider any input, then the best prediction is given by the highest unconditional probability P (Z = z). 3.2 Pattern 2: Page Categories Visited in First N Positions Learning and predicting the sequence of page categories visited by a user is one of the most important pattern from a strategic and operational perspective. Many times in practice, only the first N positions in the sequence are useful as long sequences tend to drift. To learn and predict this pattern, we model the sequence of page categories visited as a Markov chain. The chain start state (the first page category) is determined by a Bayes classifier. Subsequent states are determined by combining the posterior probability estimates given by the Markov chain with that of the Bayes classifier for that particular position. The reason for selecting the first-order Markov model over the kthorder (k > 1) model is two fold: (1) The problem involves the learning and prediction of only the first N states, where N is usually less than 5, for which a first-order Markov model is sufficient, and (2) The first-order Markov model is computationally efficient. According to the Bayes rule, the posterior probability of page category Ci visited in position i (i = 1, 2, . . . , N ) of a visit session X is given by P B (Ci |X) =
P (Ci )P (X|Ci ) . P (X)
(3)
The most probable page category visited at the start of the sequence C1 = c�1 is then given by (4) c�1 = arg max P (C1 = c)P (X|C1 = c). c
This fixes the start state of the Markov chain. The subsequent states can be found by combining the predictions of the Bayes classifier (Equation 3) and the Markov model. According to the Markovian property, for a given visit session X the posterior probability of page category Ci visited in position i (i = 2, . . . , N ) depends only on Ci−1 and can be expressed as P M (Ci |Ci−1 , X) =
P (X|Ci , Ci−1 )P (Ci |Ci−1 ) . P (X|Ci−1 )
(5)
The page category visited at position i (i = 2, . . . , N ) is then given by c�i = arg max P B (Ci = c|X)P M (Ci = c|c�i−1 , X). c
(6)
Learning and Predicting Key Web Navigation Patterns
881
This equation is based on the assumption that the predictions of the Bayes and Markov models are independent. Notice that in evaluating Equation (6), we do not need to estimate the probabilities in the denominators of Equations (3) and (5). If a visit session X is described by user ID U and timestamp T , the na¨ıve Bayes assumption can be invoked to simplify the expressions, as shown for pattern 1 above. 3.3 Pattern 3: Range of Number of Page Views Per Page Category Visited This pattern captures the range of the number of page views for the first N page categories visited in a visit session. It provides information regarding the interests of users for specific page categories. We divide the number of page visits into three ranges; 1 page view corresponds to the first range, page views from 2 to 3 correspond to the second range and consequently page views greater than 3 correspond to the third range. The page categories c�i (i = 1, 2, . . . , N ) visited have been determined as part of pattern 2. We use a Bayes classifier to predict the range Ri = ri� of page views made at position i (i = 1, 2, . . . , N ) in visit session X as ri� = arg max P (Ri = r|Ci = c�i )P (X|Ri = r, Ci = c�i ) r
(7)
where the page category c�i is the one predicted as part of pattern 2. 3.4 Pattern 4: Rank of Page Categories in Visit Sessions Ranking of page categories visited in the first N positions is another key pattern. As a specific case, this pattern enables prediction of the most probable (popular) page category visited given a user ID, timestamp, or both. Pattern 4 is different from pattern 2 in that it disregards the order of occurrence of page categories in the sequence. Page categories can be ranked by ordering the posterior probability of a page category C = c observed in the first N positions given X, i.e., P (C = c|X). This probability can be calculated by applying the Bayes rule as P (C = c|X) =
P (X|C = c)P (C = c) . P (X)
(8)
Since the denominator is the same for all page categories, it can be dropped from the equation when using it for ordering purposes. The most probable category c observed in the first N positions is then given by c� = arg max P (X|C = c)P (C = c). c
(9)
As discussed for pattern 1, the naive Bayes assumption can be invoked to replace P (X|C = c) with P (U |C = c)P (T |C = c). Similarly, if only T or U is known, then the corresponding probability term drops out. 3.5 Estimating the Probabilities The Bayesian models presented in the previous sections are learned by estimating the various probabilities on the right hand sides of Equations (1) to (9). These probabilities are estimated from the historical training data by maximum likelihood estimation.
882
M.T. Hassan, K.N. Junejo, and A. Karim
Since all variables are observed in the training data, maximum likelihood estimates are equivalent to the frequencies in the data. Specifically, the probability estimate of P (X = x|Y = y) is given by P (X = x|Y = y) ≈
no. of examples with X = x, Y = y . no. of examples with Y = y
(10)
For an unconditional probability, the denominator will be the total number of examples in the training data. To estimate the transition probabilities in Equation (5), we count an example if it contains the given transition at any position of the visit session.
4 Evaluation Setup We evaluate the effectiveness and efficiency of our models for Web navigation patterns on real navigation data. The evaluations are performed on a desktop PC with an Intel 2.4 GHz Pentium 4 processor and 512 MB of memory. Implementation is done in Java using Eclipse development environment. The subsequent sections describe the data and evaluation criteria. 4.1 Data and Its Characteristics We use the data provided by the 2007 ECML/PKDD Discovery Challenge [10]. The data were collected by Gemius SA, an Internet market research agency in Central and Eastern Europe, over a period of 4 weeks through use of scripts placed in code of the monitored Web pages. Web users were identified using cookies technology. The first 3 weeks of data are used for training (learning the models) while the last week of data are reserved for testing (evaluating predictions of the learned models). The data records are individual visit sessions described by the fields: path id, user id, timestamp, {category id, no. of page views},. . . . An example visit session is shown below: path id user id timestamp path = (category id, no. of page views)... 27 1 1169814548 7,1 3,2 17,9 3,1 ...
The timestamp field records the time at which a visit session starts and the category ID field identifies a group of Web pages with similar theme such as entertainment, technology, or news. There are 20 page categories in the data. The entire data contain 545,784 visit sessions from which the first 379,485 visit sessions are used for training and the remaining 166,299 visit sessions are used for testing. There are 4,882 distinct users in the data. An analysis of the training and test data reveals non-uniform data distribution. The minimum and maximum number of visits by a user in the training data is 7 and 497, respectively, with an average of 77.7 visits per user. The minimum and maximum number of visits by a user in the test data is 1 and 215, respectively. Similarly, the distribution
Learning and Predicting Key Web Navigation Patterns
883
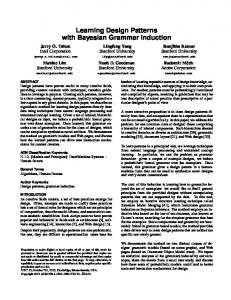
0.7 Train Data Test Data 0.6
probability
0.5
0.4
0.3
0.2
0.1
0
0
5
10
15
20
25
category
Fig. 1. Non-uniform distribution of categories [11]
of page categories is uneven. Some categories are being visited more frequently than others. This is evident from Figure 1 which shows the probability of the categories in the training and test data. About 73% of the visit sessions in the training and test data are short, i.e., a visit where only one category is visited. These statistics confirm that the data distribution of the test and training sets is similar. 4.2 Evaluation Criteria The performance of our models is determined by computing a percent score on the test data for each pattern after learning from the training data. We learn and predict the first 3 positions of the sequences only. That is, N = 3 for patterns 2, 3, and 4. We define three values for the range variable as R = {(1 page view), (2 - 3 page views), (> 3 page views)}. Pattern 1 represents a two-class classification problem. The classification accuracy, defined as the ratio of correct to total classifications, is used to evaluate this problem. Pattern 2 represents a sequence prediction problem. We evaluate this by computing a percent score. The score is the sum of scores of each position prediction, where each position prediction score is defined as follows: The position prediction score is the sum of weights assigned to the N predicted categories. If the first, second, and third categories are predicted correctly, then assign weights 5, 4, and 3, respectively, to these positions. If a prediction is incorrect for the category in the first position, then it is assigned a weight of 4 if that category occurs in the second position, 3 if it occurs in the third position, 2 if it occurs in the fourth position, 1 if it occurs in position five and beyond, and zero if it does not occur at all. The weight assigned cannot be greater than the maximum possible for that position (e.g. the weight assigned to position 2 cannot be greater than 4). The percent score is obtained by dividing the score with the maximum possible score that can be achieved on the test data through a perfect classification.
884
M.T. Hassan, K.N. Junejo, and A. Karim
Notice that this score definition penalizes predictions that are incorrect and the amount of penalty depends on its correct position. Pattern 3 is also evaluated by computing a percent score. This score computation is identical to that for pattern 2 except that the weights are incremented by one if the predicted range of page views is correct; otherwise they are not incremented. Pattern 4 represents a ranking problem. We evaluate this by calculating two scores: the percent score of top ranked category and the percent score of top 3 ranked categories. Score calculation is same as defined for pattern 2 above. For all patterns, higher evaluation values signify better performance. The maximum possible score for each problem is also given in our results.
5 Results and Discussion Using the evaluation setup described in the previous section, we present prediction results for patterns 1, 2, 3, and 4 under four settings: (1) considering both the user ID and timestamp (X = {U, T }), (2) considering only the user ID (U ), (3) considering only the timestamp (T ), and (4) considering no input (i.e. unconstrained or global pattern G). We discretize the timestamp field into four values: weekday-day, weekday-night, weekend-day, and weekend-night. Daytime starts from 8 AM and ends at 6 PM. We tried several discretizations for timestamp but present results for the above defined discretization only. The results for patterns 1, 2, 3, and 4 for all four settings are given in Table 1. For pattern 1 (short and long visit sessions), the highest prediction accuracy of 76.64% is obtained when only the user ID is used as input. When both user ID and timestamp are used, the accuracy drops slightly to 76.6%. Thus, the knowledge of the visit sessions’ timestamps is actually degrading prediction performance. The prediction accuracy obtained when only timestamp (T ) is used is equal to that when no information is given regarding the visit sessions (the G or global setting). This shows that the global pattern is identical to that of the timestamp conditioned pattern. We also learn this pattern using a support vector machine (SVM) [12]. The highest prediction accuracy given by SVM (using linear kernel and empirically tuned parameters) is 76.68% when both user ID and timestamp are used. Although this accuracy is slightly better than that reported Table 1. Prediction performance of our models (in percent score and as a score ratio). X = User ID + Timestamp; U = User ID only; T = Timestamp only; G = no input or global. Pattern 1 76.6% (127383/166299) U 76.64% (127457/166299) T 73.31% (121919/166299) G 73.31% (121919/166299)
X
Pattern 2
Pattern 3
83.17% (902849/1085494) 83.21% (903270/1085494) 64.32% (698199/1085494) 64.32% (698199/1085494)
72.42% (957235/1321706) 72.54% (958780/1321706) 54.17% (716012/1321706) 54.17% (716012/1321706)
Pattern 4 Top Ranked 79.86% (664009/831495) 80.57% (669904/831495) 52.08% (433002/831495) 52.08% (433002/831495)
Pattern 4 Top 3 Ranked 81.56% (885319/1085494) 83.1% (902010/1085494) 66.3% (719568/1085494) 66.3% (719568/1085494)
Learning and Predicting Key Web Navigation Patterns
885
by our model, our approach is significantly more efficient. For our hardware setup, our approach takes less than 1 minute to learn from the training data and classify the test data. In contrast, the SVM takes several hours to learn. For pattern 2 (page categories visited in first 3 positions), the percent scores obtained for the first two settings (X and U ) are practically identical at 83.17% and 83.21%, respectively. Here again, the addition of the timestamp information to the user ID does not improve prediction performance. However, these scores are significantly better than those obtained for the timestamp (T ) and global (G) settings. These results show that Web navigation behavior, for short page category sequences, is strongly correlated with user behavior. On the hand, we do not find any correlation between Web navigation behavior and time in our data. On our hardware setup, it takes about 15 and 6 minutes to learn and predict this pattern for the first and second settings, respectively. Similar observations can be made for the learning and prediction of pattern 3 (range of number of page views per page category). The percentage score drops slightly from 72.54% when only user ID (U ) is considered to 72.42% when both timestamp and user ID (X) are considered. Similarly, the running time decreases from about 1.5 to about 1 minute from the first to the second setting. We evaluate pattern 4 (rank of page categories in first 3 positions of visit sessions) in two ways using the same score definition for pattern 2. First, we determine the percent score of predicting the top ranked page category (favorite page category) and second, we compute a percent score based on the top 3 ranked categories (favorite 3 categories). These results are shown in the rightmost two columns of Table 1. The highest percent scores of 80.57% and 83.1% are obtained when only user ID is given. Notice that when no information is provided about the visit sessions (the global pattern) this pattern is poorly defined. Thus, just globally ranking page categories seen in historical data is ineffective. A consistent observation from the results on this data is that knowledge of the start of visit sessions does not improve prediction performance. In fact, for all four patterns, the prediction performance for the global pattern and that conditioned on timestamp is identical. We tried several discretizations of the timestamp field with similar results. It is worth pointing out that our models are generative in nature. As such, we can analyze the patterns by studying the probability distributions that generate the patterns (the probability terms on the righthand sides of Equations 1 to 9). The results for patterns 1, 2 and 3 are also reported by [13] and [14]. Dembczyski et al. in [13] presented trend-prediction and auto-regression methods for predicting pattern 1, and empirical risk minimization for predicting pattern 2 and 3. They claim slightly better results but our approach is simpler, efficient and generative. Lee in [14] used frequent items approach for predicting patterns 1,2 and 3. Their results are similar in case of pattern 1 and 3 while for pattern 2, our results are better. 5.1 Computational Complexity The time complexity of our models for all the four patterns is O(D) where D is the total number of visit sessions in the data, this is because the models are learned in a single pass over the training data and constant time is required to predict each test example as all the probabilities have been pre-computed.
886
M.T. Hassan, K.N. Junejo, and A. Karim
The space complexity of our models is defined by the number of probability estimates required. The number of probabilities required is a sum of the products of variables’ cardinalities. For example, the space complexity of pattern 2 given X, which is the highest among all patterns, is: (c × p) + (u × c × p) + (c2 ) + (u × c2 ) + (t × c × p) + (t × c2 ), where c is the number of page categories, p is the number of sequence positions, t is the number of timestamp values, and u is the number of distinct users. All of these terms correspond to the probabilities in Equation (3) and Equation (5). In general, u, c, t, and p are much less than D and as D grows u, c, t, and p remain constant or grow very slowly.
6 Conclusion In this paper, we present Bayesian models for learning and predicting key Web navigation patterns. Instead of modeling the general problem of Web navigation we focus on key navigation patterns that have practical value. Furthermore, instead of developing complex models we present intuitive probabilistic models for learning and prediction. The patterns that we consider are: short and long visit sessions, page categories visited in first N positions, range of page views per page category, and rank of page categories in first N positions. We learn and predict these patterns under four settings corresponding to what is known about the visit sessions (user ID and/or timestamp). Our models are accurate and efficient as demonstrated by evaluating them on 4 weeks of data collected from Web sites in central and eastern Europe. In particular, our model for learning and predicting short and long visit sessions has the same prediction accuracy as SVM but is orders of magnitude faster. We also find that incorporating the start time of visit sessions does not have any practical impact on prediction accuracy. Learning and predicting Web navigation patterns is of immense commercial value. We believe that a direct approach by first identifying key patterns and then building models for these patterns is more likely to be used by business people. As part of future work, we will explore the impact of behavior clustering prior to developing prediction models.
References 1. Huberman, B.A., Pirolli, P.L.T., Pitkow, J.E., Lukose, R.M.: Strong regularities in world wide web surfing. Science 280(5360), 95–97 (1998) 2. Srivastava, J., Cooley, R., Deshpande, M., Tan, P.N.: Web usage mining: discovery and applications of usage patterns from web data. SIGKDD Explor. Newsl. 1(2), 12–23 (2000) 3. Borges, J., Levene, M.: Data mining of user navigation patterns. In: Masand, B., Spiliopoulou, M. (eds.) WebKDD 1999. LNCS, vol. 1836, pp. 92–112. Springer, Heidelberg (2000) 4. Manavoglu, E., Pavlov, D., Giles, C.L.: Probabilistic user behavior models. In: ICDM 2003: Proceedings of the Third IEEE International Conference on Data Mining, Washington, DC, USA, p. 203. IEEE Computer Society, Los Alamitos (2003) 5. Deshpande, M., Karypis, G.: Selective markov models for predicting web page accesses. ACM Transaction on Internet Technology 4(2), 163–184 (2004)
Learning and Predicting Key Web Navigation Patterns
887
6. Eirinaki, M., Vazirgiannis, M., Kapogiannis, D.: Web path recommendations based on page ranking and markov models. In: WIDM 2005: Proceedings of the 7th annual ACM international workshop on Web information and data management, pp. 2–9. ACM, New York (2005) 7. Lu, L., Dunham, M., Meng, Y.: Discovery of significant usage patterns from clusters of clickstream data. In: Proceedings of WebKDD (2005) 8. Wu, J., Zhang, P., Xiong, Z., Sheng, H.: Mining personalization interest and navigation patterns on portal. In: Zhou, Z.-H., Li, H., Yang, Q. (eds.) PAKDD 2007. LNCS, vol. 4426, pp. 948–955. Springer, Heidelberg (2007) 9. Awad, M., Khan, L., Thuraisingham, B.: Predicting www surfing using multiple evidence combination. The VLDB Journal 17(3), 401–417 (2008) 10. Nguyen, E.H.S.: Ecml/pkdd: Discovery challenge. In: Proceedings of ECML/PKDD: Discovery Challenge (2007), http://www.ecmlpkdd2007.org/challenge 11. Hassan, M.T., Junejo, K.N., Karim, A.: Bayesian inference for web surfer behavior prediction. In: Proceedings of ECML/PKDD: Discovery Challenge (2007), http://www.ecmlpkdd2007.org/challenge 12. Joachims, T.: Making large-scale support vector machine learning practical. In: Advances in kernel methods: support vector learning, pp. 169–184. MIT Press, Cambridge (2007) 13. Dembczynski, K., Kottowski, W., Sydow, M.: Effective prediction of web user behaviour with user-level models. In: Proceedings of ECML/PKDD: Discovery Challenge (2007), http://www.ecmlpkdd2007.org/challenge 14. Lee, T.Y.: Predicting user’s behavior by the frequent items. In: Proceedings of ECML/PKDD: Discovery Challenge (2007), http://www.ecmlpkdd2007.org/challenge