Dirk Colbry and George Stockman .... ple alignment measurement SAM â the final RMS matching .... system from generating an acceptable SAM value.
IDENTITY VERIFICATION VIA THE 3DID FACE ALIGNMENT SYSTEM Dirk Colbry and George Stockman Department of Computer Science and Engineering, Michigan State University East Lansing, Michigan 48824-1226 {colbrydi, stockman}@cse.msu.edu ABSTRACT The 3DID system has been developed to verify the identity of a person by matching a sensed 3D surface of the face to a face model stored during an enrollment process. Anchor point detection is performed based on shape index; then, a rigid alignment is determined between the observed and model face anchor points. The alignment is refined using a modified ICP algorithm allowing for trimming of 10% noise. Trimmed RMS error for the same person is almost always smaller than 1.3mm; whereas for different persons, it is almost always larger. Performance analysis shows that the 3DID system is fast enough (< 2 sec on a 3.2 MHz P4), reliable enough (1% EER with 1.5% reject rate), and user friendly enough (handles 30 degrees of yaw and 10 degrees of roll and pitch) to be practical in several applications. The current system provides several displays of value to human agents either in online or delayed analysis mode. An inexpensive scanner is needed for widespread use.
[8]. Much recent research has focused on the development of 3D face recognition technology. Some investigators have used the 3D processing component to normalize the pose and lighting of the input image to match pose and lighting variation in the 2D gallery images. These mappings include 3D rotations, as well as more advanced morphing models that include variations in expression [2]. The rest of this paper summarizes our experience in developing our 3DID system and the performance that it has achieved. Section 2 describes the system goals and the design of the system to meet those goals. Section 3 describes the face-matching algorithm and Section 4 gives the results of many tests of the algorithm. Discussion of the system and the performance tests given in Section 5 support the conclusion that 3DID will be effective in practice provided that scanner costs are significantly decreased.
1. INTRODUCTION
The 3DID system was designed to control access to secure locations or assets, such as airports or bank accounts. A key assumption is that a person using the 3DID system wants to gain access to the secure resources, and thus will be cooperative in the identification process. For example, while the 3DID system can handle minor changes in pose and expression, it does not accept the extreme variations in expression that are generated by an uncooperative subject.
The human face is the most common “biometric” used for person identification. Our friends and coworkers recognize us primarily by face. ID cards, such as a passport or drivers license, bind our name, address, etc., to a photograph. Thus, even an unfamiliar person might identify us by this ”picture ID”. Given this social background, the human face is a prime candidate for biometric identification by machine. There have been many experiments reported on matching 2D portraits, and recently good performance has been achieved [9, 5]. However, automatic face matching via 2D images has difficulty with changes in pose, lighting, and scale. The advent of 3D scanners presents the opportunity to extract biometric information that is much less dependent on lighting and pose. Different methods are available for scanning and representing the human face as a collection of 6D points [x, y, z, R, G, B], where the triple [x, y, z] lies on the face surface f (x, y, z) = 0 and the triple [R, G, B] gives the color observed at point [x, y, z]. Studies from FRVT 2000 have shown that when variations in lighting and pose are introduced into a data set, the performance of 2D face recognition system degrades significantly
2. 3DID FACE VERIFICATION SYSTEM DESIGN
2.1. Performance goals The system was designed with the following goals: 1. The verification process should be no longer than 5 secs. 2. A reject rate of 5%, with immediate retry, is tolerable. 3. A false dismissal rate of 1% is tolerable in environments where personnel are also present (e.g. airports), but not when no personnel are present (e.g. at an ATM) . 4. A very low false accept rate, perhaps less than 0.1%. Considering the airport example, it may take one minute or more to complete the gate entry process at the metal detectors: there is typically a 5 second window to perform 3D
face scanning in a particular place. The retry rate in the metal detector may be more than 5%, so a similar rate at the face scanner should be acceptable. Similarly, a false dismissal rate of 1% would mean than only 1 of 100 persons would need to be interrogated by a security agent because face verification failed. The false accept rate will be very low because an imposter would have to gain access to the persons ID card and have a face that is very similar in 3D shape and texture to the stored face. Fig. 1. 3DID Matching system. 2.2. Operating assumptions For a successful verification process, we make the following assumptions: • We assume that a 3D scanner samples the face at 0.5 mm resolution, or better, in x, y, and z, and also samples face color R, G, B at each point. (Most of our algorithm tests have used only shape and no color.) • We assume that the person faces the sensor with a neutral expression and with no more than 5 degrees of yaw, roll, or pitch. (3DID proved robust to much larger rotations, as shown below.) • We assume that the face is unoccluded vertically from just below the nose tip to an inch above the eyebrows and horizontally between the ears; and free of hair, jewelry, glasses, hands, etc. (3DID will succeed even with small occlusions such as nose piercing due to the sparse surface sampling and 10% trimming.) • We assume that the face is stationary for the full time required for scanning. (This is about 2 and 4 seconds for low and high resolution with our current scanner.) If the subject’s behavior violates the assumptions, 3DID is allowed to reject the scan and ask for a retry. This rejection will not be regarded as a negative on the performance evaluation. In some cases of rejection, 3DID is able to give feedback to the subject in order to improve the repeat scan. 3. MATCHING SYSTEM 3DID uses recognition-by-alignment: the method for comparing two face scans is based on optimally aligning the surfaces and calculating the distance between them. We have developed a two-step, rigid alignment process shown in Figure 1. The rightmost display in the figure shows the two face surfaces in their optimal alignment with different shading to emphasize their interpenetration: this output has high value to a human agent (and has been entertaining to 3DID subjects and spectators). The system has been shown to be equally effective in our laboratory and in four other locations. The first step in our process is a coarse alignment using anchor points [4]. These anchor points include the nose tip, inside corners of the eyes, the mouth, chin, etc., and are detected by using a model of the structure of the face and the
curvature (second derivative) at various points. Figure 6b displays the shape index, a single value computed from the min and max curvature. Using the shape index, the nose tip is evident as a local maxima, the inner eye corners as local minima, and the nose bridge as a saddle point. The shape index array is computed by fitting a bicubic polynomial z = f (x, y) to the 9 x 9 neighborhood of each surface point and using the curvatures from that polynomial patch. Once the anchor points are detected in both the probe and gallery scans, corresponding anchor points are used to estimate a coarse, rigid transformation between the two scans. (Experimental results show that (1) detection of some anchor points is reliable, although not highly accurate; that (2) detection of one good set of 3 anchor points is highly reliable; and that (3) the subsequent ICP process is highly likely to converge correctly even with inaccurate initial alignment.) The second alignment step uses the Iterative Closest Point (ICP) algorithm to finely align the scans [1]. ICP samples a set of control points on one scan and calculates the nearest points on the second scan, then calculates a transformation that reduces the error between these point pairs. This algorithm terminates when the change in error is below a threshold or when the iteration limit is reached. A grid of 100 control points surrounding the eyes and the nose is chosen; these are areas of the face that do not vary much with changes in expression. (Our results show that this two-step alignment process is highly reliable, even when aligning the face surfaces of two different persons.) Trimming the points of comparison to the best 90 of 100 is critical because of frequent errors in reading the laser in the eyes, and because of steep steps in z near the bottom and sides of the nose. After the current and model scans are finely aligned, different metrics can be used to determine how well the scans match and whether the two face scans derive from the same person. For the current study, we are interested in the realworld accuracy of the surface matching so we consider a simple alignment measurement SAM – the final RMS matching error produced by the ICP algorithm. All SAM values are reported in millimeters and reflect the average over the 90 control points after trimming. For more information on our matching system, see [6] and [3].
4. EXPERIMENTS Our experiments evaluated the performance of 3DID using environmental parameters similar to what would be expected in the airport application. We examined the entire system endto-end, including the scanning and the matching processes. The major questions we explored were: 1. How fast are the scanning and matching processes? 2. How accurate is the ID verification process as a function of change in pose, relative to a frontal position? 3. How accurate is the ID verification process overall? 4.1. Face Scanning Our face matching system uses input from a commercial structured light scanner - the Minolta Vivid 910 [11]. The Minolta Vivid 910 scanner is commonly used in the face recognition community, and is the primary scanner used to gather 3D face data for the FRGC [7]. This system contains a standard color camera to obtain [R, G, B] reflections from the object surface. It also sweeps a horizontal plane of laser light across the object, the camera detects the laser line and triangulates the depth of the illuminated surface points. The Vivid 910 produces depth values accurate to better than ±0.5mm in low resolution mode, and to better than ±0.10mm in high resolution mode. The two different resolutions were used in the experiments described here. For face data obtained in our own lab at MSU, the Minolta Vivid 910 was set up to record a low resolution, 320x240 pixel image in less than 2 seconds. For every pixel, the scanner outputs the Cartesian coordinates [x, y, z], the color [R, G, B], and a flag value indicating whether or not the depth value could be computed. The FRGC face data provided by Notre Dame were collected at high resolution (640 x 480 pixels). Although the higher resolution potentially delivers a more accurate representation, it is also more prone to noise since the human subject tends to move during the almost 4-second scan time. Movement during the scanning process causes distortion of the image and also misalignment between depth and color images. We have used the high resolution FRGC data from Notre Dame for testing and for making comparisons with our own low resolution data processing. 4.2. Data Sets Three data sets were used for our experiments: 1. The first data set contained scans of a rigid mannequin head (Marie). The mannequin was used for its unchanging 3D surface, which we assumed would produce bestcase performance for the combination of hardware and software that is 3DID. 2. The second data set contained artificially rotated virtual scans generated from a set of over 300 real face scans
of 111 human subjects. The human scans varied some in expression, but little in pose. The virtual rotation process rotates the 3D points of a face scan in 3D space and then re-projects them onto an orthogonal plane that is parallel to the xy plane. The orthogonal projection produces a virtual scan that includes a depth map, flag map and color image similar to the data produced by the Minolta scanner. Precise pose angles can be produced and control can be maintained over the sampling rate. 3. The third data set was the FRGC1 data set obtained from Notre Dame containing 948 approximately frontal neutral scans from 275 different people. 4.3. Results of Experiments Experiments were conducted to evaluate the performance of the surface matching system under changes in stand off distance, head pose, and lighting conditions. Optimal Conditions Baseline SAM - A total of 20 scans (190 matching scores) were made of Marie in a frontal pose with constant florescent lighting. The resulting SAM values had a mean of 0.37mm, ±0.15mm. These results indicate the range of expected variation due to sensor noise, and suggest that the 3D matching system can assume that two scans matching within this range indicate a proper alignment of surfaces from the same face. We also learned that a SAM of 0.5mm is a very good matching value for two scans from a real humans face. A histogram of these SAM values for Marie is shown in Figure 2. The dotted line represents the Gaussian approximation to the histogram with a mean at 0.37mm and a standard deviation of 0.15mm. As a comparison, two more Gaussian distributions are shown next to “Marie,” one for intra-class (Genuine) SAM values and the other for inter-class (Imposters) SAM values. The “Genuine” curve is an estimation from scans taken from 111 people; in half of these scans the people were smiling. Notice that the mean of the genuine curve is slightly higher than that for Marie due to changes in expression (0.7mm±0.15). The “Imposters” curve was taken from the same 111 subjects. Notice that the SAM values for Imposters match scores are much higher (1.5mm ± 0.3). The overlap between the Genuine and Imposters curves represents the error region for 3DID using only the SAM value to make an accept/deny decision. Color and Lighting - Although skin color can be a source of identification or disguise, we have found that it rarely affects the ability to match two surfaces using SAM criteria. Changes in color, however, can affect the Minolta scanner’s ability to detect the laser, which leads to failure of the triangulation scheme and of computing the depth value. We found that washout from severe lighting inhibits the camera’s ability to detect the laser beam, as do some dark colors. These types of changes, however, usually do not prohibit our matching system from generating an acceptable SAM value.
Fig. 2. Gaussian approximation of SAM distributions. Change in Stand Off Distance - The Minolta Vivid 910’s operating stand off for the medium distance lens is reported to be between 0.6 and 2.5 meters. We tested the system with the distance between the camera and the subject varying from 0.35 to 3.05 meters. The system found no valid points on the face when the distance was below 0.5 meters and above 2.9 meters. The closest viable distance for Marie to the scanner was found to be 0.65 meters. At this distance the matching SAM was measured to be 0.41mm. As the distance increased, the SAM increased at an almost linear rate, and increased to 1.1mm at the largest offset. Pose Variation - Another experiment tested the effects of changing the relative pose (yaw, pitch, and roll) angle between the face and the camera. Marie was mounted on a tripod and the origin of this coordinate system was at the base of her neck. Typical results of the pose experiments are shown in Figure 3. Data points for Marie represent an average of 5 scans, while our virtual rotation results are averages of 300 scans for each rotation angle. These experiments show that our face matching system can easily tolerate rotations (yaw) of up to ±30 degrees from frontal. Changes in pitch and roll were not as well tolerated (±10 degrees).
3D matching performance based on PCA (similar to [10]) is also available for this data set from the University of Notre Dame. In this baseline algorithm, both the color and depth components of the face scans are normalized to a standard width and height using the manually selected points at the center of the eyes. Once the images are normalized, the PCA algorithm is applied to both data channels independently and the matching results are reported. Figure 4 shows the ROC curves produced by the baseline algorithm and our 3DID algorithm. The Notre Dame baseline algorithm has an EER of 4.6% and our algorithm has a baseline EER of 3.8% on the same database. Our matching algorithm performs much better for low values of the false positive rate. Many of the errors on the top end of the ROC curve are due to incorrect detection of the anchor points. In fact, the 3.8% EER includes only 23 False Reject errors. One of these scans is missing its depth data, and the other 22 errors are due to bad anchor points in the same 15 scans. These error rates demonstrate some of the difficulty with this testing method: a single error in anchor point detection on a single scan can propagate and cause misleading results. In a real application, it would be better to automatically identify and reject some of the bad scans and have the subject rescanned.
Fig. 4. ROC curves for the FRGC 1.0 Data.
4.4. Automatic Rejection Option
Fig. 3. Change in Yaw vs. SAM. Human Frontal Data - In the final experiment, our algorithm was evaluated on the FRGC 1.0 database. A baseline
3DID contains a rejection algorithm based on the symmetry of the face; it uses ICP to align the current scan with a mirror image of itself. If the anchor points are not found correctly, then the SAM between a scan and its mirror image will likely be high. However, if the anchor points are found correctly, then the SAM score will be quite low. Using this assumption, we designed a rejection criteria that rejected 1.5% of the 948 scans. Only 1 good scan was incorrectly rejected and 2 bad scans were not rejected. After implementing the reject option, the ROC was recalculated and an EER of 1.2% was achieved.
5. 3DID PROTOTYPE INTERFACE The prototype program is a specific aspect of the 3D Research Platform that runs on Windows. The prototype program is designed to gather data using the VIVID 910 and demonstrate the viability of using 3D face matching in a practical system. The three main features of the prototype are: 1. Data are gathered using the VIVID 910 in fast mode. 2. The practicality of the matching algorithm is demonstrated by using the SAM matching score and symmetry reject option in real-time. 3. Different visualization methods are provided to demonstrate how the data is processed and what the algorithm is doing. A subject stands in front of the camera and must hold still for about 2 seconds to capture a scan. (Often the user is instructed to provide a neutral, or poker, face or a slight smile.) Figure 5 is a flow chart of the operation of the prototype system. Many additional features have been incorporated into the prototype to increase functionality, such as keyboard shortcuts, batch process capabilities and the ability to turn different aspects of the matching algorithm “on” or “off.”
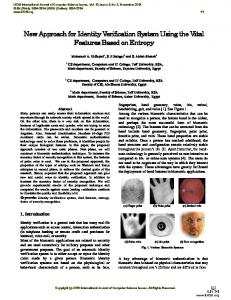
5.1. Matching Algorithm The matching algorithm takes two scans (a model and a query) and aligns them as described in Section 3. Figure 7 shows the four windows that appear when executing the matching algorithm. Figure 7b shows the model scan with the 100 control points selected from the query scan. The green control points represent the untrimmed points, and the blue circle around each control point represents the current alignment error for that point (1 pixel in radius is approximately one millimeter between the surfaces). Another window (see Figure 7c) shows a histogram of these errors (all distances above 3mm are put into the 3mm bin). Figure 7d is a bar graph representing the current SAM score. The vertical line indicates the threshold value. A matching score to the right of the vertical line indicates an impostor (bar is colored red), while a matching score to the left of the vertical line indicates a match (bar is colored green). The matching algorithm compares the model to the query and the query to the model and reports the lower of the two scores; if the first match is very low, the second match will be bypassed. A final display will appear either accepting or rejecting the subject. 5.2. Data Visualization Once a scan has been taken or loaded from a file, it is displayed on the main prototype window (see Figure 7a). The main window has a tool bar for executing the main system commands and setup parameters. By default, the image is displayed with the automatically detected anchor points, which can be toggled on and off. The flag values can also be toggled on to indicate where the scanner did not pick up any valid data. In addition to the color image, the depth map, shape index and surface normals can also be displayed. Any of the main window visualization modes can be exported to an image file or exported directly into a VRML file, which will be displayed immediately using an external VRML viewer, as shown in Figure 6. This gives the system the ability to output models that can be rotated in 3D.
(a) Depth Map
(b) Shape Index
(c) Color Space (blue to red)
Fig. 5. Flow chart representing the operation of the prototype 3D face verification system.
Fig. 6. 3D VRML viewer with color, depth, shape and normal data representations.
(a) Main Window With Flag Values Showing.
(b) Model Scan with Control Points
(c) Point Error Histogram
(d) Current SAM
Fig. 7. Matching algorithm visualization. 6. CONCLUSIONS In this paper, we have described a commercial system prototype, its hardware and software, and the results of using it. In our 3DID project, we have performed many experiments in person verification and have developed several algorithms and software tools. To date we have ourselves taken several hundred scans from about 300 subjects, and we have used hundreds of scans from the Notre Dame test set. We have tested the system in several buildings, outside, and in a tent. Specific results of testing the performance of the 3DID prototype are as follows. 1. Most color and lighting changes did not adversely affect the 3D face matching system. 2. Under optimally controlled baseline operating conditions, the SAM values are 0.37mm ± 0.15mm. 3. Our face matching system can tolerate rotations (yaw) of up to ±30 degrees from frontal. Changes in pitch and roll are not as well tolerated (±10 degrees). 4. Using the SAM as a matching metric can produce reasonable results (3.8% EER) on a large data set. 5. Using a rejection option to remove poor quality scans improves the EER to 1.2% (at a rejection rate of 1.5%). Our testing demonstrates that the SAM can be used as a matching score to achieve equal error rates of 1.2% for frontal, neutral expression scans. This error rate and the speed of our system are acceptable for some biometric applications, and in particular meet the target requirements for the airline application. We argue that the 3DID system displays are of great value to human agents, either for immediate identification purposes or for delayed analysis offline. Current 3D scanners are still too expensive (about $50k) for widespread application. We hope to take part in the development of a combination structured light and stereo system that could produce a faster scanner in the $5k range. We are also working on improvements to all aspects of our algorithms – better anchor point detection algorithms, better reject/rescan
algorithms, and more advanced matching techniques (including the use of color), in order to achieve even better performance. 7. REFERENCES [1] P. J. Besl and N. D. McKay. A method for registration of 3-d shapes. IEEE Transactions on Pattern Analysis and Machine Intelligence, 14(2):239–256, 1992. [2] V. Blanz and T. Vetter. Face recognition based on fitting a 3D morphable model. IEEE Transactions on Pattern Analysis and Machine Intelligence, 25(9):1063–1074, 2003. [3] D. Colbry. Human Face Verification by Robust 3D Surface Alignment. PhD thesis, Michigan State Unviersity, 2006. [4] D. Colbry, G. Stockman, and A. K. Jain. Detection of anchor points for 3D face verification. In Proceedings of Workshop on Advanced 3D Imaging for Safety and Security, San Diego California, 2005. [5] S. Z. Li and A. K. Jain, editors. Handbook of Face Recognition. Springer Verlag, 2005. [6] X. Lu, A. K. Jain, and D. Colbry. Matching 2.5d face scans to 3D models. IEEE Transactions on Pattern Analysis and Machine Intelligence, 28(1):31–43, 2006. [7] P. J. Phillips, P. J. Flynn, T. Scruggs, K. W. Bowyer, J. Chang, K. Hoffman, J. Marques, J. Min, and W. Worek. Overview of the Face Recognition Grand Challenge. In Proceedings IEEE Conference on Computer Vision and Pattern Recognition, 2005. [8] P. J. Phillips, P. Grother, R. J. Micheals, D. M. Blackburn, E. Tabassi, and M. Bone. Face Recognition Vendor Test (FRVT), overview and summary. Technical report, National Institute of Standards and Technology, 2003. [9] M. Savvides, B. V. K. V. Kumar, and P. K. Khosla. Eigenphases vs. eigenfaces. In Proceedings of the International Conference on Pattern Recognition, volume 03, pages 810– 813, Los Alamitos, CA, USA, 2004. [10] M. Turk and A. Pentland. Eigenfaces for recognition. Journal of Cognitive Neuroscience, 3(1):71–86, 1991. [11] Vivid910. Minolta vivid 910 non-contact 3D laser scanner. http://konicaminolta.com/products/instruments/vivid/vivid910.html, 2005.