Multi-Biometrics Fusion for Identity Verification Chang Shu, Xiaoqing Ding State Key laboratory of Intelligent Technology and System, Department of Electronic Engineering, Tsinghua University, Beijing 100084, P. R. China
[email protected] Abstract In this paper, we accomplish matching score level fusion of multi-biometrics. In order to solve the incomparability among different classifiers’ outputs, Adaptive Confidence Transform (ACT) is introduced to convert the raw outputs of different classifiers to the estimates of posteriori probabilities conforming to different users. These posteriori probabilities are then combined using several fusion methods. Experiments conducted on a database (including face, iris, online signature and offline signature traits) of about 100 users indicate that for the same fusion method, ACT based normalization generally results in better verification performance and is more robust compared to other normalization methods. Effects of different normalization and fusion methods on combination of “strong” and “weak” classifiers are also examined.
1. Introduction Multi-biometrics verification systems consolidate the evidence presented by multiple biometric sources, and are expected to be more robust to noise, address the problem of non-universality, improve the matching accuracy [1], and provide reasonable protection against spoof attacks. In this paper, we focus on fusion at the matching score level due to the ease in accessing and combing matching scores. The classification systems usually operate in different measurement spaces, and consequently, the matching scores generated by different modalities are heterogeneous. For example, in this paper, the face classifier outputs a similarity measure; the iris classifier outputs a distance measure; the online and offline signature classifiers are themselves multimodal systems, and output posteriori probabilities [2]. Thus, normalization is required to solve the incomparability among different classifiers’ outputs.
Compared to other classifiers, iris classifier is relatively a “strong” one. In this paper, the verification performance on the combination of multiple “weak” classifiers as well as on the combination of one “strong” classifier with multiple “weak” classifiers are both studied under different normalization schemes and fusion strategies.
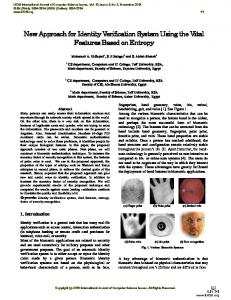
Fig.1. Samples in CIDIP database: (a) face, (b) iris, (c) online signature, (d) offline signature
2. Score normalization The Min-Max and Tanh methods are well-known normalization methods, and generally give a good performance [3,4]. They map raw scores to [0, 1] and (0, 1) range, respectively. u − min(U ) . Min-Max (MM): v = max(U ) − min(U ) Tanh (TH): v =
1 (u − mean(U )) tanh 0.01 + 1 . 2 std (U )
Note that u is a raw matching score, U is the set of all scores for that matcher, and v is the corresponding normalized score. The operators mean(i) and std (i) denote the arithmetic mean and standard deviation operators, respectively.
3. Adaptive Confidence Transform In this section, we present the Adaptive Confidence Transform method [5], according to the theory of Classifiers’ Confidence Analysis. Suppose M is the number of matchers; N is the number of individuals in
0-7695-2521-0/06/$20.00 (c) 2006 IEEE
the database, which means there are N pattern classes ( ω0 , ω1 , , ωN , respectively). For an input training sample X = ( x1 , x2 , , xM ) , xi is assumed to be the measurement vector used by the i th component matcher. If the matcher output distance (similarity) measure, we denote the matching distance (similarity) between xi and the template measurement vector of ω j in the database as d j ( xi ) ( s j ( xi ) ). The ACT method consists of two steps to transform a raw matching score d j ( xi ) ( s j ( xi ) ) to a posteriori
matcher outputs of testing sample V. The fused score for sample V is denoted as f (V ) . M
Simple-Sum (SS): f (V ) = ∑ vi . i =1
M
Weighted-Sum (WS): f (V ) = ∑ wi vi , i =1
where wi is the weight assigned to the i th matcher. In a similar way as used in [6], we calculate wi as wi =
probability (confidence) p(ω j | xi ) . Step 1: compose generalized confidence g (ω j | xi ) from the raw matching score by d j ( xi ) , (k = 1, 2, , N ) (1) g (ω j | xi ) = 1 − min(d k ( xi )) k≠ j
or, g (ω j | xi ) = 1 −
max( sk ( xi )) k≠ j
s j ( xi )
, N)
(2)
probability p(ω j | xi ) by p(ω j | xi ) = f ( g (ω j | xi )) . Suppose (i) all the training raw matching scores have been transformed to generalized confidence, (ii) the domain of generalized confidence is T , (iii) X is a sample in the training sample set St ( X ∈ St ). Let y = g (ω j | xi ) . For ∀y ∈ T , choose a small closed set [ y − δ , y + δ ] . The mapping function f ( y ) can be calculated as follows: N
∑count({X | X ∈S and g(ω | x )∈[y −δ, y +δ] and X ∈ω }) j
i
j
N
∑count({X | X ∈S and g(ω | x )∈[y −δ, y +δ] }) t
j
M − 2∑ E j
, (i = 1, 2,
,M) ,
(4)
j =1
where Ei is the EER of the i th matcher. Obviously, M
∑w i =1
i
= 1 , and wi is inversely proportional to the
corresponding Ei , ∀i . Product (Pr): f (V ) = ∏ vi i =1
X belonging to class ω j . (1) ((2)) is used when the raw matching score is a distance (similarity) measure. Step 2: construct mapping function f ( y ) to map the generalized confidence g (ω j | xi ) to the posteriori
t
M
M
, (k = 1, 2,
where g (ω j | xi ) is the generalized confidence of input
f (y) = j=1
1 − 2 Ei
(3)
i
j =1
where function count (i) counts the number of elements in a set. In practice, we choose a series of discrete points y1 , y2 , , in domain T and calculate f ( y1 ), f ( y2 ), , respectively. For other values of y , f ( y ) can be estimated through interpolating or fitting.
4. Biometric fusion Simple-sum, weighted-sum, as well as product rule are well-known combination rules for measurement level fusion. Suppose v1 , v2 , , vM is normalized
Fisher discriminant analysis, linear SVM and RBF SVM are common classification methods for binary classification problem. The RBF kernel used in SVM can be expressed as K ( X , Y ) = exp ( −γ X − Y ) , (5)
where γ is a parameter. In our experiment, 0.4 is empirically chosen as the value of γ .
5. Experimental results The multi-biometrics database (samples are shown in Fig.1) used in our experiments was constructed by merging 4 separate databases collected in CIDIP (Center of Intelligent Image and Document Information Processing) in Tsinghua University using different sensors and over different time periods. About 25 face images were obtained from every user in a set of 115 users. 10 iris images were obtained from each eye of every user in a set of 140 users. About 30 genuine and 30 impostor online signatures were obtained from every user in a set of 83 users. More than 500 offline characters were obtained from every user in a set of 91 users as offline signature samples. Based on the mutual independence assumption, and a random assignment, we use 2432 genuine scores and the same number of impostor scores from each biometric modality to construct a genuine score matrix (2432 × 4), where each row represents a virtual genuine sample, and an impostor score matrix (2432× 4), where each row represents a virtual impostor sample. 60% of these genuine and impostor samples are used for training, while the rest are used for testing.
0-7695-2521-0/06/$20.00 (c) 2006 IEEE
The normalization and fusion operations are carried out using the generated virtual sample sets mentioned above. The performance of individual matchers and different (normalization, fusion) permutations are presented via EER or TER (FAR + FRR) values, and Receiver Operating Characteristics (ROC) curves.
5.1. Fusion without iris modality Because of the high verification rate of the standalone iris classifier (sometimes EER=0), it is difficult to compare different normalization or fusion schemes using EER or ROC curves. In this section, we only carry out fusion operations on face, online signature and offline signature biometrics. The EER values for the three individual classifiers are found to be 3.08%, 4.21%, and 5.40% on the testing virtual sample sets of 1946 (4864×40%) virtual samples. Table 1 shows the EER values for all possible permutations of (normalization, fusion) methods on the testing virtual samples mentioned above. The lowest EER values in individual rows and columns are indicated with bold typeface and star (*) symbols, respectively. “ACT+TH” is a combined method, which applied ACT normalization scheme before TH normalization scheme. Table.1. EER values for different permutations (%)
As seen in Table 1 and Table 2, all of the fusion methods lead to better performance than any of the individual classifiers. Generally speaking, ACT based normalization methods outperform other normalization methods; SVM and fisher classification methods outperform other fusion methods; SS and WS combination fusion methods also have excellent performance after ACT normalization is applied.
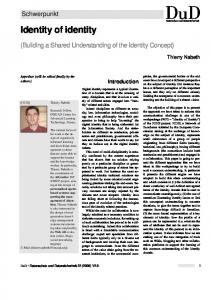
Fig.2. Effects of normalization methods on system performance for WS fusion
Fusion Method
Normalization Method
SS
WS
PR
None
0.41
0.51
1.64
0.31
MM
0.26
0.31
1.28
0.31
Fisher
TH
0.21
0.21
0.31
*0.21
ACT
*0.10
*0.10
0.62
*0.21
ACT+TH
0.21
0.21
*0.21
*0.21
Table.2. TER values for different permutations (%)
Fig.3. Effects of fusion methods on system performance for ACT normalization
Fusion Method
Normalization Method
SS
WS
PR
Fisher
SVM(L)
SVM(R)
None
0.93
1.03
3.29
1.23
0.21
0.62
MM
1.44
1.44
2.67
1.23
0.77
0.57
TH
0.31
0.31
1.54
*0.93
0.26
*0.21
ACT
*0.21
*0.21
*0.82
1.03
*0.10
*0.21
ACT+TH
0.41
0.41
1.03
1.03
0.26
0.26
Table 2 shows the TER values for all possible permutations of (normalization, fusion) methods. SVM(L) denotes linear SVM and SVM(R) denotes RBFSVM. The TER values for the three individual classifiers are found to be 6.06%, 9.56%, and 12.23%, respectively.
5.1.1. Normalization. Fig.2 shows the ROC curves for the three individual classifiers, as well as the effect of each normalization method on the system performance for WS fusion method. For normalization methods that are not based on ACT, the weights assigned to the three classifiers are 0.339, 0.336 and 0.325, respectively. For ACT based normalization methods, the weights assigned to the three classifiers are 0.344, 0.334 and 0.322. Obviously, ACT based normalization methods tent to give heavier weights on more accurate classifiers. From Table 1, Table 2 and Fig.2, we see that ACT based normalization methods lead to better performance than other methods. Note that ACT based normalization methods are not always available. For classifiers that only provide the best matching result of
0-7695-2521-0/06/$20.00 (c) 2006 IEEE
input biometric feature and template feature in database, we can not convert raw scores to generalized distances, and hence cannot apply ACT based methods. 5.1.2. Fusion. Fig.3 shows the ROC curves for the three individual classifiers, as well as the effect of each fusion method on the system performance for ACT normalization methods. From Table 1, Table 2 and Fig.3, we see that linear SVM lead to the lowest TER with almost any normalization method. Fisher discriminant analysis and WS method perform almost equally well for ACT based normalization methods.
5.2. Fusion with iris modality For fusion with the “strong” iris classifier, we simply calculated the TER. The TER values for the four individual classifiers are found to be 0.10%, 6.06%, 9.56%, and 12.23%, respectively. TER values for all possible permutations of (normalization, fusion) methods are calculated and shown in Table 3. Table.3. TER values for different permutations (%)
6. Conclusions In this paper, the effects of different score normalization techniques and fusion methods on system performance have been examined. Our work shows that for “weak” classifiers, fusion leads to much lower error rate than individual classifiers alone; for “weak” classifiers with “strong” one, fusion leads to more robust performance than the individual “strong” classifier. Experimental results also show that normalization methods based on ACT are generally better and more robust than others. Our analysis of normalization and fusion methods suggests that for verification applications that ACT normalization method is not available, classification approaches such as linear SVM or fisher discriminant analysis can be employed; for applications that have requirements on FAR or FRR, SS or WS methods can be used for fusion; for applications that do not have requirements on FAR or FRR, linear SVM method is the best choice; for applications that need to combine “weak” classifiers with “strong” one, ACT normalization followed by fisher discriminant analysis is expected to give a good performance.
Fusion Method
Normalization Method
SS
WS
PR
Fisher
SVM(L)
SVM(R)
None
0.31
0.31
2.77
0.21
*0.00
*0.00
MM
0.21
0.21
0.51
0.31
*0.00
*0.00
TH
0.10
0.10
0.21
0.10
*0.00
*0.00
ACT
*0.00
*0.00
0.72
*0.00
*0.00
0.05
ACT+TH
*0.00
*0.00
*0.10
*0.00
0.05
0.05
(a)
(b)
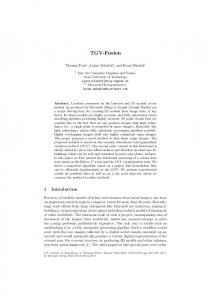
Fig.4. Distribution of scores: (a) original iris scores, (b) (ACT, fisher) fused scores Distribution of genuine and impostor scores for (ACT, fisher) methods that give the lowest TER values is shown in Fig.4b. Distribution of original iris scores (without normalization) is also shown for comparison (Fig.4a). From Fig.4 we see that the range of threshold values that can be selected for high verification rates is larger for the fusion system compared to the individual iris classifier. Fisher discriminant analysis lead to the lowest TER and larger range of thresholds which result in high accuracy is more robust than other methods.
References [1] L. Hong, A.K. Jain, S. Pankanti, “Can multibiometrics improve performance”, Proceedings of IEEE Workshop on Automatic Identification Advanced Technologies, NJ, USA, 1999, pp. 59-64. [2] Xianliang Wang, Xiaoqing Ding, “An Effective Writer Verification Algorithm Using Negative Samples”, Proceedings of the 9th Int’l Workshop on Frontiers in Handwriting Recognition (IWFHR-9 2004): 509-513. [3] A.K. Jain, K. Nandakumar, A. Ross, “Score Normalization in Multimodal Biometric Systems”, Pattern Recognition 38 (2005): 2270-2285. [4] R. Snelick, U. Uludag, A. Mink, M. Indovina, A.K. Jain, “Large-Scale Evaluation of Multimodal Biometric Authentication Using State-of-the-Art Systems”, IEEE Trans. PAMI, 2005, 27(3): 450-455. [5] Xiaofan Lin, Xiaoqing Ding, Ming Chen, Rui Zhang, Youshou Wu, “Adaptive Confidence Transform Based Classifier Combination for Chinese Character Recognition”, Pattern Recognition Letters,vol.19, 1998, pp. 975-988. [6] Y. Wang, T. Tan, A.K. Jain, “Combining Face and Iris Biometrics for Identity Verification”, Int’l Conf. on AVBPA, 2003: 805-813.
0-7695-2521-0/06/$20.00 (c) 2006 IEEE