Pune, Maharashtra, India. Abstractâ ... There are very few companies working for automation of the error finding in the gear .... The Windows operating system and further software development using the Visual Studio (in any of the version),.
Volume 4, Issue 11, November 2014
ISSN: 2277 128X
International Journal of Advanced Research in Computer Science and Software Engineering Research Paper Available online at: www.ijarcsse.com
Mathematical Modelling and Interface Design for Gear Error Testing Dr. Manoj Devare Associate Professor, Department of MCA P K Technical Campus, Pune, Maharashtra, India Abstract— This work gives two major contributions that is software user interface design, and the automation of the gear testing data. This work is having the real time data handling, which is received from the sensors and handling the pulses converted into the digital formats of the data. This system is not only providing the effective input screen design but also the meaningful output reports. Generation of the output reports and graphs requires the principals and standard graphics theory based algorithms for plotting the graphs for the tracing the rotational motion of the gear. The linear and circular graphs have been drawn to indicate the different errors such as backlash and pitch errors. It is necessary to have the knowledge of the interfacing of the sensors to the hardware unit, in the field of mechatronics. This work is simple case study and mathematical model for graph plotting from the rotational motion to the linear graphs for different scales and proportions. This piece of work also shares the experiences while automation of the gear error discovery techniques and interfacing of the hardware data. Keywords— Automation, Gear Testing, pitch error, PLC, mechatronics, rotary encoder. I. INTRODUCTION The proposed system is automation of finding out the errors in the gears. The gears can be of the any material like metals iron, steel, copper, mixed metals as per the requirements in the different areas of the mechanical engineering equipments like cars, automobile, or any other power transmission requirements. The different types of gears like worm wheels used in ships, and application areas. Sometimes the train of gears are useful in little type of applications. Like, toys for the kids require the gears of plastic or smooth material. Different types of arrangements are found in motorcycle, bicycle, car etc. Like rack and pinion [7][8] arrangement, or shaft with a toothed wheel for transmission of the power from one to another. The gear manufacturing process needs raw material like metals plates should go through heating, grinding crushing, and oil treatment etc. There are several Industrial applications of the soft computing and Mechatronics described by Dote Yasuhiko [6]. The geometrical shape of the gear usually having the centre and toothed wheel most of the time. The improper crushing of the tooth may not transmit the power in as per the requirements. The balanced power transmission is required to avoid further damages. Think that, in case of car gear, not crushed as per the requirement and the driver is pushing the accelerator of the car, resulting the running of the car either faster causing the accidental cases. Hence the errors in any of the power transmission are not acceptable. There are different types of errors[11][12] like composite errors, pitch error, flank line error, run out errors with values from tooth to tooth, tangential, adjacent, and cumulative type of errors. The accuracy in the gear design [9][10] should be up to micron, not more than microns.
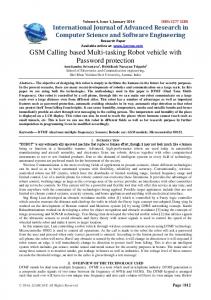
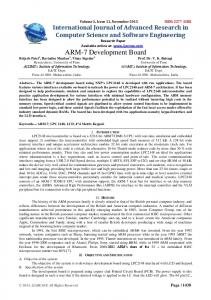
Fig. 1: The proposed system for software interface of gear testing The proposed model for gear error testing as shown in block diagram Figure 1. The proposed system is automation of the finding the errors in the gears. There are very few companies working for automation of the error finding in the gear manufacturing process. The conventional testing may not provide the sufficiently enough information to improve the quality in the manufacturing process. The alternative CNC machines are options, but it is expensive. The gear manufacturers may not be same as the actual instrument manufacturer, where it will be used. Hence, errors and © 2014, IJARCSSE All Rights Reserved
Page | 795
Devare, International Journal of Advanced Research in Computer Science and Software Engineering 4(11), November - 2014, pp. 1-6 permissible tolerance values could be sent as a report for further logistics process and complaint handling. However, the further problems and complaints sorting out must need the historical data. The single flank gear rolling test method is used here. As shown in the figure 1, the gear testing machine is having arrangement of motors running with the electricity supply. The arrangement of the gear is having shaft connected to the motor. The motor is driving to the shaft. The shaft is meshed with the toothed wheel. To find out the rotational motion and the power transmission the necessary equipments are encoder with certain pulses per rotation (PPR). We cannot store the analogue data directly into the primary memory of the Computer. Hence, the separate hardware is required with all necessary primary memory, EPROM, cache, processor etc. In the market there are several small units are available like PLC, having the built-in microprocessor mathco-processor. The data in the PLC can be fetched from its memory and used to plot the graph. The graphs can be linear or in circular fashion. The rotational motion starts from zero degree and ends on the 360 degree and so on. The irregularity in the linear graph shows the error in the tooth of the gear. There are several types of encoders and sensors available in the market for different accuracies and different purposes of the task. As shown in the figure 1, the gear testing machine connected to the encoder (working like transducer), sometimes connected to the adjustable unit (Executable), and connected to the PLC controller. Encoders are sensing devices for the rotational motion of the gear. The timer based real time execution program written in Visual Basic is written with the help of application programming interfaces (API). For windows based system the dynamic link libraries (DLL) are useful for using APIs.
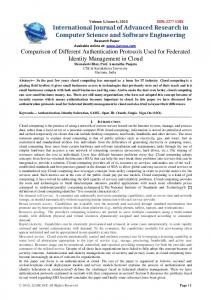
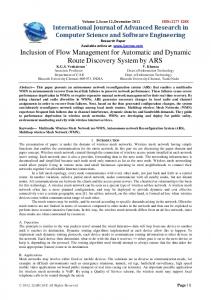
Fig 2: Gear Error Testing System As shown in figure 2, the offering, that is the functional requirements offered by the system, are shown here. The system providing the different manual input, tolerance values, machine and hardware setup data. The system is also providing the opening test done in the past. It also shows the details of the person who did the testing. The graphical report generation and printable format reports can be generated from the system. This work representing the user interface design and the mathematical modelling of the graph plotting for the rotational motion to the linear and circular shapes. This work is not discussing the encoder interfacing knowledge and installation of such any instruments. This contribution is in the field of human computer interaction [5], design phase of software engineering, and graphics concepts for the point plotting. In this new system, the operator does not have to specify the starting and ending point of the gear. Here, the screw threads mesh with the worm wheel with wider diameter. The centre bore is mounted on a shaft. II. GRAPHICAL USER INTERFACE DESIGN The user interface is designed with special purpose because the users of the software are mixed type perhaps less educated, workers with qualifications as Industrial Training Institute (ITI) course holder or fully qualified Engineers either experienced or less experienced. To make the data available to the users on one screen and simple ease of use, the four sections of the screen have been done. The group of the parameters are shown in the different section of the screen. Describing that the label control is used and the “tab” is used to move from one parameter to another. The “Next” and “Previous” button is given to move back and forth to enter the values. From software engineering point of views, the Graphical User Interface Design principals can be followed as the golden rules [1] [5]. As far as the background of the user of the software is considered as control the user activities, © 2014, IJARCSSE All Rights Reserved
Page | 796
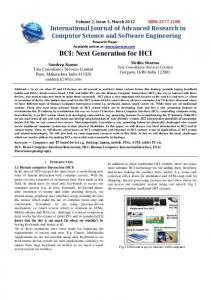
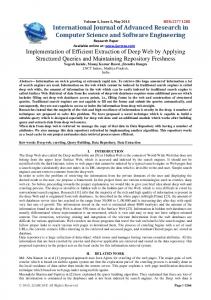
Devare, International Journal of Advanced Research in Computer Science and Software Engineering 4(11), November - 2014, pp. 1-6 reducing the memory load of the user (do not have to memorize the things), and making the interface consistent. Hence the gear testing screen is designed as shown in the figure 3. The input GUI is divided into four parts. The top left quadrant is useful to show the general information of the testing. The Right top corner is useful for the considering the testing parameter. The bottom left quadrant is showing the machine set up data. The hardware may change in the future, because the advances in the research in the field of sensors, may replace the existing hardware with new type of hardware. Hence the hardware related data should be stored in separate table of the database. The bottom right part of the screen can be useful to input the tolerance values. By considering the four parts of the screen the golden rules of the GUI design are followed and success in the basic objective of software design can be done. Basically, the task of taking the input here is done by two ways. The input design has to handle the input from the nowise users. Secondly, the input from the encoders connected to the machine needs the input data handling called data acquisition. The manual data input process is controlled by entering the values in edit text box, and next parameter can be entered by using the next button. Here advantage is due to use of the tab and pressing the “next” and “previous” button. The different parameters are shown on the screen using “Label Control” of Visual Basic. The parameter in the consideration for input or update can be highlighted with different colour. Here the interface design is done in such a way that the computer jargons and difficult terminologies were avoided. [2] Header of the window
General Section
Testing Parameters
Parameter1 : Value1 Parameter2 : Value2 Parameter3 : Value3 Parameter4 : Value4 Parameter5 : Value5
Parameter1 : Value1 Parameter2 : Value2 Parameter3 : Value3 Parameter4 : Value4 Parameter5 : Value5
Hardware Related
Permissible Values
Parameter1 : Value1 Parameter2 : Value2 Parameter3 : Value2 Parameter4 : Value3 Parameter5 : Value4
Parameter1 : Value1 Parameter2 : Value2 Parameter3 : Value3 Parameter4 : Value4 Parameter5 : Value5
Fig. 3: The screen design for the gear testing III. GENERATING GRAPHICAL OUTPUT REPORTS The Windows operating system and further software development using the Visual Studio (in any of the version), either .Net framework or without .net Framework, have principal of the What-you-see-is-what-you-get (WYSIWYG) Principal. The Windows forms are available in different units of plotting and placing the components on the Frames/ Windows. For example, Centimeter, milimeter, twips, pixels etc. are the available units for the graphical shapes drawing. The Windows OS is useing the message passing communication in the different components of the software design and implementation. Here the problem statement is to trace the linear graphs of the complete 360 degree of the wheel rotation. As well as the circular graphs (similar to the Bresenham’s algorithm) are necessary to show the errors in the gear. It has been observed that machine operator, uses the white colour Chalk to marks the teeth of the gear wheel, as soon as the difference in the shape of the linear graph is found on the screen at the real time. Hence the real time graph plotting is necessary. As soon as the data comes in the memory of the PLCs, the computer timer can fetch it and store it into the simple text file. One can wonder that, why the database is not used to store the data fetched from the PLCs. The reason is the reading and writing of the data from the simple file is faster than database tables. Interestingly, the PLCs are having very limited amount of memory, and having the memory structure with valuable number of bits, in each of the variables of the memory. Programming in the PLC is similar to handle the pointers in C or C++. More than one PLC programs can be embedded and executed simultaneously, as per the requirements, in the hardware of the supporting device. © 2014, IJARCSSE All Rights Reserved
Page | 797
Devare, International Journal of Advanced Research in Computer Science and Software Engineering 4(11), November - 2014, pp. 1-6 The Pythagorean Theorem in Cartesian coordinates as the addition of the square of differences of the x co-ordinates and the square of differences of the y co-ordinates is equal to the square of the radius. Similarly, the parametric polar form of the circle equations, and midpoint circle algorithms were useful [4]. Similarly the other conic section equations for curve tracing and the ellipse, and hyperbola. IV. MATHEMATICAL MODELLING OF THE GRAPH PLOTTING This mathematical modelling is for the purpose of graphical mapping for graph plotting and discovery of different errors in the wheel. The following formulas are useful for plotting the different point on the screen, with respect to the meshing of the shaft and gear wheel. The formulas are generalized in such a ways that the analogue signals from the encoder to the (which ever could be used in the system), and the analogue to digital converter unit generating the pulses. Basically, the exact values of the pulses can be stored and processed at the Computer installed. Circumference = π * D Circumference = (22/7 ) * D Diameter = Diameter (in millimetre) Diameter = D * 1000 (Micron) The encoder produces the pulses as represented as following equations.. 1 Revolution = Number of pulses from Encoder * Number of EXE Unit Pulses 1 Revolution= 360 Degree 1 Revolution= 360 * 60 * 60 Seconds 1 Revolution= 1296000 Seconds Relation between Second and Micron representation by, 1 Revolution= Circumference 129600 Second = π * D * 1000 (Micron) Hence: 1 Second = (π* D * 1000)/ 1296000 ................................................................(1) 1 Micron= 1296000/ (π * D * 1000) Relation between Second and Pulse 1 Revolution= Number of pulses from Encoder * Number of EXE Unit Pulses 1296000 Second = Number of pulses from Encoder * Number of EXE Unit Pulses 1 Second= (NO. of pulses from Encoder * NO. of EXE Unit Pulses )/ 1296000 Pulses. ..................(2) 1 Pulse = 1296000 / (NO. of pulses from Encoder * NO. of EXE Unit Pulses ) Second Relation between Pulses and micron From Equation 1 and 2, 1 Second = π* D * 1000/ 1296000 (Micron) ....................................................(3) 1 Second = (36000* 25 * 4) / 1296000...........................................................(4) From equation 3 and 4 1 Second = (π * D * 1000) / 1296000 (Micron) 1 Second = (NO. of pulses from Encoder * NO. of EXE Unit Pulses ) / 1296000 Pulses (π* D * 1000) = (NO. of pulses from Encoder * NO. of EXE Unit Pulses ) ( π * D) Micron = 3600 Pulses 1 Pulse =( π * D) / 3600 Micron 1 Micron= 3600 / (π * D) Pulses This results into following useful formulae 1 Second = (π * D* 1000) /1296000 (Micron) 1 Micron = 1296000/ (π * D* 1000) Second 1 Second = (NO. of pulses from Encoder * NO. of EXE Unit Pulses ) / 1296000 Pulses 1 Pulse = 1296000/ (NO. of pulses from Encoder * NO. of EXE Unit Pulses ) Seconds 1 Pulse = (π * D) / 3600 Micron 1 Micron = 3600/ (π * D) Pulses For Programming Reference 1 mm= 56.7 Twips 1 mm = 1000 Micron 1 Micron= 56.7/ 1000 Twips = 0.0567 Twips © 2014, IJARCSSE All Rights Reserved
Page | 798
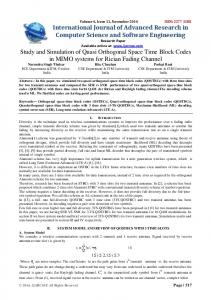
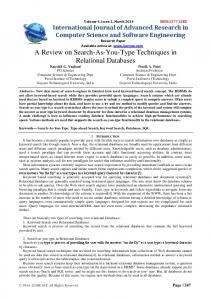
Devare, International Journal of Advanced Research in Computer Science and Software Engineering 4(11), November - 2014, pp. 1-6 The Figure 4 shows the real time graph plotting. The rising spike shows the error in the gear, and consequently needs some more work to make proper shape in the teeth. This is the complete picture of the 0 degree up to 360 degree, i.e. one rotation.
-----------From zero degree to 360 degree------- Fig. 4: The spike shows the tooth is not properly crushed. The graph shown in the figure 5 is showing the toothed wheel as its shape in the circle. We have used the timer services available from the Windows 32 programming APIs available in different DLLs. The programs should be written in such a way that, the values should be catch in such a way that, the user should feel it’s a real time graph plotted on the screen.
Fig. 5: The circular graph for displacement of the centre of the gear. V. CONCLUSION AND SUMMARY Creating the GUI screens for input and output for the real time systems need the special arrangement of the components on the screen, to keep the control of the user in hand. The precise knowledge of the hardware units and their sensory data capturing is required to frame the challenging software like the case study produced here. It is the field of combination of Mechanical and Electronics Engineering. The graph plotting in the real time system requires to having typical skill of mathematical terms and this work presenting the scenario is happening in relation with the tracing out the stuff. This contribution is for the automation of the testing of the gear errors. REFERENCES [1] Pressman Roger (2010) “Software Engineering A Practitioner’s Approach”, Tata McGraw Hill Publication. Sixth Edition, pp. 357-371. ISBN 978-0-07-070113-7. [2] Whitten Jeffrey L, Lonnie D Bentley (2011) “System Analysis and Design Methods”, 7 th Edition, McGraw Hill, pp. 582-605. [3] Mall Rajib (2009) “Fundamentals of Software Engineering”, Eastern Economy Edition, Third Edition, PHI Learning. PP. 300-322. [4] Donald Hearn, Baker M. Pauline (2011) “Computer Graphics”, Second Edition, Person, PP. 117-125. [5] Dix Alan, Finlay Janet, Gregory Abowd, Beale Russell (2012) “Human-Computer Interaction”, Third Edition, Pearson Education, pp. 258-288. [6] Dote Yasuhiko, Ovaska Seppo (2001) “Industrial Applications Of Soft Computing: A Review”, Proceedings Of The IEEE, Vol. 89, No. 9, September 2001, pp. 1243-1265. [7] Bhandari V. B. (2011) “Design of Machine Elements”, 3rd Edition, McGraw Hill Publication, pp. 730-749. [8] Singh V P (2011) Theory of Machines, 3rd Ed., Dhanpatrai and Company, pp. 457-526. [9] Sharma P C, Aggrawal D K, “A Text Book of Machine Design (SI Units)”, Katson Book, pp. 700-787. [10] Ambekar Ashok (2013) “Mechanism and Machine Theory”, PHI India, 300-365. [11] Norton R L (2014) “Kinematics and Dynamics of Machinery”, First Edition, Tata McGraw Hill Education (India) Pvt. Ltd. New Delhi. [12] Sharma C.S. & Purohit Kamlesh (2006) “Theory of Machine and Mechanism”, PHI. © 2014, IJARCSSE All Rights Reserved
Page | 799