Key conceptual, biophysical and statistical issues of importance for designing biodiversity monitoring framework for the rangelands Anita K. Smyth* Centre for Arid Zone Research, CSIRO Sustainable Ecosystems, PO Box 2111, Alice Springs NT 0871 Abstract I review the conceptual, biophysical and statistical issues and challenges that have implications for development of a framework to support effective monitoring of biodiversity in the rangelands. To understand the conceptual issues, I appraise: (1) the concept of biodiversity; (2) how this concept can be operationalised within biodiversity monitoring systems to meet specific purposes of NRM managers and the community; and (3) the selection of ecological indicators which are the currency for effectively meeting outcomes of biodiversity monitoring programs. I also highlight what special features of the rangelands and its land uses need to be considered when developing a biodiversity monitoring framework for the biome. I conclude by highlighting key statistical issues and challenges associated with the evaluation of monitoring data needed to meet the outcomes of monitoring programs effectively. A list of key issues and challenges is provided. *Corresponding author: Email at
[email protected]
ii
1. Introduction The whole-of-the-nation biodiversity monitoring and reporting underpins and justifies future policy and funding directions at a national scale. Little biodiversity monitoring is being done at present at large scales, and so governments have little foundation or knowledge on which to base forward planning and budgeting of scarce dollars for biodiversity conservation programs. A real opportunity now exists to incorporate such monitoring within the broader Australian Collaborative Rangelands Information System (ACRIS) program. At its final meeting in May, members of the National Rangeland Monitoring Coordinating Committee reviewed progress and issues with implementing ACRIS, an initiative of the National Land and Water Resources Audit (NLWRA). In recognition of the work still needed to implement a national scale biodiversity monitoring program, Commonwealth and State and Territory representatives agreed to support an expert technical workshop to identify a set of integrated strategies which can be implemented now and those which will require further study. The purpose of this paper is to identify the key conceptual, biophysical and statistical issues of importance for identifying strategies, tools and techniques for biodiversity monitoring in Australia’s rangelands. We hope that it will be a background resource to guide dialogue at a national expert technical workshop on monitoring rangelands biodiversity to be held on 29 October to 1 November 2002 in Alice Springs. 2. Conceptual issues 2.1
The concept of biodiversity
What is biodiversity? Biodiversity is a term used to describe the complexity of biological systems although its utility is often hotly debated1. Perceptions of it also vary widely in the Australian community2. When we refer to biodiversity, we refer to the variety in the compositional and structural aspects of living organisms (plants, animals and micro-organisms) at different levels of biological organisation. We also refer to the natural biological processes or the functional aspects of biodiversity that maintain ecosystem functioning in both immediate ecological and longer-term evolutionary timeframes. Most importantly, when using the term ‘biodiversity’, it is implicitly understood that we are also referring to the interrelatedness of biological components and its importance in maintaining the diversity of life. In the rangelands, it covers terrestrial and inland waters and can be measured using a plethora of ecological measures that may describe any aspect of the compositional, structural and functional elements of biodiversity at a range of ecological scales (Table 1). Biodiversity is also an important ecosystem service that supplies life support to human civilisations3,4. For example, the native grasslands, mulga woodlands and chenopod country of the rangelands are an important source of marketable goods for animals products such as meat, wool and leather. The native trees produce wood products for fence posts, home building, paper and furniture. Spinnifex grass, bark, soils and dead wood provide landscaping products. The native plants provide food products such as honey, native herbs and fruits, fibre and medicines. Biodiversity is also central to some of our recreational pursuits such as nature watching and photography, gardening, ecotouring and hunting (e.g. fishing). However, over time humans gradually homogenise natural ecosystems by modifying them from diverse communities into species-poor managed systems which causes not only a loss of biodiversity but also an increase in species favoured by human activities5. This pattern
5
is also apparent for the dry rangelands as mentioned in the section on Australia's rangelands. Recent empirical studies in the Northern Hemisphere including those on grasslands have shown that insidious local extinctions of living organisms can alter ecosystem functioning substantially at local scales which over time may lead to global extinctions and a loss of ecosystem sustainability6. Table 1: Examples of metrics for compositional, structural and functional elements of biodiversity at various ecological scales to describe the complexity of biodiversity (modified after 7,8,9). Metrics are not mutually exclusive but have interdependencies across biodiversity elements and ecological scales. Ecological Scale Landscape/Region
• • •
Composition Identity Distribution Richness of patches
Elements of Biodiversity Structure • spatial heterogeneity patch size, shape, • distribution • fragmentation connectivity •
• • • • • • •
Ecosystem/ Community
•
• •
Species/ Population
2.2
• • • • •
species composition – identity, abundance, richness, evenness, diversity, similarity coefficients, turnover, life form distributions, cover, biomass presence and % focal species dominance diversity curves
•
+/-, abundance, %, density importance conservation status disturbance tolerant/ intolerant
•
• • • • •
•
• •
substrate and soil conditions topography living and dead biomass canopy openness gap characteristics abundance and distribution of physical features water and resource presence and distribution
• •
population size, structure & range dispersal metapopulation dynamics
•
• • • • •
• • • • •
Function patch persistence nutrient cycling rates energy flow rates erosion rates geomorphic processes water infiltration disturbance productivity decomposition, herbivory, parasitism, predation, pollination colonisation, relaxation local extinction nutrient cycling succession small-scale disturbances population changes physiology photosynthetic rates foraging success growth rates reproduction rates
Biodiversity monitoring
What is biodiversity monitoring? With the Australian community being increasingly concerned about the loss of biodiversity from local to continental to global scales, there is an urgent need to operationalise the concept of biodiversity. Demands are being placed on policy makers, natural resource managers and those making their livelihood from the rangelands to make decisions about biodiversity conservation issues in the immediate and near future timeframes. Hence, biodiversity conservation is a crisis discipline that demands an adaptive approach where intervention and research together help achieve improved conservation outcomes. Monitoring and assessment is a tool in the NRM tool-kit that helps guide intervention.
6
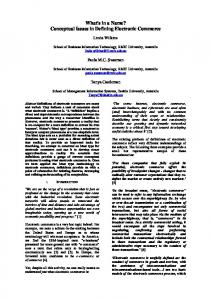
Monitoring overall is often regarded as an activity involving the systematic collecting of certain specified categories of data for specified times and at specific locations. However, it is more complex as it is a multifaceted scientific process involving: (1) the definition of the purpose for monitoring; (2) the selection of ecological indicators to be monitored; (3) the identification of confounding factors, controls or treatments; (4) the design of a sampling scheme; (5) data collection; (6) trend analysis, interpretation and evaluation (7) communication of results and recommendations; and (8) storage of information7,10 . The process is mostly sequential although feedbacks may occur between some of the phases especially when a pilot study is undertaken to assess the power of the sampling scheme, should statistical hypothesis testing be an important part of the analysis. Defining the purpose(s) is the most difficult and critical phase of the process11,12. Most effort should be devoted to this phases as it operationalises the complexity of biodiversity by defining the scope and also determines the adaptiveness and success of the monitoring program. This first phase should establish who requires the monitoring and for what purpose(s), at what spatial scales and resolution, and over what timeframe is the information needed as further discussed later. If the purpose is poorly understood and not tightly focussed, outcomes of monitoring program may result in expensive management that is ineffective or even counterproductive. Once the purpose(s) is clearly understood, biodiversity will be further be operationalised by the choice of ecological indicators. For biodiversity monitoring to be most effective for NRM, it also needs to consider the future trends in land use practices, socio-economic values and indigenous issues. Although ecology has an important role in designing biodiversity monitoring programs to assess ecological sustainability, changes in regional socio-economic and indigenous patterns will also mediate its long-term effectiveness to achieve NRM outcomes related to sustainable land use2,13,14. For example, unsustainable land use is more likely to occur where pastoralism is less viable (Fig. 1). Other expert technical workshops specifically dealing with these factors should also be held so that the strategies identified from this workshop can be reviewed in a socio-economic and indigenous context.
Fig. 1. Rangeland bioregions shaded according to an index of their likely value for pastoralism, based on indices underlying primary productivity, seasonality inasmuch it indicates uncertainty, and distance to market. Green (light) to red (dark) gradient indicates more to less prospective for pastoralism12 .
Reasons for monitoring rangeland biodiversity
7
The purposes for implementing biodiversity monitoring programs are many and are mostly tied to NRM outcomes associated with biodiversity conservation and land use sustainability. They can be broadly categorised into seven non-mutually exclusive groups: (1) assessing the effectiveness of policy or legislation; (2) regulatory, involving performance or audit functions; (3) detecting incipient but significant change as early warning signals; (4) developing strategic frameworks for policy-making by being able to predict responses of indicators to improve management and increase management options; (5) accessing future markets for rangeland products; (6) improving information and knowledge, especially of traditional practices; and (7) improving communication and education strategies2,5,9,15,16,17,18,19,20. Australia is party to a number of international and national policies of importance to biodiversity conservation (Table 2). There are also a number of government corporations, agencies and catchment authorities below the State and Territory level especially for inland waters that have responsibility for the protection of biodiversity21. Using the legislations and agreements listed in Table 2 and the purpose-driven operational criteria listed in the NLWRA-TS CRC report17 (see Table 2, p. 34), the government purposes for monitoring biodiversity are likely to be met by Category 1, 2, 3, 4 and 6. Private landholders, pastoral companies, mining companies, rural communities and indigenous peoples have extensive interests in the rangelands including an increasing interest in biodiversity conservation (e.g. Lake Eyre Basin Co-ordinating Group, http//:www.LakeEyreBasin.org.au). Their purposes for monitoring biodiversity are also likely to be diverse and may be those summarised by Categories 4, 5, 6 and 7 and possibly several others. It is essential that we engage the private sector in developing a national biodiversity monitoring program for we need their cooperation for a successful program and perhaps monitoring activities. Table 2. Examples of policy drivers of importance to biodiversity monitoring17,21. Policy Instrument International Convention on Biological Diversity (1992) National Inter-Governmental Agreement on the Environment National Forest Policy Statement (1992) National Strategy for Ecologically Sustainable Development (1992) National Reserve System National Draft Strategy for Rangeland Management (1996) National Strategy for the Conservation of Australia’s Biodiversity (1996) The Australia State of the Environment Report (1996) The Wetlands Policy of the Commonwealth Government of Australia State of the Environment Advisory Council Environmental Indicators for National State of the Environment Reporting (1998) A framework of regional (sub-national) level criteria and indicators of sustainable forest management in Australia (1998) National Local Government Biodiversity Strategy (1998) Environment Protection and Biodiversity Conservation Act (1999) Managing Australia’s Rangelands: National Principles and Guidelines for Rangeland Management (1999) Managing Natural Resources in Rural Australia for a Sustainable Future (1999) National Land and Water Resources Audit – Rangeland Monitoring Theme (2000) National Objectives and Targets for Biodiversity Conservation (2001) Regional NRM Policy Framework (2002) Biodiversity Toolbox (Local Governments)(revised for previous framework)
The broad reasons for monitoring biodiversity listed here are not exhaustive, hence, a survey of the purposes for monitoring biodiversity by different rangeland stakeholders is needed to document the complete range. Although it is hoped that some purposes are common amongst stakeholders, it is more likely that different stakeholders will want multiple purposes of importance to their organisation or enterprise to be met simultaneously by
8
monitoring. The scale, resolution and timeframe for monitoring biodiversity are also driven by the objectives of the agency or enterprise for biodiversity conservation. With these complications, the purposes for monitoring biodiversity will need to be prioritised as a costeffective monitoring program could not hope to meet so many potentially disparate purposes. Different approaches do exist to guide the setting of priorities for monitoring such as the analytical hierarchy process22 and by assessing the consequences of Type II error decisionmaking where failing to meet a particular NRM outcome results in irreversible ecological harm. The benefit for monitoring immediately then is high relative to the costs of rehabilitation if at all possible. 2.3
Ecological Indicators as tools for monitoring
What are ecological indicators? As indicated in Table 1, biodiversity can be measured by many measures depending on the purpose for monitoring. Ecological indicators can be broadly group into biotic, environmental and impact metrics (Fig. 3). Ecological indicators
surrogacy
Biotic metrics
Impact Metrics
Landscape metrics
Environmental Metrics
Impact Metrics
Field-based data
Environmental Metrics
Satellite-imagery data
Fig. 2. The relationship between field-based biotic, environmental and impact metrics and satelliteimagery based environmental and impact metrics which are termed landscape metrics. These latter metrics are potential surrogates for field-based biotic metrics. Satellite-imagery data rarely allows interpretation of biotic measures at the resolution of individual entities.
The first group deals with biological entities which are driven by changes in the environmental and impact metrics. Climate, topography, soil properties, LFA attributes, vegetation/habitat characteristics are examples environmental metrics. An impact metric refers to threatening processes caused by human activities. All three metrics have traditionally been field-based but their cost and small-scaled nature has lead to a demand in measures which are less costly and can be rapidly assessed at broader scales by different land managers. With the infusion of remotely-sensed data, a substantial body of techniques have been developed in Australia to measure these environmental and impact attributes for a range of ecosystems at multiple scales. These attributes are generically termed landscape metrics. Because biotic metrics for ecosystems and populations rely on counts of species or individuals for actual or derived measures, there are no sensors that we are aware of that can be used reliably to monitor biota at these resolutions. Instead, it is hoped that landscape
9
metrics can be used as surrogates to predict the numbers and distribution patterns of biota at the ecosystem and species/population levels. These metrics include derived indices for resource retention and sediment flow (leakiness index23; multidirectional sediment flows24,25), vegetation cover, structure, condition and productivity especially in rangelands26,27,29,30,31, forests 28, 32, 33,34,35,36,37 and rehabilitated mine sites39 . Although this work involves a range of satellite sensors such as Landsat MSS, Landsat TM, NOAA AVHRR and airborne DMSV, HyMap and gamma ray data, most studies have used one type of RS image which means applications are confined to the scale of the image size. This can place restrictions on their value in natural resource management as those with fine spatial coverage whilst beneficial in providing detail tend to be less costeffective over large areas whereas those with broad spatial scales tend to lack detail of importance for management. Ideally, we need a generic "scaling-up" approach that takes advantage of the synergies between field-based measurements and different RS data for applications at multiple scales. Nevertheless, considerable progress has been made using landscape metrics to predict the abundance of ground-dwelling mammals in sclerophyll forests32,33,34,35 and birds in woodland fragment42; herbivore species richness and abundance relative to NDVI43; spatial modelling of rangeland bird distributions relative to spatial mapping of artificial waterpoints (Melbourne, Davis and James, unpublished data), NDVI (Griffin et al., unpublished data) and landscape function (Fisher et al. unpublished data); species-habitat modelling using synthetic aperture radar to derive indices of structural complexity across two vegetation types and their ecotone42 and management of koala habitat43. Some outcomes of this research have advanced the feasibility of using landscape metrics as surrogate measures of biotic patterns while others need further development or a completely new approach. How do we select ecological indicators for monitoring? Our choice of ecological indicators will be driven by the key purposes for monitoring biodiversity which will be decided in the workshop. However, the NLWRA –TS CRC report on rangeland biodiversity monitoring, the framework of regional Montreal indicators for forest management44 and the State of Environment reporting2 have already identified indicators for monitoring. In particular, the NLWRA report recommended nine indicators as a starting point: (1) progress towards a comprehensive, adequate and representative (CAR) reserve system; (2) extent of clearing of woody vegetation; (3) landscape function metrics; (4) native perennial ground cover (including grasses and shrubs palatable to stock); (5) exotic plant species cover; (6) status of fire-sensitive plant species and communities; (7) status of grazing-sensitive plant species; (8) status of susceptible mammal species; and (9) status of susceptible bird species. Other approaches also exist45. The major problems that stifle the use of ecological indicators as a NRM tool are: (1) monitoring program chooses too few indicators and fail to integrate the full complex of the ecosystem; (2) the long-term goal and objectives of the monitoring program are not clearly defined; and (3) monitoring programs often lack scientific rigour because they failed to use a defined protocol to select ecological indicators9. In general, ecological indicators need to capture the complexities of the ecosystem yet remain simple enough to be cost-effective and easily measured. As a guide, they should link with the purposes of monitoring and meet the criteria outlined in Table 4 although some criteria are more likely to be more relevant than others depending on the purpose for monitoring. When selected, a review should be undertaken as to how well the combined set of ecological indicators provide an overview of the purposes for monitoring biodiversity, and whether they provide sufficient detail and links to sustainability to assess whether the management outcomes are sustainable.
10
Table 4. Criteria for ecological indicators (modified after 9,12,21,,45,46,47,63) ◦ ◦ ◦ ◦ ◦ ◦ ◦ ◦ ◦ ◦ ◦ ◦ ◦ ◦
Are easily measured Their cost are appropriate to their benefits (including non-economic costs and benefits) Are sensitive to threatening processes affecting the system Respond to threatening processes in a predictable manner with known levels of confidence and, biological and statistical power Are anticipatory: signify an impending change in the ecological system whether composition, structural or functional signal with confidence Predict changes that can be averted by management actions Are integrative: the full complement of indicators provides a measure of coverage of the key gradients across ecological systems (e.g. water, soils, vegetation types, climatic profiles) Have a known response to natural disturbances, threatening processes, and changes over relevant spatial scales and timeframes Have low variability in response Are capable of being measured against a standard or other performance measure, where relevant Retain flexibility to incorporate new information as it becomes available or circumstances changes Link with existing State and Territory indicators for pastoral monitoring and Parks & Reserves programs and the NLWRA minimum set Are easily used under different scales of rangeland NRM and different tenures Facilitate community involvement, where possible and appropriate
3. Biophysical issues 3.1
Australia’s rangelands
The Australian rangelands covers approximately 70% of the continent (6 million km2) including the low rainfall and diverse dry (arid and semi-arid) inland areas and, some seasonally high rainfall areas north of the Tropic of Capricorn48. It also includes the slopes and plains of northern New South Wales and southern Queensland. Pastoralism is the most extensive land use in the rangelands although it is limited in the Central Ranges, Coolgardie, Gibson Desert, Great Sandy Desert, Great Victoria Desert, Little Sandy Desert, Tanami and Top End Coastal bioregions. Australia's intense agricultural croplands are not included in the rangelands. The main ecosystems grazed by domestic stock are grasslands, shrublands, woodlands and tropical savanna woodlands. In the dry lands, livestock densities are extremely low at 0.5 cattle units per km2 mainly because of the productive capacity of these lands to support only one sheep or one cattle unit (or 8-10 dry sheep equivalents) per km2 whereas the safe stocking rate in the savanna woodlands and the Mitchell grass plains is 4-6 cattle unit per km2 49. Sheep generally dominate in the southern rangelands while cattle are mainly grazed in the northern parts. Inland Australia is changing through regionalisation and increased settlement. Regional Australians are increasingly having more equitable access to resources, systems of governance are devolving responsibilities regionally and e-communications has meant worldwide immediate access to knowledge. These regions support diverse cultures, social structures and various industries which means the regions differ markedly in their socioeconomic patterns. Mining has contributed $12 billion (1993-1994), tourism $1.7 billion (1992-93), and meat and wool production just under $1 billion (1993-1994) annually to the
11
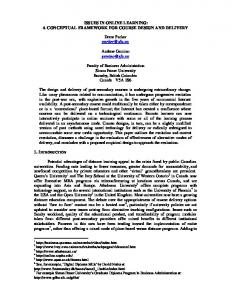
Australian economy48. Other land uses include Aboriginal land (20% of the rangelands with communities throughout), national parks and uncommitted land50. 3.2 Loss of biodiversity The rangelands also support megadiverse landscapes, plants and animals of international importance for tourists and cultural significance for indigenous Australians. It comprises half of Australia’s 85 bioregions where each has its own complement of land systems, 9 of the continent’s 12 plant ecosystems, 67, 62, 47 and 33% of Australia’s reptile, bird, frog and mammal species respectively occur in the rangelands. The terrestrial invertebrates have greater diversity with new species being discovered regularly. More importantly, the wetlands have international significance as feeding grounds for migratory waders. This diversity together with climate variability makes the rangelands spatially complex at different scales which means that detectable responses to human intervention are often substantially delayed14. Since European settlement, human activities have lead to land degradation, habitat loss and fragmentation, changes in ecological processes and homogenisation resulting in a loss of biodiversity and population declines of some plants and animals and increases in others. These effects have occurred from local to continental scales. It has been estimated that 13% of Australia’s rangelands is degraded, 16% affected by sheet and rill erosion and 17% affected by woody weeds, 25% of land cover has been significantly disturbed51. Degradation has affected regions unevenly especially in the dry inland as some land systems are considered less resilient and more at risk to grazing (Fig. 3).
Fig. 3. Rangeland bioregions shaded by an index of the likelihood that grazing use might cause damage to the public interest based on indices of the underlying soil types and their likely resilience, seasonality inasmuch it makes it harder for management to avoid errors, and landscape heterogeneity relative to the likelihood of damage developing patchily. Green (lighter) to red (darker) regions represents a gradient from less risk to high risk. (After14).
Several of our native plants mammals and birds have disappeared and are now presumed locally extinct in many regions especially throughout dry inland Australia (Table 5). Regionally, the loss of mammals species has been dramatic and expansive now resulting
12
in 15 (12%) global extinctions for the rangelands. Only two bird species are presumed extinct but a considerable number of regional declines have been reported. Also associated with human activities in the rangelands has been the colonisation of new species in bioregions and an increase in the populations of other species (e.g. red kangaroo, grey kangaroo, emu, crested pigeon, mudlark, grey butcherbird) favoured by land use changes18. Table 5. Regional number of species presumed extinct and reportedly declining in dry inland and wetter rangeland bioregions (summarised from18). 1
Bioregion Dry Inland Rangelands Broken Hill Complex Burt Plain* Carnarvon Central Ranges Channel Country Cobar Peneplain Coogardie Darling Riverine Plains Desert Uplands Finke Flinders & Olary Ranges Gascoyne Gawler Geraldton Sandplains Gibson Desert Great Sandy Desert Great Victoria Desert Hampton Little Sandy Desert Macdonnell Ranges Mitchell Grass Downs Mount Isa Inlier* Mulga Lands Murchinson Murray-Darling Depression Nullabor Pilbara Simpson-Strzelecki Dunefld Stony Plains Tanami Yalgoo Wetter Rangelands Cape York Peninsula Central Arnhem* Central Kimberley Daly Basin* Dampierland Einasleigh Uplands* Gulf Coastal Gulf Fall and Uplands* Gulf Plains Northern Kimberley* Ord-Victoria Plains* Pine-Creek Arnhem* Sturt Plateau* Top End Coastal* Victoria Bonaparte
Plants
No. Presumed Extinct Species Mammals Birds Reptiles
1
No. Species with Reported Declines Plants Mammals Birds Reptiles
1 0 1 0 0 0 2 0 0 0 3 1 0 9 0 0 0 0 0 1 0 0 0 2 1 0 0 0 0 0 0
27 9 16 11 7 11 7 1 13 24 7 14 13 13 4 20 13 15 0 1 3 27 11 4 11 10 11 11
2 0 9 0 1 0 0 0 3 0 1 0 0 1 0 0 1 0 3 2 1 1 0 0
0 0 0 -
21 2 3 3
1 4 6 5 4 4 8 3 6 0
7 10 20 20 4 7 1 7 1 2 9 1 1 2 2 5 60-100 5 5 5
10 0 0 0 0 0 0 0 0 0 0 0 0 0 0
0 5 5 0 5 0 0 5 0 0 0 6
0 0 0 0 0 0 0 0 0 0 0 0 0 0
-
0 1 1 1 1 0 0 1 0 1 0 1+ -
0 0 2 1 1 2 5 3 6 -
4 1 0 1 4 0 1 1 1 2 2
1 2 3 1 -
* No comprehensive overview of biodiversity in these bioregions although information is summarised from available publications. The numbers recorded are minimum values for accounts of species published. Vertebrate extinctions reported favour mammals and birds. It is unclear to what extent other vertebrates and invertebrates may be regionally extinct. Information is also lacking on the declines of species in most bioregions. - equals information not reported.
1
3.3 Threatening processes
13
Multiple threatening processes rather than a dominant one has influenced the loss of terrestrial biodiversity in the rangelands through habitat loss and degradation18. No assessment that we are aware of has considered the threatening processes for inland waters and hence the remainder of this section refers to terrestrial biodiversity. Grazing by domestic livestock and feral animals (e.g. rabbits, goats, camels, donkeys) has adversely affected resource rich and climate resilient habitat patches and refugia sites especially in the dry inland, and affected the displacement of native perennial grasses and palatable shrubs. The spatial distribution of artificial water sources has created radial and star-shaped gradients of habitat disturbance in the landscape with high disturbance occurring near water sources and gradually decreasing with distance from water. Tree and woody vegetation clearing for pasture improvement has caused habitat loss and degradation through habitat fragmentation. Introduced predators (cats, foxes, feral dogs) have had an adverse effect on animal populations especially those of the dry inland mammals. Weed invasions especially exotic grasses and introduced plants (e.g. prickly acacia, buffel grass, athel pine, mesquite) have displaced native species. Inappropriate fire regimes have also had an impact on the population viability of some woody species and fauna at the plot-based scale in addition to habitat loss and degradation. Mining affects a small area of the rangelands but where it occurs habitat loss and degradation especially of the soil is a by-product. Hunting (including native food gathering and commercial harvesting) may directly impact on populations of specific species (e.g. Australian bustard) although the evidence is weak. Global climate change will also gradually impact on biodiversity through habitat loss as indicated by historic biogeographical patterns (Henry Nix, personal communication). The evidence for the impact of these processes on biodiversity is mixed and mainly inferred from basic principles but good to strong evidence supports the impact of clearing woody vegetation, introduced predators, grazing on the displacement of native perennial grasses and thickening of native woody plants, invasion of exotic grasses and other exotic plants, inappropriate fire regimes and changed water regimes47. The by-products of these threatening processes (e.g. habitat fragmentation) could potentially be used as impact metrics for rangelands biodiversity monitoring. The research issues associated with using the fragmentation of forest types as an ecological indicator already have relevance in the rangelands52. Evidence is weak for the other threatening processes. 4. Statistical issues 4.1 Assessment of monitoring data Broad analytical approaches Without doubt, the purposes for monitoring will also influence the analyses of monitoring data53. However, many analyses are either descriptive in their objective where data is used to display patterns or they aim to detect a putative impacts. The former can be used for predictive risk assessment of a human activity using standard predictive modelling techniques to derive a model with known error levels (e.g. habitat models with ROC values54) whereas the later approach is mainly used in postdictive (retrospective) risk assessment. Predictive risk assessment has its problems as a standard-alone tool as it is only effective when the prediction is an accurate indicator of actual effects which can only be achieved after assessing many repeated tests53. This approach is particularly problematical in ecological systems where the inter-relatedness of drivers and responsible biophysical variables are largely unknown and in the case of the dry inland rangelands, the natural variability is extreme. Postdictive risk assessments (also term field assessments) have
14
limited NRM value as they are reactive and document an impact although this information can be built upon in an adaptive management environment53. Nowadays, there are very elegant experimental designs such as Before-After studies 55, BACI56, BACIPS 55,57 and beyond BACI 58, all of which incorporating time series data that can spatially stratified. Ideally, both approaches should be adopted for rangeland biodiversity monitoring if the purpose is to monitor for detecting human impacts. Does "formal statistical methods" mean hypothesis testing ? Statistical hypothesis testing is often thought of by ecologists as being the most rigorous and objective way of making decisions55,59,60. At a symposium by the Biometric Working Group of the US Wildlife Society in 1998, all delegates were virtually unanimous in their opinion that the tool was overused. Tests were often used inappropriately and their results misinterpreted. Ecologists frequently claim to prove null hypotheses which is virtually impossible in the hypothesis testing paradigm. In fact, P-values can become so important that they can be written into legally binding codes of practice which is a concern as high sample sizes and power (see next papragraph) can yield a statistically significant P at the arbitrary 0.05 for ecologically trivial differences55,59. Another concern with the strong belief in the value of hypothesis testing is that ecological significance often runs a poor second to the mighty P-value. Postdictive risk assessment tools are all members of the hypothesis testing paradigm but these days statistical power is used as a tool to gauge the "power of the message". Power is a function of sample size, critical value (α) and effect size where the later is the absolute difference between the populations of interest59. Unlike sample size and the critical value, the effect size for identifying significant changes in the trends of parameters from monitoring data will need to be decided by those stakeholders who wanted biodiversity monitoring in the first instance as they will need to identify thresholds especially if management intervention is the key purpose for monitoring. Alternative analytical approaches to statistical hypothesis testing that supports NRM decision-making indicated monitoring data are Bayesian approaches although the detailed specification and quantification of all aspects of the problem that is need for these approaches may render them costly and unfeasible55. Another less confusing approach is the use of confidence intervals. These not only support quantitative conclusions from monitoring data but have the added advantage of summarising complex results without oversimplifying it, power is portrayed graphically, biological and statistical significant effects can be teased apart, are more relevant to an overall assessment and correspond closely to the Bayesian ideals55,59. Other multivariate, parametric and non-parametrics techniques are described in the thematic issue of “Solutions to Environmental Problems” in Austral Ecology. 4.2 Identifying signal from noise in trends The responses of biota in the rangelands could be explained by variation in natural and/or human environmental drivers. If we are to conduct management mitigation or restoration initiatives, it will be essential to know what proportion of the variation in biotic responses is explained by these drivers exclusively and interactively. Ian Watson’s draft addresses this issue in detail. 4.2 Cost-effectiveness of a long-term biodiversity monitoring program The purpose(s) for biodiversity monitoring, choice of ecological indicators, spatial scale and the timeframe will all influence the cost of monitoring. Greater spatial replication and the repeated sampling over time will increase both sample size and power but it will also
15
increase the costs especially if the program runs for a long time12. It is also possible that some ecological indicators especially field-based metrics will be more costly to sample. When identifying strategies, tools and techniques to support biodiversity monitoring in the rangelands, the cost of monitoring should be considered simultaneously. 5.0 Conclusions Many key issues and challenges arises from this review and are summarised in Table 6. It is important that some of these form the basis for guiding principles for designing biodiversity monitoring systems in the rangelands. Key Issues and Challenges Conceptual ◦
We need to be cognisant of the complexity of biodiversity and ecosystem functioning when deciding on strategies, tools and techniques for biodiversity monitoring.
◦
We need to develop educational tools to effectively promote to the broader rural community an understanding of the full social, economic and environmental value of biodiversity as an ecosystem service and the importance of its monitoring in terrestrial and freshwater systems of the dry inland of the rangelands.
◦
Researchers, managers and rural industries need to work together to operationalise the concept of biodiversity by clearly identifying the purpose(s) for monitoring rangelands biodiversity. We need to understand who wants the information, at what spatial scale and resolution is it required and over what timeframe.
◦
We need to be aware that biodiversity monitoring must integrate regional estimates of future economic viability and social feasibility including indigenous values into rangeland programs to achieve NRM outcomes associated with land use sustainability.
◦
A cost-effective biodiversity monitoring program cannot hope to fulfil all purposes of stakeholders, so we will need to be pragmatic at the setting of priorities for the purposes for monitoring rangeland biodiversity.
◦
We need to standardise our use of terminology by adopting the generic term of ecological indicators to refer to those tools that are monitored to predict response patterns in biodiversity. Ecological indicators may include a combination of biotic, environmental, impact and landscape metrics.
◦
We need to examine and further develop the landscape metrics used in forest and woodland ecosystems that already exist to assess their reliability as surrogate measures of different components of biodiversity at various levels of organisation in the rangelands and to identify which can be implemented immediately and which need either short- or longterm R & D.
◦
We need to develop and apply a generic "scaling-up" approach that takes advantage of the synergies between field-based measurements and different satellite imagery for applications at multiple scales for rangeland biodiversity monitoring.
◦
Ecological indicators often fail as NRM tools mainly because too few are chosen, the purposes for monitoring are not clearly stated and they fail to use a defined protocol that provides the scientific rigour for selecting indicators.
◦
A review should be done of the combined set of agreed ecological indicators to evaluate their ability to meet the purposes for monitoring rangeland biodiversity and to assess whether management outcomes from monitoring is sustainable.
◦
Ecological indicators should link in with existing NRM surveys and pastoral monitoring programs, where possible.
16
◦
The protocol for guiding the selection of ecological indicators needs to be prioritised relative to the purposes for rangeland biodiversity monitoring. Biophysical
◦
The terrestrial and inland waters of the rangelands are megadiverse and with the climate variability it makes the rangelands spatially complex at different scales. This means that detectable responses to human intervention are often substantially delayed.
◦
The global extinctions of inland mammals, the regional extinctions and declines of birds, and some plant species strongly signals a possible new wave of biodiversity loss in the dry inland of the rangelands.
◦
The lack of knowledge about possible regional extinctions and decline of invertebrate and aquatic biodiversity is an obvious gap and has implications for these taxa as potential ecological indicators.
◦
Need to assess the threatening processes that affect the aquatic biodiversity in the inland waters.
◦
Threatening processes are not likely to be mutual exclusive in their influence on biodiversity and therefore we need to understand the responses of biodiversity to the inter-relatedness of threatening processes. This has implications for impact metrics to predict biodiversity responses with confidence.
◦
Need to evaluate the threatening processes to rangelands biodiversity as potential impact metrics against an agreed protocol for guiding the selection ecological indicators. Statistical
◦
Both pre-and postdictive risk assessment approaches should be considered and if hypothesis testing techniques are to be used for the purposes of supporting decisions on management intervention, then stakeholders needing the biodiversity monitoring need to be clear about what effect sizes and power are legitimate for decision-making.
◦
Confidence interval techniques are potentially effective tools for postdictive assessment of biodiversity monitoring data.
◦
If we are to conduct management mitigation or restoration initiatives, it will be essential to know what proportion of the variation in biotic responses is explained by these drivers exclusively and interactively.
◦
When identifying strategies, tools and techniques to support biodiversity monitoring in the rangelands, the cost of monitoring should be considered in tandem.
17
References 1. Doherty, M., Kearns, A., Barrett, G., Sarre, A., Hochuli, D., Gibb, H. and C. Dickman. 2000. The interaction between habitat conditions, ecosystem processes and terrestrial biodiversity- a review. Australia: State of Environment Technical paper, Series No. 2, 116pp. 2. Williams, J., Read, C., Norton, A., Dovers, S., Burgman, m., Proctor, W., and H. Anderson. Biodiversity, Australia State of Environment Report 2001 (Theme Report). CSIRO Publishing on behalf of Department Enviornment and Heritage, Canberra. 3. Daily,G.C., Alexander, S., Ehrlich, P.R., Goulder, L., Lubchenco, J., Matson, P.A., Mooney, H.A., Postel, S., Schneider, S.H., Tilman, D., and G.M. Woodwell. 1997. Ecosystem services: benefits supplied to human societies by natural ecosystems. Issues in Ecology 2, 16pp. 4. Cork, S., Shelton, D., Binning, C. and R. Parry. 2002. A framework for applying the concept of ecosystem services to natural resource management in Australia. In: Thrid Australian Stream Management Conference, August 27-29, eds. Rutherford, I., Sheldon, F., Brierley, G., and Kenyon, C. CRC for Cathcment Hydrology: Brisbane, Pp 157-162. 5. Niemelä, J. 2000. Biodivesity monitoring for decision making. Annales Zoologici Fennici 37:307-317. 6. Naeem, S., Chapin III, F.S., Constanza, R., Ehrlich, P.R., Golley, F.B., Hooper, D.U., Lawton, J.H., O.Neill, R.V., Mooney, H.A., Sala, O.E., Symstad, A.J. and D. Tilman. 1999. Biodiversity and ecosystem functioning: maintaining natural life support processes. Issues in Ecology 4, 11pp. 7. Noss, R.F. Indicators for monitoring biodiversity: a hierarchical approach. Conservation Biology 4:355-364. 8. Karr, J.R. 1991. Bioogical integrity: a long neglected aspect of water resource management. Ecological Applications 1:66-84. 9. Dale, V.H. and S.C. Beyeler. 2001. Challenges in the development and use of ecological indicators. Ecological Indicators 1:3-10. 10. Jones, K.B. 1986. The inventory and monitoring process. In: Inventory and monitoring of wildlife habitat, eds., Cooperrider, A.Y., Boyd, R.J., Stuart, H.R. U.S. Department of Interior: Bureau of Land Management, Washington D.C., Pp: 1-9. 11. Silsbee, A.M. and D.l. Peterson. 1993. Planning for implementation of long-term resource monitoring programs. Environment Monitoring Assesment 26:177-185. 12. Caughlan, L. and K.L. Oakley. 2001. Cost considerations for long-term ecological monitoring. Ecological Indicators 1:123-134. 13. Bawa, K.S. and S. Menon. 1997. Biodiversity monitoring: the missing ingredients. TREE 12:42. 14. Stafford Smith, D.M., Morton, S.R. and A.J. Ash 2000. Towards sustainable pastoralism in Australia's rangelands. Australian Environmental Management 7:190-203. 15. Hopkins, A.J.M. and McKenzie, N. 1994. Options for long-term monitoring of arid and semiarid terrestrial ecosystems in Australia. In: Options for a national program on long-term monitoring of Australian biodiversity, eds. Redhead, T., Mummery, J., and Kenchington on behalf of Organising Committee for Workshop on Long-term Monitoring of Australia’s biodiversity, CSIRO and DEST Biodiversity Unit, Canberra 10-11 May 1994. 16. Stork,N. & Boyle, T.J.B., Dale, V., Eeley, H., Finegan, B., Lawes, M., Manokaran, N., Prabhu, R., and J. Soberon. 1997. Criteria and Indicators for assessing the sustainability of forest management: Conservation of biodiversity. Working paper No. 17, 29 pages, (http://www.cgiar.org/cifor) 17. Whitehead, P. 2000. The framework. In: Developing an analytical framework for monitoring biodiversity in Australia's rangelands. Report to the National Land and Water Resources Audit by the Tropical Savannas CRC. Darwin, Pp. 4-76. 18. Woinarski, J. 2000. A review of changes in the status and threatening processes. Report to the National Land and Water Resources Audit by the Tropical Savannas CRC. Darwin, Pp. B12 to B1-324. 19. Possingham, H., Ryan, S., Baxter, J. and S. Morton. 2002. Setting biodiversity priorities. Report on sustaining our natural systems and biodiversity for the Prime Minister's Science, Engineering and Innovation Council. (http://www.dest.gov.au/science/pmseic/meetings/ 8thmeeting.htm). 20. Standards and Targets Working Group of the Natural Resource Management Ministerial Council. 2002. Draft discussion paper on biodiversity conservation outcomes and targets for
18
natural resource management. Biodiversity Poicy Section, NHT and Biodiversity Policy Branch, Environment Australia, Canberra. 34pp. 21. Georges, A. and P. Cottingham. 2002. Biodiversity in inland waters – priorities for its protection and management. Technical report on the recommendations from the 2001 Fenner Conference on Environment, 1/2002. CRC Freshwater Ecology, Canberra, pp. 37. 22. Schmoldt, D.L. and D.L. Peterson. 2000. Analytical group decision making in natural resources: methodology and application. Forest Science 46:62-75. 23. Ludwig, J.A., Eager, R.W., Bastin, G.N., Chewings, V.H. and Liedloff, A.C. (2002). A leakiness index for assessing landscape function using remote-sensing. Landscape Ecology, in press. 24. Pickup, G. and A. Marks. 2000. Identifying large-scale erosion and deposition processes from airborne gamma radiometrics and digital elevation models in a weathered landscape. Earth Surface Processes and Landforms 25, 535-557. 25. Pickup, G. and A. Marks. 2001. Regional-scale sedimentation process models from airborne gamma ray remote sensing and digital elevation data. Earth Surface Processes and Landforms 26, 273-293. 26. Bastin G.N., Pickup G., and G. Pearce. 1995. Utility of AVHRR data for land degradation assessment: a case study. International Journal of Remote Sensing, 16:651-672. 27. Bastin G., Ash A., Corfield J., Abbott B., Eldridge D., Freudenberger D. 1999. Monitoring tropical tallgrass rangelands with aerial videography. People and rangelands: building the future. Proceedings of the VI International Rangeland Congress, Townsville, Queensland, Australia, 19-23 July, 1999. Volumes 1 and 2. International Rangeland Congress, Inc: Aitkenvale, Australia, Pp. 473-474. 28. Coops, N.C., Catling, P.C. (1997) Predicting the Complexity of Habitat in Forests from Airborne Videography for Wildlife Management. Int. J. Remote Sensing. 18:12 pp. 2677-2686. 29. Chewing, V.H, Pickup, G., Bastin, G.N., Pearce,G. 2000. The potential for hyperspectral data mapping in Australian arid-zone vegetation. 10th Australasian Remote Sensoring and Photogrammetry Conference, 21-25 August 2000, Adelaide. The Remote Sensing & Photogrammetry Association of Australasia, Adelaide., Pp. ?? - ??, 30. Pickup, G. and G. Bastin. 1997. Spatial distribution of cattle in arid rangelands as detected by patterns of change in vegetation cover. Journal of applied Ecology, 34:657-667. 31. Wallace, J. and N. Campbell. 1998. Evaluation of the feasibility of remote sensing for monitoring National State of the Environment Indicators. Australia: state of the Environment Technical paper series (Environmetal Indicators). Depart of Environment, Canberra, pp.93. 32. Catling, P. C. and Coops, N. C. (1999). Prediction of the distribution and abundance of small mammals on the eucalypt forests of south-eastern Australian from airborne videography. Wildlife Research. 26: 641-650. 33. Coops N.C., Waring R.H., Landsberg J.J., 1998. Assessing forest productivity in Australia and New Zealand using a physiologically-based model driven with averaged monthly weather data and satellite-derived estimates of canopy photosynthetic capacity. Forest Ecology and Management, 104:113-127. 34. Coops, N. and R.H. Waring. 2001. The use of multiscale remote sensing imagery to derive regional estimates of forest growth capacity using 3-PGS. Remote Sensing of Environment, 75:324-334. 35. Coops, N.C., White, J.D., and Scott, N.A. (2001) Effect of forest fragmentation on broad scale estimates of forest biomass accumulation. Geographical and Environmental Modelling.(in review). 36. Tickle, P. K., Coops, N. C., Hafner, S. D. 2001a. Assessing Forest Productivity at Local Scales Across a Native Eucalypt Forest Using a Process Model, 3pg-Spatial. Forest Ecology and Management, 152:275-291. 37. Tickle, P. K., Coops, N. C., Hafner, S. D. 2001b. Comparison of a forest process model (3PG) with growth and yield models to predict productivity at Bago State Forest, NSW. Australian Forestry, 64:111-122. 38. Pickup, G. and M. Stafford Smith. 1993. Problems, prospects and procedures for assessing the sustainability of pastoral land management in arid Australia. Journal of Biography 20:471487. 39. Hick, P and Ong C. 1999. The Role of Remote Sensing for Measuring Mining Impact on the Australian Arid Environment and the Link to Ecological Function. Proceedings of the AMEEF Conference on Innovation, Fremantle August 1999, pp1-11.
19
40. Freudenberger, D. 2001. Bush birds: Biodiversity enchancement guidelines for the Saltshaker Project, Boorowa, NSW. CSIRO Sustainable Ecosystems, Canberra, pp. 48. 41. Oindo, B.O. 2002. Predicting mammal species richness and abundance using multi-temporal NDVI. Photogrammetric Engineering and Remote Sensing 68:623-629. 42. Imhoff, M.L., Sisk, T.D., Milne, A., Morgan, G. and T. Orr. 1997. Remotely-sensed indicators of habitat heterogeneity: use of synthetic apaerture radar in mapping vegetation structure and bird habitat. Remote Sensing Environment 60: 217-227. 43. Scarth, P., Phinn, S.R., Held, A and D. Mitchell. 2000. Mapping koala habitat and eucalyptus tree: integration and scaling of field and airborne hyperspectral data. 10th Australasian Remote Sensoring and Photogrammetry Conference, 21-25 August 2000, Adelaide. The Remote Sensing & Photogrammetry Association of Australasia, Adelaide., pp., ?? 44. Commonwealth of Australia. 1998. A framework of regional (sub-national) level criteria and indicators of sustainable forest management in Australia. Department of Agriculture, Fisheries & Forestry, Canberra. 45. McNally, R, Bennett, A., Brown, G., Lumsden, L.F., Yen, A., Hinkley, S. Lillywhite, P. and D. Ward. 2002. How well do ecosystem-based planning units represent different components of biodiversity. Ecological Applications 12:900-912. 45. Jones, G.P. and U.L. Kaly. 1994. Criteria for selecting marine organisms in biomonitoring studies. In: Detecting ecological impacts: concepts and applications in coastal habitats, eds. By Schmitt, R.J. and C.W. Osenberg, Pp29-48. Academic Press, New York. 46. Morrison, P. and R. Penny. 1997. Proceedings of the National Biodiversity Workshop for the Montreal Process. Report to Department of Agriculture, Fisheries & Forestry, Canberra, pp. 14. 47. National Land & Water Resources Audit. 2000. Theme 4: Rangelands monitoring Developing an analytical framework for monitoring biodiversity in Australia's rangelands. A report NLWRA by Tropical Savannas CRC, c.550pp. 48. ANZECC & ARMCANZ 1999. National Principles and Guidelines for Rangeland Management. Commonwealth of Australia, Canberra. 49. Hamblin, A. 2001. Land, Australia State of the Environment Report 2001 (Theme Report), CSIRO Publishing on behalf of the Department of Environment and Heritage , Canberra, pp.12. 50. Morton, S. R., Smith, D. M. S., Friedel, M. H., Griffin, G. F., Pickup, G. 1995. The Stewardship of Arid Australia - Ecology and Landscape Management. Journal of Environmental Management 43: 195-217. 51. National Rangelands Management Working Group. 1996. Draft National Strategy for Rangeland Management. Dept. of Environment, Sport and Territories, Canberra, 52. Tickle, P., Hafner, S., Lesslie, R., Lindenmayer, D., McAlpine, C., Mackey, B., Norman, P., and S. Phinn. 1998. Scopying study and final report on Montreal indicator 1.1e Fragmentation of forest types – Identification of research prioities. A study prepared for Forest and Wood Products Research and Development Corporation, Canberra, 76 pp. 53. Osenberg, C.W. and R.J. Schmitt. 1994. Detecting ecological impacts caused by human activities. . In: Detecting ecological impacts: concepts and applications in coastal habitats, eds. By Schmitt, R.J. and C.W. Osenberg, Pp. 3-16. Academic Press, New York. 54. Tyre, A.J., Possingham, H.P. and Lindenmayer, D. 2001. Inferring process from pattern: can territory occupancy provide information about life history parameters. Ecological Applications 11:1722-1737 55. Stewart-Oaten, A. 1994. Goals in environmental monitoring. In: Detecting ecological impacts: concepts and applications in coastal habitats, eds. By Schmitt, R.J. and C.W. Osenberg, Pp. 17-28. Academic Press, New York. 56. Stewart-Oaten, A. 1986. Environmental impact assessment: "pseudoreplication " in time? Ecology 67:929-940. 57. Bence, J.R., Stewart-Oaten, A., and S.C. Schroeter. 1994. Estimating the size of an effect from before-after-control-impact paired series design: The predictive approach applied to a power plant. In: Detecting ecological impacts: concepts and applications in coastal habitats, eds. By Schmitt, R.J. and C.W. Osenberg, Pp. 133-150. Academic Press, New York. 58. Underwood, A.J. 1992. Beyond BACI: the detection of environmental impacts on populations in real, but variable, world. Journal of Experimental Marine Biology and Ecology 161:145-178. 59. Steidl, R.J., Hayes, J, P. and E. Schauber. 1997. Statistical power analysis in wildlife research. Journal Wildlife Management 61:270-279. 60. Johnson, D. 1999. The insignificance of statistical significance testing. Journal of Wildlife Management 63:763-772.
20
61. Friedel, M.H. 1991. Range condition assessment and the concept of thresholds: a viewpoint. Journal of Rangeland Management 44:422-426. 62. Pick-up, G., Bastin, G.N., and V.H. Chewings. 1998. Identifying trends in land degradation in non-equilibrium rangelands. Journal of Applied Ecology 35:363-377. 63. Saunders, D., Margules, C., and B. Hill. 1998. Environmental indicators for national State of Environment reporting – Biodiversity, Australia: State of the Environment (Environmental Indicator Reports), Department of Environment, Canberra, 68 pp.
21