Modeling Constraints and Statistical Issues of Consistent Operational Risk Measurement Andreas A. Jobst# Working Paper This Version: January 8, 2007 Abstract Amid increased size and complexity of the banking industry, operational risk has a greater potential to transpire in greater and more harmful ways than many other sources of risk. This paper provides a succinct overview of modeling constraints and critical issues of consistent risk estimation under current regulatory standards. In particular, we show how the varying characteristics of operational risk and different methods to identify, collect and report operational risk losses influence the reliability and consistency of operational risk estimates. The implications of our findings offer instructive and tractable recommendations for a more effective operational risk measurement. Keywords: risk management, operational risk, risk management, financial regulation, Basel Committee, Basel II, fat tail behavior, extreme tail behavior. JEL Classification: G10, G21, K20.
-1-
1
INTRODUCTION
Although financial globalization has fostered higher systemic resilience due to more efficient financial intermediation and greater asset price competition, it has also complicated banking regulation and risk management in banking groups. Globalization increases the potential for markets and business cycles to become highly correlated in times of stress while banks are still lead-regulated at a national level. As the new banking regulation for internationally active banks (International Convergence of Capital Measurement and Capital Standards or short “Basel II”) (Basel Committee, 2004a, 2005b and 2006b) moves away from rigid controls towards enhancing efficient capital allocation through the disciplining effect of capital markets, improved prudential oversight and risk-based capital requirements, a better understanding of the economic impact of financial risks in a global context is essential. In light of new threats to financial stability from rising geopolitical risk, poor corporate governance and systemic risk from a slush of financial derivatives, operational risk is becoming an salient feature of risk management in financial institutions. Amid increased size and complexity of the banking industry, operational risk has a greater potential to transpire in greater and more harmful ways than many other sources of risk. Operational risk is commonly defined as the risk of some adverse outcome resulting from acts undertaken (or neglected) in carrying out business activities, inadequate or failed internal processes and information systems, misconduct by people or from external events (Basel Committee, 2004a, 2005b and 2006b). This definition includes legal risk from the failure to comply with laws as well as prudent ethical standards and contractual obligations, but excludes strategic and reputational risk. The measurement and regulation of operational risk is quite distinct from other types of banking risks, because it deals mainly with tail events (i.e. low probability scenarios) rather than central projections. The loss distribution of operational risk is heavy-tailed, i.e. there is a higher chance of an extreme loss event (with high loss severity) than the asymptotic tail behavior of standard limit distributions would suggest. These extreme operational risk losses are one-off events of large economic impact without historical precedent. The incidence and relative magnitude of internal or external disruptions to business activities from operational risk events also vary considerably across banks depending on the nature of banking activities and the sophistication of internal risk measurement standards and control mechanisms. This elusive nature of operational risk complicates systematic and coherent risk management. While banks should generate enough expected revenues to support a net margin that absorbs expected operational risk losses from predictable internal failures, they also need to hold sufficient capital reserves to cover the unexpected losses or resort to insurance. Against this background the efficient operational risk management hinges on several issues: (i) the judicious combination of qualitative and quantitative measures of risk estimation, (ii) the robustness of these measures, given the rare incidence of high-impact operational risk events without historical precedence, (iii) the -2-
sensitivity of regulatory capital charges to the varied nature of operational risk and reporting standards across different business activities, and (iv) the risk of conflicting regulatory measures across countries. Most research on operational risk in recent past has focused either on the quality of quantitative measurement methods of operational risk exposure (Makarov, 2006, Grody et al, 2005; de Fontnouvelle et al., 2004; Alexander, 2003; Coleman and Cruz, 1999; Cruz et al., 1998) or theoretical models of economic incentives for the management and insurance of operational risk (Leippold and Vanini, 2003, Crouhy et al., 2004; Banerjee and Banipal, 2005). Only little attention has been devoted to modeling constraints and statistical issues of consistent operational risk measurement within and across banks (Currie, 2004 and 2005). The main contribution of this paper is to provide a succinct investigation of how loss reporting and model specification affect operational risk measurement. We first explain the working concept of the current regulatory treatment of operational risk under the New Basel Capital Accord. We then deliver insights about how the varying characteristics of operational risk and different methods to identify, collect and report losses influence the reliability of operational risk estimates. The implications of our findings offer instructive and tractable recommendations for a more consistent operational risk measurement.
2
REGULATORY FRAMEWORK FOR THE TREATMENT OF OPERATIONAL RISK
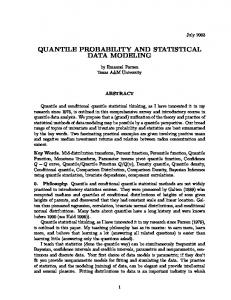
Regulatory efforts have contributed in large parts to the evolution of operational risk measurement as a distinct discipline. Unlike the old “one-size fits all” regulatory framework of the 1988 Basel Capital Accord, the new capital rules of Basel II contain explicit provisions for operational risk exposure based on earlier recommendations in the Working Paper on the Regulatory Treatment of Operational Risk (Basel Committee, 2001c) and Sound Practices for the Management and Supervision of Operational Risk (Basel Committee, 2001a, 2002 and 2003c) (see Fig. 1). Operational risk losses include all out-of-pocket expenses associated with an operational event but exclude opportunity costs, foregone revenue, or costs related to investment programs implemented to prevent subsequent losses. The Operational Risk Subgroup (AIGOR) of the Basel Committee Accord Implementation Group defines three different quantitative measurement approaches in a continuum of increasing sophistication and risk sensitivity for the estimation of operational risk based on eight business lines (BLs) and seven event types (ETs)2 as units of measure (Basel Committee, 2003a).3 Risk estimates from different units of measure must be added for purposes of calculating the regulatory minimum capital requirement for operational risk. Although provisions for supervisory review (Pillar 2 of Basel II) allow signatory countries to select approaches to operational risk that may be applied to local financial markets, such national discretion is confined by the tenet of consistent global banking standards. The first two approaches, the Basic Indicator Approach (BIA) and the Standardized Approach (TSA),4 define deterministic standards of regulatory capital by assuming a fixed percentage of gross income over a three-year period5 as a volume-based metric of unexpected operational risk exposure. BIA requires banks to -3-
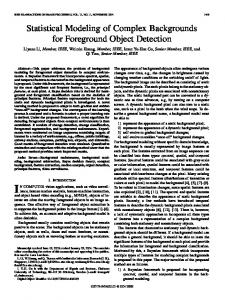
provision a fixed percentage (15%) of their average gross income over the previous three years for operational risk losses, whereas TSA sets regulatory capital to at least the three-year average of the summation of different regulatory capital charges (as a prescribed percentages of gross income that varies by business activity) across BLs in each year (Basel Committee, 2003c). The New Basel Capital Accord also enlists the disciplining effect of capital markets (“market discipline” or Pillar 3) in order to enhance efficiency of operational risk regulation by encouraging the wider development of adequate management and control systems. In particular, the current regulatory framework allows banks to calculate regulatory capital using their own internal risk measurement models under the standards of Advanced Measurement Approaches (AMA) in support of more risksensitive capital requirements. Operational risk measurement via AMA is based on the self-assessment of the frequency and loss severity of operational risk events and represents the most flexible regulatory approach subject to several qualitative and quantitative criteria and soundness standards.6 While the qualitative criteria center on the integrity of a sound internal operational risk measurement system for adequate risk management and oversight, the quantitative aspects of AMA define regulatory capital as protection against both EL and UL from operational risk exposure at a soundness standard consistent with a 99.9 percent statistical confidence level8 over a one-year holding period. The AMA-based capital charge covers total operational risk exposure unless EL is already offset by eligible reserves under GAAP (“EL breakout” or “EL offset”), such as capital-like substitutes, or some other conceptually sound method to control for losses that arise from normal operating circumstances. Although the Basel Committee does not mandate the use of a particular quantitative methodology, the estimation of potential operational risk losses under AMA is subject to the use of (i) internal data, (ii) external data, (iii) scenario analysis, and (iv) business environment and internal control factors (BEICFs) as quantitative elements.9 The Loss Distribution Approach (LDA) has emerged as one of the most expedient statistical methods to derive the risk-based capital charge for operational risk in line with the four quantitative elements of AMA (with certain capital adjustments). The historical experience of operational risk events suggests a heavy-tailed loss distribution, whose shape reflects highly predictable, small loss events left of the mean with cumulative density of EL (see Fig. 2). As loss severity increases, higher percentiles indicate a lower probability of extreme observations with high loss severity, which constitute UL. While EL attracts regulatory capital, the low frequency of UL exposure requires economic capital coverage. If we define the distribution of operational risk losses as an intensity
process
of
time
t,
the
expected
conditional
probability
EL ( T − t ) = E ⎡⎣ P ( T ) − P ( t ) P ( T ) − P ( t ) < 0 ⎤⎦ specifies EL over time horizon T, while the probability UL ( T − t ) = Pα ( T − t ) − EL ( T − t ) of UL captures losses larger than EL below a tail cut-off
E ⎡⎣ Pα ( T ) − P ( t ) ⎤⎦ , beyond which any residual or extreme loss (“tail risk”) occurs at a probability of α or less.
-4-
This definition of UL concurs with the concept of Value-at-Risk (VaR), which estimates the maximum loss exposure at a certain probability bound for a given aggregate loss distribution. However, the rare incidence of severe operational risk losses does not mesh easily with the distributional assumptions of conventional VaR. The fat-tailed behavior of operational risk defies statistical inference about loss severity as a central projection when all data points of the empirical loss distribution are used to estimate the maximum loss for a given level of statistical confidence. Therefore, when extreme losses are more likely than standard limit distributions would imply, VaR is a rather ill-suited concept for risk estimation and warrants adjustments that explicitly account for extremes at high percentiles. Extreme Value Theory (EVT) can redress the shortcomings of VaR in compliance with existing regulatory capital standards of AMA without imposing additional modeling restrictions.10 EVT is a general statistical concept that defines a limit law of the asymptotic (upper tail) behavior of sample maxima (or minima). In the context of risk management, it specifies the limiting behavior of extreme losses over a given time horizon. If operational risk losses are indeed extreme value, integrating EVT into the VaR methodology as “EVT-VaR” helps improve the estimation of operational risk under AMA in extreme quantiles.
3
CRITICAL REMARKS ABOUT CURRENT PRACTICES OF OPERATIONAL RISK MEASUREMENT FOR REGULATORY PURPOSES
3.1
Heterogeneity of operational risk data and regulatory consistency
Although significant progress has been made in the quantification of operational risk, ongoing supervisory review and several industry studies, such as the recent publication by the Basel Committee (2006a) on the Observed Range of Practice in Key Elements of Advanced Measurement Approaches (AMA), indicate that significant challenges remain in the way conflicting economic incentives and prudential standards can be reconciled to support a coherent regulatory framework. A wide range of risk measurement methods (quantitative and qualitative) and different levels of sophistication of ORM systems induce heterogeneous risk estimates across banks and compromise reliable and consistent regulatory standards. Recent efforts by the biggest U.S. financial institutions11 to seek simplified capital rules do not only underscore the importance of consistent regulatory standards, but also reveal that current implementation guidelines are still found wanting. 3.2
Heterogeneity of operational risk data and risk management challenges
Greater discretion of banks to tailor prescribed measurement standards to their specific organizational structure, business activity and economic capital model, has favored quantitative estimation methods of operational risk. Amid a more risk-sensitive regulatory framework with broadly defined expectations of ORM, risk managers need to be particularly mindful of the shortcomings of quantitative risk measurement methods and how the efficacy of operational risk estimates is influenced by (i) the scale, scope, and complexity of different banking activities, (ii) the characteristics of internal loss data, as well as (iii) exogenous factors, such as methods of -5-
data collection and business environment and internal control factors (BEICFs). O’Dell (2005) reports that operational risk estimates submitted by U.S. banks as part of the LDCE in 2004 showed little convergence to common units of measure and requirements on the data collection due to different granularity of risk quantification.12 Methodological difficulties of cross-sectional consistency are often magnified by notorious data limitations, which impede risk estimates for very granular units of measure.13 The innate elusiveness of certain sources of operational risk imposes practical limitations on their measurability through quantitative methods. Qualitative self-assessment can, to some extent, compensate for these shortcomings and help identify the possibility and the severity of operational risk events in areas where empirical observations are hard to come by – but only in general ways. Even if operational risk losses are assessed at every level and in every nook and cranny of the bank,14 subjective judgments are prone to historic bias and rely on rough approximation for lack of precise estimates of probability and loss severity. 3.3
Data sources and collection of loss data
Since meaningful results from AMA-based risk estimates require a large enough sample of observations under the proposed soundness standards, certain BLs and/or ETs with insufficient empirical loss data might restrict operational risk estimation to a certain set of “well-populated” units of measure. Although regulators allow the use of external data to redress the lack of an adequate internal loss history, the pooling of loss data is stricken with difficulties. While internal data (if available) serves as a valid empirical basis for the quantification of individual bank exposure, the analysis of system-wide pooled data delivers misleading results, mainly because it is constructed by aggregating across several banks and represents the operational risk exposure of the resulting composite bank. Since the historical loss experience is typically germane to one bank and might not be applicable to another bank, pooled data hides cross-sectional diversity of individual risk profiles and frequently fail to substantiate a fair projection of historical losses. The natural heterogeneity of banking activity due to different organizational structures and risk management capabilities belies the efficacy of an aggregate risk measure. In particular, divergent definitions of operational risk and control mechanisms, variable collection methods of loss data, and inconsistent data availability for different BLs and/or ETs contingent on the scale and scope of individual banks’ main business activities are critical impediments to data pooling and obscure estimates of actual risk exposure. The use of pooled loss data in quantitative measurement models without suitable adjustments of external data by the internal loss profile, key risk indicators and internal control factors is questionable and should be presented in a fashion that is statistically meaningful. Similar to the potential aggregation bias caused by data pooling of internal and external loss data, the blurred distinction of operational risk from other sources of risk (such as market and credit risk) hampers accurate
-6-
empirical loss specification. Contingencies of data collection arise from the commingling of risk types in the process of loss identification, which might understate actual operational risk exposure. 3.4
Effects of loss reporting
The availability and reliability of loss data on operational risk events for quantitative analysis hinges on the loss profile of different banking activities and the capacity of ORM systems to identify, report and monitor operational risk exposures in a consistent fashion. Different risk management processes could undermine consistent operational risk reporting by reinforcing possible heterogeneity of loss severity and loss frequency. 3.4.1
The effect of loss frequency
The effect of dissimilar frequency of loss events within and across banks as well as over time is probably the single most important but often overlooked impediment to the dependable quantification of operational risk for comparative purposes. Variations of reported event frequency can indirectly affect the volatility of losses and the estimation of EL and UL. 3.4.1.1
The effect of loss frequency on expected loss (EL)
The recent clarification on The Treatment of Expected Losses by Banks Using the AMA Under the Basel II Framework (Basel Committee, 2005c) by the Operational Risk Subgroup (AIGOR) of the Basel Committee Accord Implementation Group acknowledges in particular the possibility of biased estimation of EL depending on the manner in which operational risk events are recorded over time. Loss frequency directly affects EL. A higher (lower) loss frequency decreases (increases) EL automatically in the trivial case of unchanged total exposure. The consideration of loss variation is essential to a non-trivial identification of misrepresented EL caused by inconsistent loss frequency. A bank that reports a lower (higher) EL due to a higher (lower) incidence of operational risk events should not be treated the same as another bank that reports similar loss exposure (over the same time period) but a higher (lower) variation of operational risk losses. In this case, banks with more granular operational risk events would benefit from lower EL if loss volatility decreases disproportionately with each additional operational risk event. The same intuition applies to the more realistic case of different total exposure. Higher (lower) loss frequency would decrease (increase) EL only if variation declines (rises) with higher (lower). Hence, the adequate estimation of operational risk exposure entails a relative rather than an absolute concept of consistent frequency over one or multiple time periods. Since the capital charge for operational risk under the new regulatory framework is based on the sum of operational risk estimates for different units of measure, inconsistent loss frequencies might substantially distort a true representation of EL and UL within and across reporting banks. A “systemically inconsistent frequency measure” of operational risk for the same unit of measure (defined by either BL, ET or both) of different banks arises if lower (higher) EL and a higher (lower) total loss amount is associated with lower -7-
(higher) marginal loss volatility caused by a larger (smaller) number of observations. The same concept of inconsistent frequency applies to different units of measure within the same bank. The case of “idiosyncratically inconsistent frequency” is admittedly harder to argue, given the inherently heterogeneous nature of operational risk exposure of different banking activities. If the loss frequency for one BL or ET of a single bank changes considerably from one time period to another, it might also constitute a “time inconsistent frequency measure”, which amplifies idiosyncratic or systemically inconsistent loss frequency of two or more different BLs or ETs within a single bank or a single BL or ET across different banks respectively. Regulatory guidance on estimation bias from the inconsistent frequency of operational risk events would need to ensure that risk estimates based on different empirical loss frequency preserve the marginal loss variation in support of a time consistent measurement of EL. A simple detection mechanism of pairwise idiosyncratically inconsistent loss frequency would compare the coefficient of variation σ μ and the mean μ (EL) of N number of losses in two different units of measure, such as two BLs (BL1 and BL2), over time period τ. While
⎛ σ BL1,τ
μBL τ > μBL τ ⎜ 1,
⎜ μBL 1,τ ⎝
2,
>
σ BL τ ⎞
⎟ if N BL1,τ < N BL2 ,τ ∧ N BL1,τ μBL1,τ ≤ N BL2 ,τ μBL2 ,τ ,
2,
μBL τ ⎟⎠
(3)
2,
indicates “insufficient” observations for the first BL relative to the second,
⎛ σ BL1,τ
μBL τ < μBL τ ⎜ 1,
⎜ μBL 1,τ ⎝
2,
N BL2 ,τ ∧ N BL1,τ μBL1,τ ≥ N BL2 ,τ μBL2 ,τ
2,
(4)
μBL τ ⎟⎠ 2,
flags excessively granular observations of the first BL relative to the second, given a decrease (increase) of loss volatility at higher (lower) loss frequency. The four remaining permutations of loss variation and EL indicate “frequency consistent” reporting across the two BLs under consideration. Extending both equations above to all BLs (BL1-8) or ETs (ET1-7) defined by the Basel Committee (2004a, 2005b and 2006b) to
μ{BL
⎛σ ⎛σ ⎞⎞ ⎜ {BLx ,τ , ETx ,τ } > m ⎜ {BL1−8 ,τ , ET1−7 ,τ } ⎟ ⎟ μ > m {BL1−8 ,τ , ET1−7 ,τ } ⎜ μ x ,τ , ETx ,τ } ⎜ μ{BL , ET } ⎟ ⎟ 1−8 ,τ 1−7 ,τ ⎝ ⎠⎠ ⎝ {BLx ,τ , ETx ,τ }
)
(
)
(
⎛σ
⎛ σ {BL , ET } ⎞ ⎞ 1−8 ,τ 1−7 ,τ ⎟⎟ < m⎜ μ ⎜ ⎟⎟ BL x ,τ , ETx ,τ } BL , ET { } 1−8 ,τ 1−7 ,τ ⎝ ⎠⎠
(
if N {BL , ET } < m N {BL , ET } ∧ N {BL , ET } μ{BL , ET } ≤ m N {BL , ET } μ{BL , ET } x ,τ x ,τ 1−8 ,τ 1−7 ,τ x ,τ x ,τ x ,τ x ,τ 1−8 ,τ 1−7 ,τ 1−8 ,τ 1−7 ,τ
(5)
)
and
μ{BL
x ,τ
, ETx ,τ }
(
< m μ{BL
(
1−8 ,τ
, ET1−7 ,τ }
) ⎜⎜ μ{{ ⎝
)
BL x ,τ , ETx ,τ }
(
if N {BL , ET } > m N {BL , ET } ∧ N {BL , ET } μ{BL , ET } ≥ m N {BL , ET } μ{BL , ET } x ,τ x ,τ 1−8 ,τ 1−7 ,τ x ,τ x ,τ x ,τ x ,τ 1−8 ,τ 1−7 ,τ 1−8 ,τ 1−7 ,τ
-8-
(6)
)
identifies the idiosyncratically inconsistent loss frequency of any individual BL (BLx) or ET (ETx) of the same bank based on the median (m) values of variation, mean and frequency of losses across all BLs or ETs. The same detection mechanism applies to cases of systemically inconsistent loss frequency for the same BL or ET across different banks, or time inconsistent loss frequency over multiple time periods.
3.4.1.2
The effect of loss frequency on unexpected loss (UL)
The reported frequency of reported operational risk events does not only influence the EL but also the estimation of UL. Irrespective of the stochastic process of extremes, higher (lower) overall loss frequency would attribute lower (higher) probability to extreme events and increases estimation risk of UL if higher (lower) loss frequency coincides with lower (higher) loss variation at the margin. Given the high sensitivity of UL to changes in the probability of extreme events, an inconsistent frequency measure could interfere with the reliable estimation of UL from both a systemic and idiosyncratic point of view at one or multiple periods of time. Banks could also employ loss frequency as a vehicle to diffuse the impact of extreme loss severity across different BLs and/or ETs (“organizational diversification”), if they define risk ownership and units of measure for risk estimates in a way relegates the incidence of extreme events to even higher percentiles. Similar to the implicit truncation effect of a minimum loss threshold on the availability of loss data, loss fragmentation might arise if banks choose to either split losses between various BLs affected by the same operational risk event or spread operational risk losses among other sources of risk, such as market or credit risk. Since the new capital rules prescribe the estimation of UL at a level of granularity that implies a loss frequency beyond actual data availability even for the largest banks, the best interest of banks lies in greater sample sizes, especially in cases of sparse internal loss data and less granular units of measure. Banks would naturally prefer higher (and inconsistent) loss frequency to substantiate regulatory capital for very predictable EL while reducing
economic capital for UL. The larger the benefit of a marginal reduction of loss volatility from higher loss frequency, the greater the incentive of banks to arbitrage existing regulatory provisions and temper the probability of extreme events by means of higher reporting frequency and granularity of risk estimates. The elusive nature of operational risk belies the general assumption of uniform frequency. While most operational risk losses comply with a static concept of loss frequency, different types of operational risk cause distinct stochastic properties of loss events, which also influence the relative incidence of extreme observations. One expedient solution to this problem is the aggregation of loss events in each unit of measure (defined by BL, ET or both) over a designated time period (weeks, months, quarters) in order to ensure the consistent econometric specification of operational risk exposure with different underlying loss frequency. Loss aggregation helps curb estimation bias from distinctive patterns of loss frequencies associated with different loss severity and units of measure (BLs and/or ETs) of operational risk within banks. An aggregate -9-
loss measure inhibits incentives to suppress EL through many, very small losses and increases the relative incidence of extreme events without distorting the loss severity of UL. Two different series of observations with either high frequency and low average loss severity or low frequency and high average loss severity would both converge to the same aggregate expected operational risk exposure over an infinite time period (assuming the same total loss amount). Loss aggregation also reveals time-varying loss frequency based on the relation between the mean and the median number of events in each time period of aggregation and the extent to which large fluctuations warrant adjustments to the assumption of constant loss frequency. Data limitations for robust risk estimation notwithstanding, the aggregation of operational risk losses delivers important insights about how measures of loss frequency are influenced by the type, loss severity, timing of operational risk events as well as the degree of granularity and specificity at which operational risk events are reported. 3.4.2
The effect of loss timing
While assumptions about loss frequency influence the quantitative specification of both EL and UL, the effect of loss timing is particularly pertinent to the identification of extreme observations for the estimation of UL.15 Since risk measures of extremes are inherently prone to yield unstable results, mainly because point estimates at high percentile levels hinge on a small number of extreme observations, a close examination of how loss timing qualifies the classification of extreme events becomes an exceedingly important part of reliable quantitative operational risk analysis. Loss timing matters to the selection of extremes when the mean and the maximum loss severity of operational risk events exhibit significant cyclical variation or structural change over prolonged periods of time. For an indiscriminate treatment of timing, periodic shifts in EL influence the definition of what constitutes an extreme observation and cause estimation bias of UL, which might also be magnified or tempered by changes in general loss frequency. Extremes can be selected either by absolute measure, if their loss severity exceeds a certain time-invariant threshold value at any point in time over the entire sample period, or by relative measure, if their loss severity represents the maximum exposure within a designated time interval of the entire sample period. An absolute (time-invariant) measure does not discriminate against the relative economic impact of loss severity, because it disregards the possibility that the operational risk exposure of “smaller extremes” could entail a greater impact on the income generation of a bank than “larger extremes” at other points in time when firm-specific or other fundamental factors are above some long-run average. The consideration of timing would require a relative selection of extremes that identifies a certain number of (periodic) maxima in non-overlapping time intervals over the given sample time period. These time intervals should be large enough to ensure that observed extremes are independent of each other, yet small enough so that the significance of “lower” extremes are not washed out by a cluster of extreme or a slowly moving average of high EL. Alternatively, extremes could be - 10 -
selected from constant time intervals defined by rolling windows with daily, weekly, monthly updating (Coleman and Cruz, 1999; Cruz at al., 1998) in order to mitigate problems associated with a time-invariant qualification of extreme observations. The concept of relative extremes within the context of loss timing also raises the general question of whether individual operational risk losses should be scaled in order to account for variations of relative economic impact of loss severity at certain points in time for different banks or types of banking activity. Losses could expressed as relative amounts to some average exposure over a specified time period or scaled by some fundamental data.16 If loss timing does not influence the decision of whether some loss severity is deemed sufficiently high to be considered extreme, an absolute selection criteria yield the most reliable designation of extremes. 3.5
Model Sensitivity
Besides the impact of the collection and reporting of loss data on the consistent estimation of operational risk exposure, the model sensitivity of quantitative risk measurement approaches continues to be a source of perennial concern for risk managers and regulators alike. Quantitative models involve parameter uncertainty and estimation risk if the historical loss profile is a poor predictor of future exposure. In a dynamic world with drift, fluctuations of operational risk exposure defy steady state approximation based on the historical loss distribution. Similar to critical path analysis in project management, where the critical path changes in response to management action, the pattern of future losses – in particular extreme losses – might diverge from historical priors as banks become more adept at managing operational risk.17 The dynamic transmission process of operational risk exposure represents a serious impediment to the validity of LDA and related concepts of modeling operational risk exposure. Even if the frequency and loss severity of operational risk remains relatively stable over time, the high sensitivity of UL to the asymptotic tail properties of the empirical loss distribution complicates the appropriate allocation of economic capital. Risk estimates become exceedingly sensitive to the delicate tradeoff between the percentile level of point estimates and the required minimum loss severity of extremes, which is frequently amplified by the chosen estimation method. While low percentiles imply more reliable point estimates of UL with higher parameter stability over different estimation methods and time periods due to a higher incidence of extremes, they are likely to understate the residual risk from extreme losses. Conversely, higher statistical confidence is bound to yield less stable estimates, because it either (i) removes the percentile level of point estimates further from pre-specified threshold, which increases the chances of out-of-sample estimation, or (ii) raises the threshold, which limits the number of extremes for the estimation of the asymptotic tail shape. Since the current soundness standards of AMA fail to acknowledge the high sensitivity of point estimates to the threshold choice, the stringent quantitative criteria under the current regulatory framework appear to have been deliberately chosen by the Basel Committee to redress data limitations by encouraging better monitoring, measuring and managing of operational risk.18 - 11 -
Given the high percentile level of risk estimates of operational risk exposure under AMA (Basel Committee, 2004a, 2005b and 2006b), incentives for regulatory compliance require the cost of improved data collection and ORM to be offset by capital savings vis-à-vis an explicit volume-based capital charge under standardized approaches to operational risk measurement.19 Evidence from a cursory examination of balance sheet data of U.S. commercial banks suggests significant benefits from AMA-based self-assessment over a standardized measure of 15% of gross income, which would grossly overstates the economic impact of even the most extreme operational risk events in the past, such as the physical damage to assets suffered by the Bank of New
York in the wake of the 9/11 terrorist attacks (see Tab. 1). The Top 15 U.S. banks would have lost not even five percent of gross income on average had they experienced an operational risk event of similar severity in 2004.
4
CONCLUSION
In this paper, we examined the various modeling constraints and critical issues of consistent risk estimation. We provided important insights about the influence of loss characteristics and exogenous constraints on reliable operational risk estimates. Our findings reveal that effective operational risk measurement hinges on how the reporting of operational risk losses and the model sensitivity of quantitative methods affect the generation of consistent risk estimates. Although quantitative measurement approaches have evolved into a distinct discipline that appeals to the usage of economic capital as determinant of risk-based regulatory standards for sound banking activities, the elusive nature of extreme operational risk events without historical precedent defies purely quantitative approaches and necessitates a qualitative overlay in many instances. There are statistically measurable types of operational risk with available loss data, and sources of risk for which there is and never can be data to support anything but an exercise requiring subjective judgment and estimation. While the former type of exposure follows from very predictable stochastic patterns of operational risk events, whose high frequency caters to quantitative measures, the latter defines aberrant events, whose implications might be hard to predict and impossible, or at best, difficult to measure because they have never occurred. Aside from the diverse characteristics of different sources of operational risk, data limitations, heterogeneous reporting of operational risk events and the organization of operational risk ownership within banks further encumber a reliable and consistent estimation of operational risk exposure. Stringent regulatory standards for internal measurement methods of operational risk amplify the considerable model risk of quantitative approaches, as high percentile levels of operational risk estimates require a large enough sample of loss data. Clearly structural models based on macroeconomic factors and key risk indicators (KRIs), augmented by risk and control self-assessments (RCSA) would help inform a better forecast of future losses from operational risk and foster a more accurate allocation of regulatory capital.
- 12 -
Effective ORM mitigates the impact of extreme loss events on the quality and stability of earnings while ensuring adequate capitalization in order to enhance strategic decision-making and reduce the probability of bank failure. In general, the role of economic capital for effective operational risk management can be appreciated from the consideration of gambler’s ruin. Too little capital puts a bank at risk, while too much capital will result in the bank not achieving the required rate of return on capital. An increase of capital will not necessarily improve the soundness of banks whose survival is ultimately determined by the most profitable execution of business activities. Given the elusive nature of operational risk and the absence of risk-return trade-off (unlike market and credit risk), it is incumbent on regulators to entertain regulations that inculcate a strong sense of perpetual improvement of effective ORM. The intricate causality of operational risk will continue to require intensive collaboration between supervisors and banks as regards the implementation of regulatory guidelines that better reflect the economic reality of operational risk.
- 13 -
5
REFERENCES
Alexander, C. (ed.) (2003). Operational Risk: Regulation, Analysis and Management. Financial Times - Prentice Hall Banerjee, S. and K. Banipal (2005), “Managing Operational Risk: Framework for Financial Institutions,” Working paper, A.B Freeman School of Business, Tulane University (November). Basel Committee on Banking Supervision (2006a). Observed Range of Practice in Key Elements of Advanced Measurement Approaches (AMA). BCBS Publications No. 131, Bank for International Settlements (October) (http://www.bis.org/publ/bcbs131.htm) Basel Committee on Banking Supervision (2006b). Basel II: International Convergence of Capital Measurement and Capital Standards: A Revised Framework - Comprehensive Version. BCBS Publications No. 128, Bank for International Settlements (June) (http://www.bis.org/publ/bcbs128.htm). Basel Committee on Banking Supervision (2005b). Basel II: International Convergence of Capital Measurement and Capital Standards: A Revised Framework. BCBS Publications No. 118, Bank for International Settlements (November) (http://www.bis.org/publ/bcbs118.htm). Basel Committee on Banking Supervision (2005c). The Treatment of Expected Losses by Banks Using the AMA Under the Basel II Framework. Basel Committee Newsletter No. 7, Bank for International Settlements (November). Basel Committee on Banking Supervision (2004a). International Convergence of Capital Measurement and Capital Standards: A Revised Framework. BCBS Publications No. 107, Bank for International Settlements (June) (http://www.bis.org/publ/bcbs107.htm). Basel Committee on Banking Supervision (2003a). Operational Risk Transfer Across Financial Sectors. Joint Forum Paper, Bank for International Settlements (August) (www.bis.org/publ/joint06.htm). Basel Committee on Banking Supervision (2003c). Sound Practices for the Management and Supervision of Operational Risk. BCBS Publications No. 96, Bank for International Settlements (February) (http://www.bis.org/publ/bcbs96.htm). Basel Committee on Banking Supervision (2002). Sound Practices for the Management and Supervision of Operational Risk. BCBS Publications No. 91, Bank for International Settlements (July) (http://www.bis.org/publ/bcbs91.htm). Basel Committee on Banking Supervision (2001a). Sound Practices for the Management and Supervision of Operational Risk. BCBS Publications No. 86, Bank for International Settlements (December) (http://www.bis.org/publ/bcbs86.htm). Basel Committee on Banking Supervision (2001c). Working Paper on the Regulatory Treatment of Operational Risk. BCBS Publications (Working Paper) No. 8, Bank for International Settlements (September) (http://www.bis.org/publ/bcbs_wp8.pdf). Coleman, R. and M. Cruz (1999), “Operational Risk Measurement and Pricing ,” Derivatives Week, Vol. 8, No. 30 (July 26), 5-6. Crouhy, M., Galai, D. and M. Robert (2004), “Insuring versus Self-insuring Operational Risk: Viewpoints of Depositors and Shareholders,” Journal of Derivatives (Winter). Cruz, M., Coleman, R. and G. Salkin (1998), “Modeling and Measuring Operational Risk,” Journal of Risk, Vol. 1, No. 1, 63-72.
- 14 -
Currie, C. V. (2005), “A Test of the Strategic Effect of Basel II Operational Risk Requirements on Banks,” School of Finance and Economics Working Paper No. 143 (September), University of Technology, Sydney. Currie, C. V. (2004), “Basel II and Operational Risk - Overview of Key Concerns,” School of Finance and Economics Working Paper No. 134 (March), University of Technology, Sydney. de Fontnouvelle, P. (2005), “The 2004 Loss Data Collection Exercise,” presentation at the Implementing an AMA for Operational Risk conference of the Federal Reserve Bank of Boston (May 19) (http://www.bos.frb.org/bankinfo/conevent/oprisk2005/defontnouvelle.pdf). de Fontnouvelle, P., Rosengren, E. S. and J. S. Jordan (2004), “Implications of Alternative Operational Risk Modeling Techniques,” SSRN Working Paper (June) (http://www.algorithmics.com/solutions/opvantage/docs/OpRiskModelingTechniques.pdf). Grody, A. D., Harmantzis, F. C. and G. J. Kaple (2005), “Operational Risk and Reference Data: Exploring Costs, Capital Requirements and Risk Mitigation, “ Working paper (November), Stevens Institute of Technology, Hoboken, NJ. Larsen, P. T. and K. Guha (2006), “US Banks Seek Looser Basel II Rules,” The Financial Times (3 August). Leippold, M. and P. Vanini (2003), “The Quantification of Operational Risk,” SSRN Working paper (November). Makarov, M. (2006), “Extreme Value Theory and High Quantile Convergence,” Journal of Operational Risk, Vol. 1, No. 2. Matz, L. (2005), “Measuring Operational Risk: Are We Taxiing Down the Wrong Runways ?” Bank Accounting and Finance, Vol. 18, No. 2, 3-6 and 47. O’Dell, M. (2005), “Quantitative Impact Study 4: Preliminary Results – AMA Framework,” presentation at the Implementing an AMA for Operational Risk conference of the Federal Reserve Bank of Boston (May 19) (http://www.bos.frb.org/bankinfo/conevent/oprisk2005/odell.pdf). Seivold, A., Leifer, S. and S. Ulman (2006), “Operational Risk Management: An Evolving Discipline,” Supervisory Insights, Federal Deposit Insurance Corporation (FDIC) (http://www.fdic.gov/regulations/examinations/supervisory/insights/sisum06/article01_risk.html).
- 15 -
APPENDIX Risk Management Group of the Basel Committee Operational Risk Subgroup (AIGOR) of the Basel Committee Accord Implementation Group
Operational Operational Risk Risk ManageManagement ment (09/1998) (09/1998) and and AANew New Capital Capital Adequacy Adequacy Framework Framework (06/1999) (06/1999)
Impact Studies & Guidelines
BIS Publications
1st Consultative Phase
Consultative Consultative Document Document-Operational Operational Risk Risk (Supporting (Supporting Document Documentto to the theNew New Basel BaselCapital Capital Accord) Accord) (01/2001) (01/2001)
QIS QIS2: 2: Operational Operational Risk RiskLoss LossData/ Data/ “Tranche “Tranche22for for Operational Operational Risk” Risk” (05/2001(05/200101/2002) 01/2002)
2nd Consultative Phase
Working Working Paper Paperon on the the Regulatory Regulatory Treatment Treatment of of Operational Operational Risk Risk (09/2001) (09/2001)
Risk Risk Management Management Practices Practicesand and Regulatory Regulatory Capital: Capital:CrossCrosssectional sectional Comparison Comparison (11/2001) (11/2001)
Sound SoundPractices Practicesfor forthe the Management Managementand and Supervision Supervisionof ofOperational Operational Risk Risk (three (threeversions versionson on 12/2001, 12/2001,07/2002, 07/2002,and and02/2003) 02/2003)
QIS QIS3: 3: Operational OperationalRisk Risk Loss LossData Data [Section [SectionV, V, Technical Technical Guidance] Guidance] (10/2002-05/2003) (10/2002-05/2003)
Operational Operational Risk Risk Transfer Transfer Across Across Financial Financial Sectors Sectors (08/2003) (08/2003)
Joint JointSupervisory Supervisory Guidance Guidanceon on Operational OperationalRisk Risk Advanced Advanced Measurement Measurement Approaches Approachesfor for Regulatory RegulatoryCapital Capital (07/2003) (07/2003)
U.S. Regulatory Guidance
Principles Principlesfor for the theHomeHomeHost Host Recognition Recognition ofofAMA AMA Operational Operational Risk RiskCapital Capital (01/2004) (01/2004)
3rd Consultative Phase
The TheNew New Basel Basel Accord Accord–– Consultative Consultative Document Document (Third (Third Consultative Consultative Paper Paper(CP3)) (CP3)) (02/2003) (02/2003)
QIS QIS4: 4: National National impact impact studies studiesand and field fieldtests tests (2004-2005) (2004-2005)
ANPR ANPRon on Risk-Based Risk-BasedCapital Capital Guidelines: Guidelines: Internal InternalRatingsRatingsBased BasedCapital Capital Requirement Requirement (08/2003) (08/2003)
The TheInternational International Convergence Convergenceof of Capital Capital Measurement Measurementand and Capital CapitalStandards: Standards: AARevised Revised Framework Framework (two (twoversions versionson on 06/2004 06/2004and and 11/2005) 11/2005)
QIS QIS5: 5: Operational Operational Risk RiskLoss Loss Data Data [Section [SectionVII, VII, Instructions] Instructions] (09/2005(09/200506/2006) 06/2006)
The TheInternational International Convergence Convergenceof of Capital Capital Measurement Measurementand and Capital Capital Standards: Standards:AA Revised Revised Framework Framework–– AAComprehensive Comprehensive Version Version (06/2006) (06/2006)
The The Treatment Treatment ofofExpected Expected Losses Lossesby by Banks Banks Using Usingthe the AMA AMA (11/2005) (11/2005)
Observed Observed Range Rangeofof Practice Practiceinin Key KeyElements Elements ofofAdvanced Advanced Measurement Measurement Approaches Approaches (10/2006) (10/2006)
Federal FederalFinancial FinancialInstitutions Institutions Examination ExaminationCouncil Council(FFIEC) (FFIEC) LDCE LDCE (06-11/2004 (06-11/2004)) and and QIS QIS44 Section SectionXIV XIV (10/2004-01/2005) (10/2004-01/2005)
Figure 1. The Evolution of the Regulatory Treatment of Operational Risk.
Probability density function
Probability
6
Capital Deduction (up to 20%)
Risk Capital for Operational Risk Exposure
VaRα=0.01% at 99.9% quantile (probability bound)
Mean of distribution
Expected Loss (EL)
Unexpected Loss (UL)
Extreme Loss
Aggregate Losses (Loss Severity)
Figure 2. Loss Distribution Approach (LDA) for AMA of operational risk under the New Basel Capital Accord.
17
Major Operational Loss Event
Insured U.S.-Chartered Commercial Banks1
(U.S.$140 million, Bank of New York, Sept. 11, 2001) (In percent of) NonInterest Total Interest Gross Tier 1 assets3 income Income Income Capital
(ranked by consolidated assets, as of Dec. 31, 2001)
Bank of America NA (Bank of America Corp.)2 JP Morgan Chase Bank (JP Morgan Chase & Co.) Citibank NA (Citigroup) Wachovia Bank NA (Wachovia Corp.) First Union Bank4 US Bank NA Bank One NA (Bank One Corp.) Wells Fargo Bank NA (Wells Fargo & Co.) Suntrust Bank HSBC Bank USA (HSBC NA) Bank of New York (Bank of New York Corp.) Key Bank NA (Key Corp.) State Street B&TC (State Street Corp.) PNC Bank NA (PNC Financial Services Group) LaSalle Bank NA (ABN Amro NA HC)
0.02 0.02 0.02 0.04 0.06 0.08 0.05 0.04 0.13 0.17 0.18 0.18 0.21 0.20 0.13
1.91 3.07 1.51 3.45 1.86 5.63 1.60 3.38 4.30 13.67 18.87 11.79 25.51 6.15 12.05
3.86 4.21 3.06 9.87 2.05 12.60 1.94 6.28 6.49 55.66 18.60 38.67 21.04 5.51 33.32
1.28 1.77 1.01 2.56 0.98 3.89 0.88 2.20 2.59 10.97 9.37 9.04 11.53 2.90 8.85
0.31 0.39 0.32 0.65 0.78 10.92 0.64 0.66 1.75 3.12 2.58 2.42 3.93 3.04 1.75
mean median std. dev.
0.10 0.08 0.07
7.65 4.30 7.24
14.88 6.49 16.01
4.65 2.59 4.01
2.22 1.75 2.68
Table 1. Hypothetical loss exposure of the largest U.S. commercial banks on September 11, 2001. 1/excluded is Fleet NA Bank (Fleetboston Financial Group), which merged with Bank of America NA in 2003. 2/ “regulatory top holder” listed in parentheses. 3/Total assets, gross income and Tier 1 capital represent the sum of assets, gross income and core capital of individual banking institutions under each top holder, ignoring adjustments in consolidation at holding company level. 4/After the merger with Wachovia, First Union did not publish financial accounts for end-2001. Fundamental information is taken from the 2000 Financial Statement. Source: Federal Reserve Board (2002), Federal Reserve Statistical Release - Large Commercial Banks (http://www.federalreserve.gov/releases/lbr/). #
International Monetary Fund (IMF), Monetary and Capital Markets Department (MCM), 700 19th Street, NW, Washington, D.C. 20431, USA; e-mail:
[email protected]. The views expressed in this article are those of the author and should not be attributed to the International Monetary Fund, its Executive Board, or its management. Any errors and omissions are the sole responsibility of the author. I am indebted to Marcelo Cruz, Rodney Coleman, Paul Kupiec, and Brendon Young for their comments. 2 The eight BLs are (i) corporate finance, (ii) trading and sales, (iii) retail banking, (iv) payment and settlement, (vi) agency services, (vi) commercial banking, (vii) asset management, and (viii) retail brokerage. The eight event (or loss) types are: (i) internal fraud, (ii) external fraud, (iii) employment practices and workplace safety, (iv) clients, products and business practices, (v) damage to physical assets, (vi) business disruption and system failures, and (vii) execution, delivery and process management. 3 A unit of measure represents the level at which a bank’s operational risk quantification system generates a separate distribution of potential operational risk losses (Seivold et al., 2006). A unit of measure could be a BL, and ET category or both. 4 At national supervisory discretion, a bank can be permitted to apply the Alternative Standardized Approach (ASA) if it provides an improved basis for the calculation of minimum capital requirements by, for instance, avoiding double counting of risks (Basle Committee, 2004a and 2005b).
18
The three-year average of a fixed percentage of gross income (BIA) or the summation of prescribed capital charges for various BLs (TSA) exclude periods in which gross income is negative from the calculation of RWAs. 6 The quantitative criteria of AMA also offer the possibility of capital adjustment due to diversification benefits from the correlation between extreme internal operational risk losses and the risk mitigating impact of insurance. 8 Many banks typically model economic capital at a confidence level between 99.96 and 99.98 percent, which implies an expected default rate comparable to “AA”-rated credit exposures. 9 U.S. federal bank regulators also specify five years of internal operational risk loss data and permit the use of external data for the calculation of regulatory capital for operational risk in their advanced notice on proposed rulemaking on Risk-Based Capital Guidelines – Implementation of the New Basel Accord (2003). In contrast, the Basel Committee (2005b and 2004a) requires only three years of data after initial adoption of AMA and then five years. Moreover, also note that for U.S.-supervised financial institutions AMA is the only permitted quantification approach for operational risk according to the Advanced Notice on Proposed Rulemaking (ANPR) on Risk-Based Capital Guidelines: Internal Ratings-Based Capital Requirement (2003a). 10 Within the general statistical concept of EVT, the generalized extreme value (GEV) distribution and the generalized Pareto distribution (GPD) are the most prominent methods to assess parametric models for the statistical estimation of the limiting behavior of extreme observations. While GEV identifies possible limiting laws of the asymptotic tail behavior associated with the order sequence of i.i.d. normalized extremes, GPD is an exceedance function that measures the residual risk of these extremes beyond a predefined threshold for regions of interest, where only a few or no observations are available. The Peak-over-Threshold (POT) method is the most popular technique to parametrically fit GPD based on the specification of a threshold, which determines how many exceedances shall be permitted to establish convergence of asymptotic tail behavior between GEV and GPD. See Appendices 2 and 3. 11 In August of 2006 representatives of Bank of America, J.P. Morgan Chase, Wachovia and Washington Mutual aimed to convince the Federal Reserve Board that they should be allowed to adopt a simplified version of the New Basel Capital Accord (Larsen and Guha, 2006), mainly because additional restrictions have raised the attendant cost of implementing more sophisticated risk measurement systems for such advanced models to a point where potential regulatory capital savings are virtually offset. 12 The Operational Risk Subgroup of the Basel Committee Accord Implementation Group (Basel Committee, 2004c) also found that the measurement of operational risk is limited by the quality of internal loss data, which tends to be based on short-term periods and includes very few, if any, high severity losses (which can dominate the bank’s historical loss experience). 13 Although the use of external loss data in self-assessment approaches helps banks overcome the scarcity of internal loss data, pooled loss data entail potential pitfalls from survivorship bias, the commingling of different sources of risk and greater mean convergence of aggregate historical loss. 14 Empirical evidence about operational risk losses (de Fontnouvelle, 2005) from the 2004 LDCE confirms a generally positive relation between loss frequency and EL of U.S. banks, which testifies to largely cross-sectionally consistent loss frequency at the highest possible level of aggregation (since BLs and ETs as units of measure are ignored). Empirical evidence suggests that high operational risk losses occur especially when managers are grossly overconfident about the existing governance and control mechanisms (Matz, 2005). 15 The selection of extremes over a designated threshold is a crucial element of exceedance functions, which fit GPD to an empirical distribution of extremes. 16 Note that our advocacy of a volume-based adjustment in this case is limited to the use of scaling for the purpose of threshold selection only. In general, the loss severity of operational risk events is independent of business volume, unless banks differ vastly in terms of balance sheet value. 17 I thank Brendon Young (Chief Executive Officer of the Operational Risk Research Forum (ORRF) Ltd.) for this point. 18 I thank Rodney Coleman (Imperial College, London) for this point. 19 In this simplified trade-off, we do not consider any other elements of operational risk regulation, such as capital adjustment, home-host recognition and volume-based measures, which impeded the consistent calculation of regulatory capital in certain situations. 5