Proceedings of the 2nd International Conference on Communication and Electronics Systems (ICCES 2017) IEEE Xplore Compliant - Part Number:CFP17AWO-ART, ISBN:978-1-5090-5013-0
Image Contrast Enhancement using DWT-SVD based Masking Technique Sandeepa K S
Basavaraj N Jagadale
J S Bhat
Department of Electronics, Kuvempu University Shimoga, Karnataka, India
[email protected]
Department of Electronics, Kuvempu University Shimoga, Karnataka, India
[email protected]
Department of Physics, Karnataka University, Karnataka, India
[email protected]
Naveen Kumar R
Mukund N Naagund
Department of Electronics, Kuvempu University Shimoga, Karnataka, India
[email protected]
Department of Electronics, Kuvempu University Shimoga, Karnataka, India Mukund.n.nargund@christuniversity .in
Abstract: A new approach based on masking technique for contrast enhancement of medical image is presented due to the low contrast characteristics. In medical image, preserving mean brightness, average information and noise factor reduction are essential to make input image more appealing visually. The proposed method incorporates spatial and frequency domain techniques to enhance the contrast of the medical image. The mask is formulated effectively between reconstructed approximation coefficients and inverse singular value decomposition (ISVD) to obtain contrast residual. Discrete wavelet transformation (DWT) and singular value decomposition (SVD) have used to decompose the input image. At last maximum contrast enhancement achieved by adding mask with the image obtained through intensity exposure histogram equalization (IEHE). The proposed approach is tested for medical images by comparing its peak signal to noise Ratio (PSNR), absolute mean brightness error (AMBE) and entropy with some existing methods and also measured in terms of visual quality. Keywords—Intensity Exposure Histogram Equalization, Discrete Wavelet Transformation, Reconstruction Approximation, Singular Value Decomposition, Incverse Singular Value Decoposition, Masking technique.
I. INTRODUCTION Image plays an important role in medical, civil, security, astronomy, animation, forensic, web design. Image enhancement is one of the area that helps to improve the image quality and its visual perception. The contrast enhancement and image de-noising are important in medical diagnosis through images of medical applications such as X-Ray, computed tomography (CT), magnetic resonance image (MRI), magnetic resonance angiography (MRA) and position emission tomography (PET), ultrasonic scanning, electrons micrographs etc. [1]. The image enhancement broadly classified into two categories: spatial domain and transform domain. Spatial domain operates on pixel level and transform domain operate on frequency of the images [2]. The spatial domain approach is
Panchaxri SSA Govt First Grade Collede, Ballari Karnataka, India
[email protected]
broadly classified as direct and indirect method. In direct method image is improved by using the contrast measures and in indirect method histogram modification technique is used. Indirect methods attract the researchers because of simplicity and computational efficiency [3]. The Histogram Equalization (HE) is the simple contrast enhancement technique but it generates annoying artifacts and intensity saturation effect [4]. To solve these drawbacks sub-image histogram equalization of Brightness Preserving Bi-Histogram Equalization (BBHE), Dualistic Sub Image Histogram Equalization (DSIHE) methods are employed to preserve brightness. Some advance method of HE like adaptive histogram, automatic histogram, selective dynamic histogram equalization, threshold optimized histogram equalization, clipping histogram equalization, median mean based Sub image clipped histogram equalization [5-11]. Masking based contrast enhancement, un-sharpe masking technique and wavelet based un-sharpe masking technique have documented in recent study [12]. The proposed method uses DWT, singular value decomposition, intensity exposure histogram equalization and masking techniques effectively to produce maximum contrast enhancement. The organization of the paper as follows, section II presents the proposed method. Experimental results are discussed in section III and section IV concludes the paper. II. PROPOSED METHOD A. Image Decomposition The DWT uses dilation and translation property to decompose the image into four sub band called LL, LH, HL, HH as shown in Fig. 1. The LL sub band contains low frequency coefficients containing illumination information and the other sub band contain high frequency coefficients [13].
978-1-5090-5013-0/17/$31.00 ©2017 IEEE
581
Proceedings of the 2nd International Conference on Communication and Electronics Systems (ICCES 2017) IEEE Xplore Compliant - Part Number:CFP17AWO-ART, ISBN:978-1-5090-5013-0 C. Masking Technique The masking formulation is achieved by subtracting inverse singular value decomposition and reconstructed approximation coefficient matrix. The ISVD is obtained by applying SVD to both to both original image and reconstructed image, its SVD decompositions are given by the equation (12) and (13) (12) (13) Fig.1 Block diagram of DWT of level 1. The equation (1) is the decomposition of the image as approximation coefficients and equation (2) is the reconstruction of the approximation coefficients obtained from Inverse Discrete Wavelet Transformation (IDWT). (
(
)
)
∑
√
∑ ∑
√
∑
(
(
)
)
(
(
Here U1, V1, U2 and V2 are the orthogonal matrices. S1 and S2 are diagonal matrices. The value ᶓ is calculated from the diagonal matrices of original image and reconstructed approximation coefficients matrix as given in equation (14). (
)
( (
)
)
(14)
) (1)
),
(2)
( ) is the approximation coefficient, ( ) is where, the input time domain image with discrete variable x,y with the ( ) is the scale function and ( ) is the size M x N. reconstructed approximation coefficient. B. Intensity Exposure based Histogram Equalization The Intensity Exposure [14] of the image is defined in equation (3) and it is normalized in the range of [0 1]. ( )
∑
(3)
( )
Where ( ) is image histogram and levels The parameter
is total number of grey
can be defined as (
)
(4)
To prevent over enhancement clipping histogram calculated as in the equation (5) and (6). ∑ ( )
( )
(5)
for ( )
(6)
is
( ) , is the clipped histogram and it is computationally efficient [15].
The Probability Density Function (PDF) and Cumulative Distribution Function (CDF) can be defined as ( ) ( ) ∑
( )
( )
(9) (10)
The transfer function ( ) for intensity exposure based histogram equalization is then defined as ( ) ( ) (11)
Fig 2. Block diagram of the proposed method
978-1-5090-5013-0/17/$31.00 ©2017 IEEE
582
Proceedings of the 2nd International Conference on Communication and Electronics Systems (ICCES 2017) IEEE Xplore Compliant - Part Number:CFP17AWO-ART, ISBN:978-1-5090-5013-0 The any changes in the S1 singular matrix will affect the image intensity. The most promising approach to image contrast enhancement is altering the image intensity information store in S matrix [16]. The new image is obtained by Inverse singular value decomposition is given in equation (15). (15) The ISVD is intensity manipulated image obtained by manipulating using value. After the image decomposition, all illumination information available in LL subband, so we reconstruct only approximation coefficients. The mask formulation used to obtain contrast residual between ISVD and reconstructed approximation coefficients and added with intensity exposure histogram equalization image as shown in fig. 2, to get output image with improved contrast.
Fig.3. Result of Brain MRI image: (a) Original image, (b) HE,(c) BBHE, (d) DSIHE (e) Proposed method
III. EXPERIMENTAL RESULTS AND DISCUSSION In this section, the performance of the proposed method has analyzed and compared with existing histogram equalization methods like HE, BBHE and DSIHE, by using different type of medical MRI images. To evaluate the quantitative performance of proposed method is tested and compared on the basis of peak signal to noise ratio and absolute mean brightness error values and entropy calculation. To check the produced noise artifacts and over enhancement, PSNR values are calculated using equation (16), PSNR represents a measure of the peak error between original and enhanced image (
)
(16) )
((
)
Fig.4. Result of Spine MRI image: (a) Original image, (b) HE,(c) BBHE, (d) DSIHE (e) Proposed method
(17)
The max value is the maximum intensity value of the grey scale image. The mean square error is the sum of the squared error between original and enhanced image. The performance of the brightness preservation is measured on the basis of AMBE, which define absolute gray level mean between original and enhanced image |
̂|
(18)
Where and ̂ are green level mean of the original and enhanced image respectively. Entropy means average information content and the measure of richness of image details. Equation (19) defines entropy. ( )
∑
( )
( )
(19)
Fig.5. Result of Chest image: (a) Original image, (b) HE,(c) BBHE, (d) DSIHE (e) Proposed method Where ( ), is probability density function at the intensity level and is total number of grey levels of the image.
978-1-5090-5013-0/17/$31.00 ©2017 IEEE
583
Proceedings of the 2nd International Conference on Communication and Electronics Systems (ICCES 2017) IEEE Xplore Compliant - Part Number:CFP17AWO-ART, ISBN:978-1-5090-5013-0
TABLE I.
PSNR VALUES OF TESTED IMAGES
IMAGES
Fig.6. Result of Coronal Tumor image: (a) Original image, (b) HE,(c) BBHE, (d) DSIHE (e) Proposed method
HE
BBHE
DSIHE
PROPOSED
Brain-1
8.727
15.937
17.757
18.484
Skull
2.839
15.834
18.332
30.593
Spine
7.159
14.862
14.970
15.405
chest
16.918
17.062
17.427
18.127
Brain-2
6.886
16.304
11.283
27.852
Brain-3
8.444
16.637
15.616
21.409
T2 MRI axial
9.191
16.047
17.198
22.451
10.251
13.066
26.050
17.201
Normal-Axial
9.250
17.283
19.196
21.390
Average
8.852
15.892
17.537
21.435
Coronal
TABLE II.
AMBE VALUES OF TESTED IMAGES
IMAGES
HE
BBHE
DSIHE
PROPOSED
Brain-1
88.697
29.990
31.081
21.172
Skull
57.022
36.048
22.294
5.770
Spine
102.870
27.700
42.314
30.503
chest
11.601
9.941
4.390
29.735
Brain-2
112.670
33.339
63.747
4.803
Brain-3
91.948
30.779
38.635
13.983
T2 MRI axial
80.087
31.246
31.349
13.304
Coronal
68.121
37.644
8.789
27.309
The performance of the proposed method was observed using Brain images, skull, spine, chest, Brain_Meningioma_Radiology, Brain_mri_transversal, T2 MRI axial image, Normal-Axial-Level2, coronal tumor. Fig. 3, 4, 5 and 6 shows the visual information and contrast enhancement of various techniques like HE, BBHE, DSIHE and proposed method. The concrete result in terms of contrast Enhancement can clearly observe in all images.
Normal-Axial
73.355
16.122
20.986
10.574
Average
76.263
28.090
29.287
17.461
Brain-1
6.293
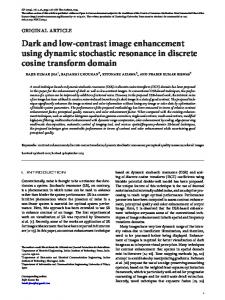
The visual quality in fig 2 and 3 show the reduced contrast and not equalized enhancement result of HE, BBHE and DSIHE. The coronal tumor image enhancement is clearly visible in the proposed method image but other methods enhance the image more in the left side of septum pellucidum. The step by step of the algorithm implementation like original image, IEHE image, ISVD image, mask image and contrast enhanced output image can see in Fig. 7 of skull image.
Skull
Fig.7. Result of skull image: (a) Original image, (b) IEHE,(c) RA, (d) ISVD (e) Mask image (f) output image
The table I contains the result of PSNR shows that proposed method have improvement over the previous methods in terms of noise artifact. The performance of brightness preservation studied and tabulated in table II in terms of AMBE value. The DSIHE method gives better AMBE value for chest and coronal tumor image but its visual information
TABLE III.
ENTROPY VALUES OF TESTED IMAGES BBHE
DSIHE
PROPOS ED
5.052
5.899
5.919
6.181
6.397
5.016
6.138
6.116
6.362
Spine
5.950
5.118
5.590
5.654
5.843
chest
7.280
5.980
7.157
7.173
7.274
Brain-2
4.486
3.420
4.206
4.070
4.487
Brain-3 T2 MRI axial
5.736
4.488
5.367
5.298
5.621
6.139
4.919
5.788
5.732
6.008
Coronal NormalAxial
6.703
5.726
6.441
6.451
6.671
6.264
5.294
6.021
6.001
6.267
Average
6.139
5.001
5.845
5.824
6.079
IMAGES
INPUT ENTROPY
978-1-5090-5013-0/17/$31.00 ©2017 IEEE
HE
584
Proceedings of the 2nd International Conference on Communication and Electronics Systems (ICCES 2017) IEEE Xplore Compliant - Part Number:CFP17AWO-ART, ISBN:978-1-5090-5013-0 and entropy values not as good as proposed method. In most of the cases, entropy value is closer to original image guarantees of having maximum information content as compared to other methods given in table III. The proposed method enhances medical image by preserving brightness and average information content by minimizing noise. IV. CONCLUSION The proposed method plays important role in medical image contrast enhancement, which consist of two steps. In the first step it enhances the contrast based intensity exposure histogram equalization and second step uses masking formulation based SVD method. The mask images take away actual intensity information between ISVD and reconstructed approximation coefficient. Both steps help to preserve mean brightness and average information of the input image. The mask image added to IEHE image, produces maximum contrast enhancement. The supremacy of the proposed method over other methods proved in terms of visual analysis and experimental results. The improved PSNR values shows enhanced image free from noise factors which cause unnatural look, AMBE indicates mean brightness preservation and entropy value gives the preservation of average information REFERENCES [1]
A. Kumar and F. Shaik, “Image Processing in Diabetic Related Causes, Forensic and Medical Bioinformatics”, V56p,62 illus,Spinger:978-981287-623-02,2016.
[2]
Rafeal C Gonzalez, Richard E. Wood, “Digital Image Processing” second edition.Pearson Education, sigapore.
[3]
Shin-Chia Huang, Chien-Hui Yen, “Image contrast enhancement for preserving mean brightness without losing image features”, engineering Applications of Artificial Intelligence 26 (2013) 1487- 1492.
[4]
K.Ribna, S.Gowri, “LL band Contrast Enhacement using Adaptive Gamma Correction”, vol 10 (25), DOI:10.17485/ijst/2017/108357, jully2017.
[5]
Kuldeep sigh,Dinesh K vishwarakarma,Gurjith sigh waia and Rajiv Kapoor,”Contrast enhancement via Texture region based Histogram Equalization”,journal of modern optics, 2016.
[6]
M.F. Khan,Z.A. Abbasi, segment selective dynamic histogram equalization for brightness preserving contrast enhancement of images, Optik 125 (2014) 1385-1389.
[7]
P. Shanmugavadivu, K. Balasubramanian, “Thresholded and optimized histogram Equalization for contrast enhancement of images, compt. Electr.Eng.40 (2014) 757-768.
[8]
Chin tellow wong, guannan jiang, Md Arifur Rahman, Shilong Liu, Stephen ching Feng lin, Nhaiming kwok, haiyan shi, Ying hao yu, thonghai Wu,”Histogram equalization and optimal profile compression based approach for colour image enhancement”, J.vis. commun.image R.38 (2016) 802-813.
[9]
C.Zuo, Q.chen,X.sui,Range limited bi-histogram equalization for image contrast enhancement. Optik 124 (2013) 425-431.
[10] Jing Rui tang, Nor Ashidi MAT ISA,” Intensity Journal of Engineering and computer Science”,Turk J Elec Eng and Com sci (2016) 24:35643585. [11] Sigh.K, Kapoor.R, Sinha.S,” The Median Mean based Sub Image Clipped Histogram Equalization “,optic 2014,125,4646-4651. [12] E Daniel,J Anitha, “Optimum wavelet based masking for contrast enhancement of medical images using enhanced cuckoo search algorithm” Elsevier, computers in biology and medicine 71 (2016) 419155. [13] A.K Bhandari, V. Soni, A Kumar, G.K. Singh, “Cuckoo Search Algorithm based satellite image contrast and brightness enhancement using DWT-SVD”, ISA Transactions 53(2014) 1286-1296. [14] Hanmandlu. M, Verma. O.P, Kumar.N.K,Kulkarni.M,”A novel Optimal fuzzy system for color image enhnacement using bectirial foraging. IEEE Trans, Inst, Meas. 58(8),2867-2879. [15] Kuldeep sigh, Rajiv Kapoor, “Image enhancement using Exposure based Sub Image Histogram Equalization”, pattern recognition letters 26 (2014) 10-14. [16] MZ Iqbal, A Ghafoor, AM Siddiqui, MM Riaz, U Khalid, Dual-tree complex wavelet transform and SVD based medical image resolution enhancement, Signal Processing ,Volume 105, December 2014, Pages 430–437.
978-1-5090-5013-0/17/$31.00 ©2017 IEEE
585