A. BUADES, B. COLL, AND J. M. MOREL. Fig. 1. A digital image with standard deviation 55, the same with noise added (standard devi- ation 3), the SNR ...
IMAGE DENOISING METHODS. A NEW NON-LOCAL PRINCIPLE A. BUADES , B. COLL , AND J.M MOREL Abstract. The search for efficient image denoising methods is still a valid challenge at the crossing of functional analysis and statistics. In spite of the sophistication of the recently proposed methods, most algorithms have not yet attained a desirable level of applicability. All show an outstanding performance when the image model corresponds to the algorithm assumptions but fail in general and create artifacts or remove image fine structures. The main focus of this paper is, first, to define a general mathematical and experimental methodology to compare and classify classical image denoising algorithms and, second, to propose a nonlocal means (NL-means) algorithm addressing the preservation of structure in a digital image. The mathematical analysis is based on the analysis of the “method noise,” defined as the difference between a digital image and its denoised version. The NL-means algorithm is proven to be asymptotically optimal under a generic statistical image model. The denoising performance of all considered methods are compared in four ways; mathematical: asymptotic order of magnitude of the method noise under regularity assumptions; perceptual-mathematical: the algorithms artifacts and their explanation as a violation of the image model; quantitative experimental: by tables of L2 distances of the denoised version to the original image. The most powerful evaluation method seems, however, to be the visualization of the method noise on natural images. The more this method noise looks like a real white noise, the better the method. Note to the reader: The present paper is an updated version of “A review of image denoising algorithms, with a new one” [21]. The text and structure of the original paper have been preserved. However, several spurious comparisons, technical proofs, and appendices have been adapted or removed. At the request of the editor-in-chief, the controversial benchmark image Lena has been replaced. The new section 6 reviews the abundant literature on “nonlocal image processing” stemming from the original paper. The denoising algorithm NL-means can be tested on line: http://mw.cmla.ens-cachan.fr/megawave/demo/ . Key words. image restoration, nonparametric estimation, PDE smoothing filters, adaptive filters, frequency domain filters
1. Introduction. 1.1. Digital images and noise. The need for efficient image restoration methods has grown with the massive production of digital images and movies of all kinds, often taken in poor conditions. No matter how good cameras are, an image improvement is always desirable to extend their range of action. A digital image is generally encoded as a matrix of grey-level or color values. In the case of a movie, this matrix has three dimensions, the third one corresponding to time. Each pair (i, u(i)), where u(i) is the value at i, is called a pixel, short for “picture element.” In the case of grey-level images, i is a point on a two-dimensional (2D) grid and u(i) is a real value. In the case of classical color images, u(i) is a triplet of values for the red, green, and blue components. All of what we shall say applies identically to movies, three-dimensional (3D) images, and color or multispectral images. The two main limitations in image accuracy are categorized as blur and noise. Blur is intrinsic to image acquisition systems, as digital images have a finite number of samples and must satisfy the Shannon–Nyquist sampling conditions [80]. The second main image perturbation is noise. Each one of the pixel values u(i) is the result of a light intensity measurement, usually made by a charge coupled device (CCD) matrix coupled with a light focusing system. Each captor of the CCD is roughly a square in which the number of incoming photons is being counted for a fixed period corresponding to the obturation time. When the light source is constant, the number of photons received by each pixel fluctuates around its average in accordance with the central limit theorem. In other 1
2
A. BUADES, B. COLL, AND J. M. MOREL
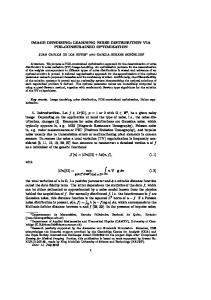
Fig. 1. A digital image with standard deviation 55, the same with noise added (standard deviation 3), the SNR therefore being equal to 18, and the same with SNR slightly larger than 2. In the second image, no alteration is visible. In the third, a conspicuous noise with standard deviation 25 has been added, but, surprisingly enough, all details of the original image still are visible.
√ terms, one can expect fluctuations of order n for n incoming photons. In addition, each captor, if not adequately cooled, receives heat photons. This perturbation is usually called “obscurity noise.” In a first rough approximation one can write v(i) = u(i) + n(i), where i ∈ I, v(i) is the observed value, u(i) would be the “true” value at pixel i, namely the one which would be observed by averaging the photon counting on a long period of time, and n(i) is the noise perturbation. As indicated, the amount of noise is signal-dependent; that is, n(i) is larger when u(i) is larger. In noise models, the normalized values of n(i) and n(j) at different pixels are assumed to be independent random variables, and one talks about “white noise.” 1.2. Signal and noise ratios. A good quality photograph (for visual inspection) has about 256 grey-level values, where 0 represents black and 255 represents white. Measuring the amount of noise by its standard deviation, σ(n), one can deσ(u) fine the signal noise ratio (SNR) as SN R = σ(n) , where σ(u) denotes the empirical ³ P ´1 P 1 1 2 2 standard deviation of u, σ(u) = |I| , and u = |I| i∈I (u(i) − u) i∈I u(i) is the average grey-level value. The standard deviation of the noise can also be obtained as an empirical measurement or formally computed when the noise model and parameters are known. A good quality image has a standard deviation of about 60. The best way to test the effect of noise on a standard digital image is to add a Gaussian white noise, in which case n(i) are independently and identically distributed (i.i.d.) Gaussian real variables. When σ(n) = 3, no visible alteration is usually observed. Thus, a 60 3 ' 20 SNR is nearly invisible. Surprisingly enough, one can add white noise up to a 21 ratio and still see everything in a picture! This fact is illustrated in Figure 1 and constitutes a major enigma of human vision. It justifies the many attempts to define convincing denoising algorithms. As we shall see, the results have been rather disappointing. Denoising algorithms see no difference between small details and noise, and therefore they remove them. In many cases, they create new distortions, and the researchers are so used to them that they have created a taxonomy of denoising artifacts: “ringing,” “blur,” “staircase effect,” “checkerboard effect,” “wavelet outliers,” etc. This fact is not quite a surprise. Indeed, to the best of our knowledge, all denoising algorithms are based on
Image denoising methods
3
• a noise model; • a generic image smoothness model, local or global. In experimental settings, the noise model is perfectly precise. So the weak point of the algorithms is the inadequacy of the image model. All of the methods assume that the noise is oscillatory and that the image is smooth or piecewise smooth. So they try to separate the smooth or patchy part (the image) from the oscillatory one. Actually, many fine structures in images are as oscillatory as noise is; conversely, white noise has low frequencies and therefore smooth components. Thus a separation method based on smoothness arguments only is hazardous. 1.3. The “method noise.” All denoising methods depend on a filtering parameter h. For most methods, the parameter h depends on an estimation of the noise variance σ 2 . One can define the result of a denoising method Dh as a decomposition of any image v as v = Dh v + n(Dh , v), where: 1. Dh v is more smooth than v, 2. n(Dh , v) is the noise guessed by the method. It is not enough to smooth v to ensure that n(Dh , v) will look like a noise. The more recent methods are actually not content with a smoothing but try to recover lost information in n(Dh , v) [58, 70]. So the focus is on n(Dh , v). Definition 1.1 (method noise). Let u be a (not necessarily noisy) image and Dh a denoising operator depending on h. Then we define the method noise of u as the image difference (1.1)
n(Dh , u) = u − Dh (u).
This method noise should be as similar to a white noise as possible. In addition, since we would like the original image u not to be altered by denoising methods, the method noise should be as small as possible for the functions with the right regularity. According to the preceding discussion, four criteria can and will be taken into account in the comparison of denoising methods: • A display of typical artifacts in denoised images. • A formal computation of the method noise on smooth images, evaluating how small it is in accordance with image local smoothness. • A comparative display of the method noise of each method on real images with σ = 2.5. We mentioned that a noise standard deviation smaller than 3 is subliminal, and it is expected that most digitization methods allow themselves this amount of noise. • A classical comparison receipt based on noise simulation: it consists of taking a good quality image, adding Gaussian white noise with known σ, and then computing the best image recovered from the noisy one by each method. A table of L2 distances from the restored to the original can be established. The L2 distance does not provide a good quality assessment. However, it reflects well the relative performances of algorithms. • A comparison following the “noise to noise” criterion, which requires the residual noise to be as white as possible, and therefore artifact free. On top of this, in two cases, a proof of asymptotic recovery of the image can be obtained by statistical arguments. 1.4. Which methods to compare. We had to make a selection of the denoising methods we wished to compare. Here a difficulty arises, as most original methods have caused an abundant literature proposing many improvements. So we tried to get the
4
A. BUADES, B. COLL, AND J. M. MOREL
best available version, while keeping the simple and genuine character of the original method: no hybrid method. So we shall analyze the following: 1. Gaussian smoothing (Gabor quoted in Lindenbaum, Fischer, and Bruckstein [53]); 2. anisotropic filtering (Perona and Malik [71], Alvarez, Lions, and Morel [3]); 3. the Rudin–Osher–Fatemi total variation [78]. 4. the Yaroslavsky neighborhood filters [94, 96]. 5. the Wiener local empirical filter as implemented by Yaroslavsky [96]; 6. the translation invariant wavelet thresholding [25], a simple and performing variant of the wavelet thresholding [33]; 7. the nonlocal means (NL-means) algorithm, which we introduce here. This last algorithm is given by a simple closed formula. Let u be defined in a bounded domain Ω ⊂ R2 ; then Z (Ga ∗|u(x+.)−u(y+.)|2 )(0) 1 h2 N L(u)(x) = e− u(y) dy, C(x) where x ∈ Ω, Ga is a Gaussian kernel of standard deviation a, h acts as a filtering R (Ga ∗|u(x+.)−u(z+.)|2 )(0) h2 parameter, and C(x) = e− dz is the normalizing factor. In order to make clear the previous definition, we recall that Z (Ga ∗ |u(x + .) − u(y + .)|2 )(0) = Ga (t)|u(x + t) − u(y + t)|2 dt. R2
This amounts to saying that N L(u)(x), the denoised value at x, is a mean of the values of all pixels whose Gaussian neighborhood looks like the neighborhood of x. 1.5. Plan of the paper. Section 2 computes formally the method noise for the best elementary local smoothing methods, namely Gaussian smoothing, anisotropic smoothing (mean curvature motion), total variation minimization, and the neighborhood filters. For all of them we prove or recall the asymptotic expansion of the filter at smooth points of the image and therefore obtain a formal expression of the method noise. This expression permits us to characterize places where the filter performs well and where it fails. In section 3, we treat the Wiener-like methods, which proceed by a soft or hard threshold on frequency or space-frequency coefficients. We examine in turn the Wiener–Fourier filter, the Yaroslavsky local adaptive discrete cosine transform (DCT)-based filters, and the wavelet threshold method. Of course, the Gaussian smoothing belongs to both classes of filters. In section 4, we introduce the NL-means filter. This method is not easily classified in the preceding terminology, since it can work adaptively in a local or nonlocal way. We first give a proof that this algorithm is asymptotically consistent (it gives back the conditional expectation of each pixel value given an observed neighborhood) under the assumption that the image is a fairly general stationary random process. The works of Efros and Leung [38] and Levina [51] have shown that this assumption is sound for images having enough samples in each texture patch. In section 5, we compare all algorithms from several points of view, do a performance classification, and explain why the NL-means algorithm shares the consistency properties of most of the aforementioned algorithms. Section 6 is new. It reviews the numerous improvements and generalizations of NL-means discovered since 2005. 2. Local smoothing filters. The original image u is defined in a bounded domain Ω ⊂ R2 and denoted by u(x) for x = (x, y) ∈ R2 . This continuous image is
5
Image denoising methods
usually interpreted as the Shannon interpolation of a discrete grid of samples [80] and is therefore analytic. The distance between two consecutive samples is denoted by ε. The noise itself is a discrete phenomenon on the sampling grid. According to the usual screen and printing visualization practice, we do not interpolate the noise samples ni as a band limited function but rather as a piecewise constant function, constant on 1 each pixel i and equal to ni . We write |x| = (x2 + y 2 ) 2 and x1 .x2 = x1 x2 + y1 y2 as ∂u the norm and scalar product and denote the derivatives of u by ux = ∂u ∂x , uy = ∂y , 2
∂ u and uxy = ∂x∂y . The gradient of u is written as Du = (ux , uy ) and the Laplacian of u as ∆u = uxx + uyy .
2.1. Gaussian smoothing. By Riesz’s theorem, image isotropic linear filtering boils down to a convolution of the image by a linear radial kernel. The smoothing requirement is usually expressed by the positivity of the kernel. The paradigm of such |x|2
− 4h2 1 kernels is, of course, the Gaussian x → Gh (x) = (4πh . In that case, Gh has 2) e standard deviation h, and the following theorem is easily seen. Theorem 2.1 (Gabor 1960). The image method noise of the convolution with a Gaussian kernel Gh is
u − Gh ∗ u = −h2 ∆u + o(h2 ). A similar result is actually valid for any positive radial kernel with bounded variance, so one can keep the Gaussian example without loss of generality. The preceding estimate is valid if h is small enough. On the other hand, the noise reduction properties depend upon the fact that the neighborhood involved in the smoothing is large enough, so that the noise gets reduced by averaging. So in the following we assume that h = kε, where k stands for the number of samples of the function u and noise n in an interval of length h. The spatial ratio k must be much larger than 1 to ensure a noise reduction. The effect of a Gaussian smoothing on the noise can be evaluated at a reference pixel i = 0. At this pixel, XZ X Gh ∗ n(0) = Gh (x)n(x)dx = ε2 Gh (i)ni , i∈I
Pi
i∈I
where we recall that n(x) is being interpolated as a piecewise constant function, the Pi square pixels centered in i have size ε2 , and Gh (i) denotes the mean value of the function Gh on the pixel i. Denoting by V ar(X) the variance of a random variable X, the additivity of variances of independent centered random variables yields Z X ε2 σ 2 4 2 2 2 2 V ar(Gh ∗ n(0)) = ε Gh (i) σ ' σ ε Gh (x)2 dx = . 8πh2 i So we have proved the following theorem. Theorem 2.2. Let n(x) be a piecewise constant white noise, with n(x) = ni on each square pixel i. Assume that the ni are i.i.d. with zero mean and variance σ 2 . Then the “noise residue” after a Gaussian convolution of n by Gh satisfies V ar(Gh ∗ n(0)) '
ε2 σ 2 . 8πh2
In other terms, the standard deviation of the noise, which can be interpreted as the noise amplitude, is multiplied by h√ε8π .
6
A. BUADES, B. COLL, AND J. M. MOREL
Theorems 2.1 and 2.2 traduce the delicate equilibrium between noise reduction and image destruction by any linear smoothing. Denoising does not alter the image at points where it is smooth at a scale h much larger than the sampling scale ε. The first theorem tells us that the method noise of the Gaussian denoising method is zero in harmonic parts of the image. A Gaussian convolution is optimal on harmonic functions and performs instead poorly on singular parts of u, namely edges or texture, where the Laplacian of the image is large. See Figure 3. 2.2. Anisotropic filters and curvature motion. The anisotropic filter (AF) attempts to avoid the blurring effect of the Gaussian by convolving the image u at x only in the direction orthogonal to Du(x). The idea of such a filter goes back to Perona and Malik [71] and actually again to Gabor (quoted in Lindenbaum, Fischer, and Bruckstein [53]). Set µ ¶ Z Du(x)⊥ AFh u(x) = Gh (t)u x + t dt |Du(x)| t2
1 for x such that Du(x) 6= 0 and where (x, y)⊥ = (−y, x) and Gh (t) = √2πh e− 2h2 is the one-dimensional (1D) Gauss function with variance h2 . At points where Du(x) = 0 an isotropic Gaussian mean is usually applied, and the result of Theorem 2.1 holds at those points. If one assumes that the original image u is twice continuously differentiable (C 2 ) at x, the following theorem is easily shown by a second-order Taylor expansion. Theorem 2.3. The image method noise of an anisotropic filter AFh is µ ¶ 1 Du⊥ Du⊥ 1 u(x) − AFh u(x) ' − h2 D2 u , = − h2 |Du|curv(u)(x), 2 |Du| |Du| 2
where the relation holds when Du(x) 6= 0. By curv(u)(x), we denote the curvature, i.e., the signed inverse of the radius of curvature of the level line passing by x. When Du(x) 6= 0, this means that curv(u) =
uxx u2y − 2uxy ux uy + uyy u2x 3
(u2x + u2y ) 2
.
This method noise is zero wherever u behaves locally like a one-variable function, u(x, y) = f (ax + by + c). In such a case, the level line of u is locally the straight line with equation ax + by + c = 0, and the gradient of f may instead be very large. In other terms, with anisotropic filtering, an edge can be maintained. On the other hand, we have to evaluate the Gaussian noise reduction. This is easily done by a 1D adaptation of Theorem 2.2. Notice that the noise on a grid is not isotropic; so the √ Gaussian average when Du is parallel to one coordinate axis is made roughly on 2 more samples than the Gaussian average in the diagonal direction. Theorem 2.4. By anisotropic Gaussian smoothing, when ε is small enough with respect to h, the noise residue satisfies Var (AFh (n)) ≤ √
ε σ2 . 2πh
In other terms, the standard deviation of the noise n is multiplied by a factor at most ε equal to ( √2πh )1/2 , this maximal value being attained in the diagonals.
7
Image denoising methods ⊥
(x) Proof. Let L be the line x + t Du |Du(x)| passing by x, parameterized by t ∈ R, and denote by Pi , i ∈ I, the pixels which meet L, n(i) the noise value, constant on pixel Pi , and εi the length of the intersection of L ∩ Pi . Denote by g(i) the average ⊥ P (x) of Gh (x + t Du i εi n(i)g(i). The n(i) are |Du(x)| ) on L ∩ Pi . Then one has AFh n(x) ' i.i.d. with standard variation σ, and therefore X X V ar(AFh (n)) = ε2i σ 2 g(i)2 ≤ σ 2 max(εi ) εi g(i)2 , yielding i
Var (AFh (n)) ≤
i
√
Z 2εσ 2
Gh (t)2 dt = √
ε σ2 . 2πh
There are many versions of AFh , all yielding an asymptotic estimate equivalent to the one in Theorem 2.3: the famous median filter [45], an inf-sup filter on segments centered at x [22], and the clever numerical implementation of the mean curvature equation in [63]. So all of those filters have in common the good preservation of edges, but they perform poorly on flat regions and are worse there than a Gaussian blur. This fact derives from the comparison of the noise reduction estimates of Theorems 2.1 and 2.4 and is experimentally patent in Figure 3. 2.3. Total variation. The total variation minimization was introduced by Rudin and Osher [77] The original image u is supposed to have a simple geometric description, namely a set of connected sets, the objects, along with their smooth contours, or edges. The image is smooth inside the objects but with jumps across the boundaries. The functional space modeling these propertiesRis BV (Ω), the space of integrable functions with finite total variation T VΩ (u) = |Du|, where Du is assumed to be a Radon measure. Given a noisy image v(x), the above-mentioned authors proposed to recover the original image u(x) as the solution of the constrained minimization problem (2.1)
arg min T VΩ (u), u
subject to the noise constraints Z (u(x) − v(x))dx = 0
Z |u(x) − v(x)|2 dx = σ 2 .
and
Ω
Ω
The solution u must be as regular as possible in the sense of the total variation, while the difference v(x) − u(x) is treated as an error, with a prescribed energy. The constraints prescribe the right mean and variance to u − v but do not ensure that it is similar to a noise (see a thorough discussion in [64]). The preceding problem is naturally linked to the unconstrained problem Z (2.2) arg min T VΩ (u) + λ |v(x) − u(x)|2 dx u
Ω
for a given Lagrange multiplier λ. The above functional is strictly convex and lower semicontinuous with respect to the weak-star topology of BV . Therefore the minimum exists, is unique, and is computable (see, e.g., [23]). The parameter λ controls the tradeoff between the regularity and fidelity terms. As λ gets smaller the weight of the regularity term increases. Therefore λ is related to the degree of filtering of the
8
A. BUADES, B. COLL, AND J. M. MOREL
solution of the minimization problem. Let us denote by TVFλ (v) the solution of problem (2.2) for a given value of λ. The Euler–Lagrange equation associated with the minimization problem is given by (u(x) − v(x)) −
1 curv(u)(x) = 0 2λ
(see [77]). Thus, we have the following theorem. Theorem 2.5. The method noise of the total variation minimization (2.2) is u(x) − TVFλ (u)(x) = −
1 curv(TVFλ (u))(x). 2λ
As in the anisotropic case, straight edges are maintained because of their small curvature. However, details and texture can be oversmoothed if λ is too small, as is shown in Figure 3. 2.4. Neighborhood filters. The previous filters are based on a notion of spatial neighborhood or proximity. Neighborhood filters instead take into account grey-level values to define neighboring pixels. In the simplest and more extreme case, the denoised value at pixel i is an average of values at pixels which have a grey-level value close to u(i). The grey-level neighborhood is therefore B(i, h) = {j ∈ I | u(i) − h < u(j) < u(i) + h}. This is a fully nonlocal algorithm, since pixels belonging to the whole image are used for the estimation at pixel i. This algorithm can be written in a more continuous form, Z |u(y)−u(x)|2 1 h2 NFh u(x) = dy, u(y)e− C(x) Ω R |u(y)−u(x)|2 h2 where Ω ⊂ R2 is an open and bounded set, and C(x) = Ω e− dy is the normalization factor. The Yaroslavsky neighborhood filters [96, 94] consider mixed neighborhoods B(i, h)∩ Bρ (i), where Bρ (i) is a ball of center i and radius ρ. So the method takes an average of the values of pixels which are both close in grey-level and spatial distance. This filter can be easily written in a continuous form as Z |u(y)−u(x)|2 1 h2 YNFh,ρ (x) = u(y)e− dy, C(x) Bρ (x) R |u(y)−u(x)|2 h2 where C(x) = Bρ (x) e− dy is the normalization factor. More recent versions, namely the SUSAN filter [82] and the Bilateral filter [85] weigh the distance to the reference pixel x instead of considering a fixed spatial neighborhood, In the next theorem we compute the asymptotic expansion of the Yaroslavky neighborhood filter when ρ, h → 0. Theorem 2.6. Suppose u ∈ C 2 (Ω), and let ρ, h, α > 0 such that ρ, h → 0 and −t2
h = O(ρα ). Let us consider the continuous function g˜ defined by g˜(t) = 31 teE(t) , for Rt 2 t 6= 0, g˜(0) = 61 , where E(t) = 2 0 e−s ds. Let f˜ be the continuous function defined − 2t12 , f˜(0) = 16 . Then, for x ∈ Ω, by f˜(t) = 3˜ g (t) + 3˜gt(t) 2
9
Image denoising methods 2 1. If α < 1, YNFh,ρ u(x) − u(x) ' 4u(x) 6 ρ . 2. If α = 1, h ρ i ρ (2.3) YNFh,ρ u(x) − u(x) ' g˜( |Du(x)|) uξξ (x) + f˜( |Du(x)|) uηη (x) ρ2 h h
3. If 1 < α < 32 , ¡ ¢ YNFh,ρ u(x) − u(x) ' g˜ ρ1−α |Du(x)| [ uξξ (x) + 3uηη (x)] ρ2 . 0.2
0.15
0.1
0.05
2
4
6
8
-0.05
-0.1
Fig. 2. Magnitude of the tangent diffusion (continuous line) and normal diffusion (dashed line – –) of Theorem 2.6 in the case that ρ = h.
According to Theorem 2.6 the Yaroslavsky neighborhood filter acts as an evolution PDE with two terms. The first term is proportional to the second derivative of u in the direction ξ, which is tangent to the level line passing through x. The second term is proportional to the second derivative of u in the direction η which is orthogonal to the level line passing through x. The evolution equations ut = c1 uξξ and ut = c2 uηη act as filtering or enhancing models depending on the signs of c1 and c2 . Following the previous theorem, we can distinguish three cases, depending on the values of h and ρ. First, if h is much larger than ρ, both second derivatives are weighted by the same positive constant. In that case, the addition of both terms is equivalent to the Laplacian of u, ∆u, and we get back to gaussian filtering. Second, if h and ρ have the same order of magnitude, the neighborhood filter behaves as a filtering/enhancing algorithm. The weighting coefficient of the tangent diffusion, uξξ , is given by g˜( hρ |Du|). The function g˜ is positive and decreasing. Thus, there is always diffusion in that direction. The weight of the normal diffusion, uηη , is given by f˜( hρ |Du|). As the function f˜ takes positive and negative values (see Figure 2), the filter behaves as a filtering/enhancing algorithm in the normal direction and ˜ denotes the zero of f˜, then a filtering model is applied depending on |Du|. If B h ˜ ˜ h . The intensity wherever |Du| < B ρ and an enhancing strategy wherever |Du| > B ρ of the filtering in the tangent diffusion and the enhancing in the normal diffusion tend to zero when the gradient tends to infinity. Thus, points with a very large gradient are not altered. In this case the neighborhood filter asymptotically behaves as the Perona-Malik equation [71] (see [17] for more details on this comparison). Finally, if ρ is much larger than h, the value hρ tends to infinity and if the gradient of the image is bounded then the filtering magnitude g˜( hρ |Du|) tends to zero. Thus, the original image is hardly altered. 3. Frequency domain filters. Let u be the original image defined on the grid I. The image is supposed to be modified by the addition of a signal independent white noise N . N is a random process where N (i) are i.i.d. with zero mean and have constant
10
A. BUADES, B. COLL, AND J. M. MOREL
Fig. 3. Denoising experience on a natural image. From left to right and from top to bottom: noisy image (standard deviation σ = 20), Gaussian convolution (h = 1.8), anisotropic filter (h = 2.4), total variation (λ = 0.04) and the Yaroslavsky neighborhood filter (ρ = 7, h = 28). Parameters have been set for each algorithm so that the removed energy is equal to the energy of the added noise.
variance σ 2 . The resulting noisy process depends on the random noise component, and therefore it is modeled as a random field V , (3.1)
V (i) = u(i) + N (i).
Given a noise observation n(i), v(i) denotes the observed noisy image, (3.2)
v(i) = u(i) + n(i).
Let B = {gα }α∈A be an orthonormal basis of R|I| . The noisy process is transformed as (3.3)
VB (α) = uB (α) + NB (α),
where VB (α) = hV, gα i, uB (α) = hu, gα i, NB (α) = hN, gα i are the scalar products of V , u, and N with gα ∈ B. The noise coefficients NB (α) remain uncorrelated and with zero mean, but the variances are multiplied by kgα k2 : E[NB (α)NB (β)] =
X
gα (m)gβ (n)E[N (m)N (n)]
m,n∈I
= hgα , gβ iσ 2 = σ 2 kgα k2 δ[α − β]. Frequency domain filters are applied independently to every transform coefficient VB (α), and then the solution is estimated by the inverse transform of the new coefficients. Noisy coefficients VB (α) are modified to a(α)VB (α). This is a nonlinear
Image denoising methods
11
algorithm because a(α) depends on the value VB (α). The inverse transform yields the estimate X ˆ = DV = a(α) VB (α) gα . (3.4) U α∈A
D is also called a diagonal operator. Let us look for the frequency domain filter D which minimizes a certain estimation error. This error is based on the squared Euclidean distance, and it is averaged over the noise distribution. Definition 3.1. Let u be the original image, N be a white noise, and V = u+N . Let D be a frequency domain filter. Define the risk of D as r(D, u) = E{ku − DV k2 },
(3.5)
where the expectation is taken over the noise distribution. The following easy theorem gives the diagonal operator Dinf that minimizes the risk, Dinf = arg min r(D, u). D
Theorem 3.2. The operator Dinf which minimizes the risk is given by the family {a(α)}α , where (3.6)
a(α) =
|uB (α)|2 , |uB (α)|2 + kgα k2 σ 2
and the corresponding risk is (3.7)
rinf (u) =
X s∈S
kgα k4
|uB (α)|2 σ 2 . |uB (α)|2 + kgα k2 σ 2
The previous optimal operator attenuates all noisy coefficients in order to minimize the risk. If one restricts a(α) to be 0 or 1, one gets a projection operator. In that case, a subset of coefficients is kept, and the rest gets canceled. The projection operator that minimizes the risk r(D, u) is obtained by the family {a(α)}α , where ( 1 |uB (α)|2 ≥ kgα k2 σ 2 , a(α) = 0 otherwise and the corresponding risk is rp (u) =
X
kgα k2 min(|uB (α)|2 , kgα k2 σ 2 ).
Note that both filters are ideal operators because they depend on the coefficients uB (α) of the original image, which are not known. We call, as classical, Fourier– Wiener filter the optimal operator (3.6) where B is a Fourier basis. This is an ideal filter, since it uses the (unknown) Fourier transform of the original image. By the use of the Fourier basis global image characteristics may prevail over local ones and create spurious periodic patterns. To avoid this effect, the basis must take into account more local features, as the wavelet and local DCT transforms do. The search for the ideal basis associated with each image is still open. At the moment, the way seems to be a dictionary of basis instead of one single basis [58].
12
A. BUADES, B. COLL, AND J. M. MOREL
3.1. Local adaptive filters in transform domain. The local adaptive filters have been introduced by Yaroslavsky and Eden [94] and Yaroslavsky [93]. In this case, the noisy image is analyzed in a moving window, and in each position of the window its spectrum is computed and modified. Finally, an inverse transform is used to estimate only the signal value in the central pixel of the window. Let i ∈ I be a pixel and W = W (i) a window centered in i. Then the DCT transform of W is computed and modified. The original image coefficients of W , uB,W (α), are estimated, and the optimal attenuation of Theorem 3.2 is applied. Finally, only the center pixel of the restored window is used. This method is called the empirical Wiener filter. In order to approximate uB,W (α), one can take averages on the additive noise model, that is, E|VB,W (α)|2 = |uB,W (α)|2 + σ 2 kgα k2 . Denoting by µ = σkgα k, the unknown original coefficients can be written as |uB,W (α)|2 = E|VB,W (α)|2 − µ2 . The observed coefficients |vB,W (α)|2 are used to approximate E|VB,W (α)|2 , and the estimated original coefficients are replaced in the optimal attenuation, leading to the family {a(α)}α , where ½ ¾ |vB,W (α)|2 − µ2 a(α) = max 0, . |vB,W (α)|2 Denote by EW Fµ (i) the filter given by the previous family of coefficients. The method noise of the EW Fµ (i) is easily computed, as proved in the following theorem. Theorem 3.3. Let u be an image defined in a grid I, and let i ∈ I be a pixel. Let W = W (i) be a window centered in the pixel i. Then the method noise of the EWFµ (i) is given by u(i) − EWFµ (i) =
X α∈Λ
vB,W (α) gα (i) +
X α∈Λ /
µ2 vB,W (α) gα (i), |vB,W (α)|2
where Λ = {α | |vB,W (α)| < µ}. The presence of an edge in the window W will produce a large number of large coefficients, and, as a consequence, the cancelation of these coefficients will produce oscillations. Then spurious cosines will also appear in the image under the form of chessboard patterns; see Figure 4. 3.2. Wavelet thresholding. Let B = {gα }α∈A be an orthonormal basis of wavelets [59]. Let us discuss two procedures modifying the noisy coefficients, called wavelet thresholding methods (Donoho and Johnstone [33]). The first procedure is a projection operator which approximates the ideal projection (3.6). It is called a hard thresholding and cancels coefficients smaller than a certain threshold µ, ( 1 |vB (α)| > µ, a(α) = 0 otherwise. Let us denote this operator by HWTµ (v). This procedure is based on the idea that the image is represented with large wavelet coefficients, which are kept, whereas the noise
Image denoising methods
13
is distributed across small coefficients, which are canceled. The performance of the method depends on the capacity of approximating u by a small set of large coefficients. Wavelets are, for example, an adapted representation for smooth functions. Theorem 3.4. Let u be an image defined in a grid I. The method noise of a hard thresholding HWTµ (u) is X u − HWTµ (u) = uB (α)gα . {α||uB (α)|∞ D∈DB u∈R|I|
E{ku − DV k2 } 1 = 1. σ 2 + rp (u) 2 log |I|
In practice the optimal threshold µ is very high and cancels too many coefficients not produced by the noise. A threshold lower than the optimal is used in the experiments and produces much better results; see Figure 4. For a hard thresholding the threshold is fixed to 3 ∗ σ. For a soft thresholding this threshold still is too high; it is better fixed at 32 σ.
14
A. BUADES, B. COLL, AND J. M. MOREL
3.3. Translation invariant wavelet thresholding. Coifman and Donoho [25] improved the wavelet thresholding methods by averaging the estimation of all translations of the degraded signal. Calling v p (i) the translated signal v(i − p), the wavelet coefficients of the original and translated signals can be very different, and they are not related by a simple translation or permutation, vBp (α) = hv(n − p), gα (n)i = hv(n), gα (n + p)i. The vectors gα (n + p) are not in general in the basis B = {gα }α∈A , and therefore the estimation of the translated signal is not related to the estimation of v. This new algorithm yields an estimate u ˆp for every translated v p of the original image, X (3.10) u ˆp = Dv p = a(α)vBp (α)gα . α∈A
The translation invariant thresholding is obtained by averaging all these estimators after a translation in the inverse sense, (3.11)
1 X p u ˆ (i + p), |I| p∈I
and will be denoted by TIHWT and TISWT , respectively for the hard and soft thresholding. The Gibbs effect is considerably reduced by the translation invariant wavelet thresholding (see Figure 4), because the average of different estimations of the image reduces the oscillations. This is therefore the version we shall use in the comparison section. 4. NL-means algorithm. The local smoothing methods and the frequency domain filters aim at a noise reduction and at a reconstruction of the main geometrical configurations but not at the preservation of the fine structure, details, and texture. Due to the regularity assumptions on the original image of previous methods, details and fine structures are smoothed out because they behave in all functional aspects as noise. The NL-means algorithm we shall now discuss tries to take advantage of the high degree of redundancy of any natural image. By this, we simply mean that every small window in a natural image has many similar windows in the same image. This fact is patent for windows close by, at one pixel distance, and in that case we go back to a local regularity assumption. Now in a very general sense inspired by the neighborhood filters, one can define as “neighborhood of a pixel i” any set of pixels j in the image such that a window around j looks like a window around i. All pixels in that neighborhood can be used for predicting the value at i, as was first shown in [38] for 2D images. This first work has inspired many variants for the restoration of various digital objects, in particular 3D surfaces [81]. The fact that such a selfsimilarity exists is a regularity assumption, actually more general and more accurate than all regularity assumptions we have considered in section 2. It also generalizes a periodicity assumption of the image. Let v be the noisy image observation defined on a bounded domain Ω ⊂ R2 , and let x ∈ Ω. The NL-means algorithm estimates the value of x as an average of the values of all the pixels whose Gaussian neighborhood looks like the neighborhood of x, Z (Ga ∗|v(x+.)−v(y+.)|2 )(0) 1 h2 e− v(y) dy, N L(v)(x) = C(x) Ω
Image denoising methods
15
Fig. 4. Denoising experiment on a natural image. From left to right and from top to bottom: noisy image (standard deviation σ = 20), the wavelet hard thresholding (HWT, µ = 3σ), translation invariant hard wavelet thresholding (TIHWT, , µ = 3σ) and the DCT empirical Wiener filter (W = 15 × 15 pixels, µ = σ/2). Parameters have been set for each algorithm in such a way the removed energy is similar to the added noise noise energy, σ 2 , getting the best result in terms of euclidean distance to the original image.
where Ga is a Gaussian kernel with standard deviation a, h acts as a filtering paR (Ga ∗|v(x+.)−v(z+.)|2 )(0) h2 dz is the normalizing factor. We recall rameter, and C(x) = Ω e− that Z 2 (Ga ∗ |v(x + .) − v(y + .)| )(0) = Ga (t)|v(x + t) − v(y + t)|2 dt. R2
Since we are considering images defined on a discrete grid I, we shall give a discrete description of the NL-means algorithm and some consistency results. This simple and generic algorithm and its application to the improvement of the performance of digital cameras are the object of an European patent application [14]. 4.1. Description. Given a discrete noisy image v = {v(i) | i ∈ I}, the estimated value N L(v)(i) is computed as a weighted average of all the pixels in the image, X N L(v)(i) = w(i, j)v(j), j∈I
where the weights {w(i, j)}j depend on the similarity between the pixels i and j and P satisfy the usual conditions 0 ≤ w(i, j) ≤ 1 and j w(i, j) = 1. In order to compute the similarity between the image pixels, we define a neighborhood system on I. Definition 4.1 (neighborhoods). A neighborhood system on I is a family N = {Ni }i∈I of subsets of I such that for all i ∈ I, (i) i ∈ Ni ,
16
A. BUADES, B. COLL, AND J. M. MOREL
(ii) j ∈ Ni ⇒ i ∈ Nj . The subset Ni is called the neighborhood or the similarity window of i. We set N˜i = Ni \ {i}. The similarity windows can have different sizes and shapes to better adapt to the image. For simplicity we will use square windows of fixed size. The restriction of v to a neighborhood Ni will be denoted by v(Ni ): v(Ni ) = (v(j), j ∈ Ni ). The similarity between two pixels i and j will depend on the similarity of the intensity grey-level vectors v(Ni ) and v(Nj ). The pixels with a similar grey-level neighborhood to v(Ni ) will have larger weights on the average; see Figure 5.
Fig. 5. q1 and q2 have a large weight because their similarity windows are similar to that of p. On the other side the weight w(p, q3) is much smaller because the intensity grey values in the similarity windows are very different.
In order to compute the similarity of the intensity grey-level vectors v(Ni ) and v(Nj ), one can compute a Gaussian weighted Euclidean distance, kv(Ni ) − v(Nj )k22,a . Efros and Leung [38] showed that the L2 distance is a reliable measure for the comparison of image windows in a texture patch. This measure is quite adapted to an additive white noise, which alters uniformly the distance between windows. Indeed, Ekv(Ni ) − v(Nj )k22,a = ku(Ni ) − u(Nj )k22,a + 2σ 2 , where u and v are, respectively, the original and noisy images and σ 2 is the noise variance. This equality shows that, in expectation, the Euclidean distance preserves the order of similarity between pixels. So the most similar pixels to i in v also are expected to be the most similar pixels to i in u. The weights associated with the quadratic distances are defined by 2
w(i, j) =
j )k2,a 1 − kv(Ni )−v(N h2 e , Z(i)
17
Image denoising methods
P
−
kv(Ni )−v(Nj )k2 2,a h2
where Z(i) is the normalizing factor Z(i) = j e and the parameter h controls the decay of the exponential function, and therefore the decay of the weights, as a function of the Euclidean distances. 4.2. Very related attempts. Two methods have independently attempted to take advantage of an image model learned from the image itself. The work by Weissman et al. [88] has led to the proposition of a “universal denoiser” for digital images. The authors prove that this denoiser is universal in the sense “of asymptotically achieving, without access to any information on the statistics of the clean signal, the same performance as the best denoiser that does have access to this information”. In [69] the authors present an implementation valid for binary images with an impulse noise, with excellent results. Awate and Whitaker [6] have also proposed a method whose principles stand close to the the NL-means algorithm, since, the method involves comparison between subwindows to estimate a restored value. The objective of the algorithm is to denoise the image by decreasing the randomness of the image. 4.3. A consistency theorem for NL-means. The NL-means algorithm is intuitively consistent under stationarity conditions, saying that one can find many samples of every image detail. In fact, we shall be assuming that the image is a fairly general stationary random process. Under these assumptions, for every pixel i, the NL-means algorithm converges to the conditional expectation of i knowing its neighborhood. In the case of an additive or multiplicative white noise model, this expectation is in fact the solution to a minimization problem. Let X and Y denote two random vectors with values on Rp and R, respectively. Let fX , fY denote the probability distribution functions of X, Y , and let fXY denote the joint probability distribution function of X and Y . Let us recall briefly the definition of the conditional expectation. Definition 4.2. (i) Define the probability distribution function of Y conditioned to X as (f
(x,y) fX (x)
XY
f (y | x) =
if fX (x) > 0,
0
otherwise
for all x ∈ Rp and y ∈ R. (ii) Define the conditional expectation of Y given {X = x} as the expectation with respect to the conditional distribution f (y | x), Z E[Y | X = x] = y f (y | x) dy, for all x ∈ Rp . The conditional expectation is a function of X, and therefore a new random variable g(X), which is denoted by E[Y | X]. Now let V be a random field and N a neighborhood system on I. Let Z denote the sequence of random variables Zi = {Yi , Xi }i∈I , where Yi = V (i) is real valued and Xi = V (N˜i ) is Rp valued. Recall that N˜i = Ni \ {i}. Let us restrict Z to the n first elements {Yi , Xi }ni=1 . Let us define the function rn (x), (4.1)
rn (x) = Rn (x)/fˆn (x),
18
A. BUADES, B. COLL, AND J. M. MOREL
where (4.2)
µ ¶ n 1 X Xi − x ˆ fn (x) = K , nhp i=1 h
µ ¶ n 1 X Xi − x Rn (x) = φ(Yi )K , nhp i=1 h
φ is an integrable real valued function, K is a nonnegative kernel, and x ∈ Rp . Let X and Y be distributed as X1 and Y1 . Under this form the NL-means algorithm can be seen as an instance for the exponential operator of the Nadaraya– Watson estimator [66, 87]. This is an estimator of the conditional expectation r(x) = E[φ(Y ) | X = x]. Some definitions are needed for the statement of the main result. Definition 4.3. A stochastic process {Zt | t = 1, 2, . . .}, with Zt defined on some probability space (Ω, A, P), is said to be (strict-sense) stationary if for any finite partition {t1 , t2 , . . . , tn } the joint distributions Ft1 ,t2 ,...,tn (x1 , x2 , . . . , xn ) are the same as the joint distributions Ft1 +τ,t2 +τ,...,tn +τ (x1 , x2 , . . . , xn ) for any τ ∈ N. In the case of images, this stationary condition amounts to saying that as the size of the image grows, we are able to find in the image many similar patches for all the details of the image. This is a crucial point in understanding the performance of the NL-means algorithm. The following mixing definition is a rather technical condition. In the case of images, it amounts to saying that regions become more independent as their distance increases. This is intuitively true for natural images. Definition 4.4. Let Z be a stochastic and stationary process {Zt | t = 1, 2, . . . , n}, and, for m < n, let Fnm be the σ-field induced in Ω by the r.v.’s Zj , m ≤ j ≤ n. Then the sequence Z is said to be β-mixing if for every A ∈ Fk1 and every B ∈ F∞ k+n |P (A ∩ B) − P (A)P (B)| ≤ β(n),
with β(n) → 0, as n → ∞.
The following theorem establishes the convergence of rn to r; see Roussas [76]. The theorem is established under the stationary and mixing hypothesis of {Yi , Xi }∞ i=1 and asymptotic conditions on the decay of φ, β(n), and K. This set of conditions will be denoted by H. Theorem 4.5 (conditional expectation theorem). Let Zj = {Xj , Yj } for j = 1, 2, . . . be a strictly stationary and mixing process. For i ∈ I, let X and Y be distributed as Xi and Yi . Let J be a compact subset J ⊂ Rp such that inf{fX (x); x ∈ J} > 0. Then, under hypothesis H, sup[ψn |rn (x) − r(x)|; x ∈ J] → 0
a.s.,
where ψn are positive norming factors. Let v be the observed noisy image, and let i be a pixel. Taking for φ the identity, we see that rn (v(N˜i )) converges to E[V (i) | V (N˜i ) = v(N˜i )] under stationary and mixing conditions of the sequence {V (i), V (N˜i )}∞ i=1 . In the case where an additive or multiplicative white noise model is assumed, the next result shows that this conditional expectation is in fact the function of V (N˜i ) that minimizes the mean square error with the original field U . Theorem 4.6. Let V , U , N1 , and N2 be random fields on I such that V = U + N1 + g(U )N2 , where N1 and N2 are independent white noises. Let N be a neighborhood system on I. Then we have the following: (i) E[V (i) | V (N˜i ) = x] = E[U (i) | V (N˜i ) = x] for all i ∈ I and x ∈ Rp .
Image denoising methods
19
Fig. 6. NL-means denoising experiment with a nearly periodic image. Left: Noisy image with standard deviation 30. Right: NL-means restored image.
(ii) The real value E[U (i) | V (N˜i ) = x] minimizes the mean square error (4.3)
min E[(U (i) − g ∗ )2 | V (N˜i ) = x]
g ∗ ∈R
for all i ∈ I and x ∈ Rp . (iii) The expected random variable E[U (i) | V (N˜i )] is the function of V (N˜i ) that minimizes the mean square error (4.4)
min E[U (i) − g(V (N˜i ))]2 . g
Given a noisy image observation v(i) = u(i) + n1 (i) + g(u(i))n2 (i), i ∈ I, where g is a real function and n1 and n2 are white noise realizations, the NL-means algorithm is the function of v(N˜i ) that minimizes the mean square error with the original image u(i). 4.4. Experiments with NL-means. The NL-means algorithm chooses for each pixel a different average configuration adapted to the image. As we explained in the previous sections, for a given pixel i, we take into account the similarity between the neighborhood configuration of i and all the pixels of the image. The similarity between pixels is measured as a decreasing function of the Euclidean distance of the similarity windows. Due to the fast decay of the exponential kernel, large Euclidean distances lead to nearly zero weights, acting as an automatic threshold. The decay of the exponential function, and therefore the decay of the weights, is controlled by the parameter h. Empirical experimentation shows that one can take a similarity window of size 7 × 7 or 9 × 9 for grey-level images and 5 × 5 or even 3 × 3 in color images with little noise. These window sizes have shown to be large enough to be robust to noise and at the same time to be able to take care of the details and fine structure. Smaller windows are not robust enough to noise. Notice that in the limit case, one can take the window reduced to a single pixel i and therefore get back to the Yaroslavsky neighborhood filter. For computational aspects, in the following experiments the average is not performed in all the images. In practice, for each pixel p, we consider only a squared window centered in p and size 21 × 21 pixels. Due to the nature of the algorithm, the most favorable case for the NL-means algorithm is the periodic case. In this situation, for every pixel i of the image one can find a large set of samples with a very similar configuration, leading to a noise reduction and a preservation of the original image; see Figure 6 for an example.
20
A. BUADES, B. COLL, AND J. M. MOREL
Fig. 7. NL-means denoising experiment with a Brodatz texture image. Left: Noisy image with standard deviation 30. Right: NL-means restored image. The Fourier transform of the noisy and restored images show how main features are preserved even at high frequencies.
Another case which is ideally suitable for the application of the NL-means algorithm is the textural case. Texture images have a large redundancy. For a fixed configuration many similar samples can be found in the image. In Figure 7 one can see an example with a Brodatz texture. The Fourier transform of the noisy and restored images shows the ability of the algorithm to preserve the main features even in the case of high frequencies. The NL-means algorithm is not only able to restore periodic or texture images. Natural images also have enough redundancy to be restored. For example, in a flat zone, one can find many pixels lying in the same region and with similar configurations. In a straight or curved edge a complete line of pixels with a similar configuration is found. In addition, the redundancy of natural images allows us to find many similar configurations in far away pixels. See Figure 8. 5. Discussion and comparison. 5.1. NL-means as an extension of previous methods. As was said before, the Gaussian convolution preserves only flat zones, while contours and fine structure are removed or blurred. Anisotropic filters instead preserve straight edges, but flat zones present many artifacts. One could think of combining these two methods to improve both results. A Gaussian convolution could be applied in flat zones, while an anisotropic filter could be applied on straight edges. Still, other types of filters should be designed to specifically restore corners or curved edges and texture. The NL-means algorithm seems to provide a feasible and rational method to automatically take the best of each mentioned algorithm, reducing for every possible geometric configuration the image method noise. Although we have not computed explicitly the image method noise, Figure 9 illustrates how the NL-means algorithm chooses in each case a weight configuration corresponding to one of the previously analyzed filters. In particular, according to this set of experiments, we can consider that the consistency results given in Theorems 2.1, 2.3, and 2.5 are all valid for this algorithm. The NLmeans algorithm is easily extended to the denoising of image sequences and video. The denoising algorithm involves indiscriminately pixels not belonging
Image denoising methods
21
Fig. 8. NL-means denoising experiment with a color image. Left: Noisy image with standard deviation 20 in every color component. Right: Restored image. NL-means algorithm has been applied with a 3×3 color comparison window, with a 21×21 pixels search window, and h = 16
only to same frame but also to all frames in the image. The algorithm favors pixels with a similar local configuration, as the similar configurations move, so do the weights. Thus, the algorithm is able to follow the similar configurations when they move without any explicit motion computation (see figure 10). Classical movie denoising algorithms are motion compensated. The underlying idea is the existence of a “ground true” physical motion, which motion estimation algorithms should be able to estimate. Legitimate information should exist only along these physical trajectories. One of the major difficulties in motion estimation is the ambiguity of trajectories, the so called aperture problem. The aperture problem, viewed as a general phenomenon in movies, can be positively interpreted in the following way: There are many pixels in the next or previous frames which can match the current pixel. Thus, it seems sound to use not just one trajectory, but rather all similar pixels to the current pixel across time and space (see [19] for more details on this discussion). 5.2. Comparison. In this section we shall compare the different algorithms based on four well-defined criteria: the method noise, the noise to noise, the mean square error, and the visual quality of the restored images. Note that every criterion measures a different aspect of the denoising method. It is easy to show that only one criterion is not enough to judge the restored image, and so one expects a good solution to have a high performance under the three criteria. 5.2.1. Method noise comparison. In previous sections we have defined the method noise and computed it for the different algorithms. Remember that the denoising algorithm is applied on the original (slightly noisy) image. A filtering parameter, depending mainly on the standard deviation of the noise, must be fixed for most algorithms. Let us fix σ = 2.5: we can suppose that most digital images are affected by this amount of noise, since it is not visually noticeable. The method noise tells us which geometrical features or details are preserved by the denoising process and which are eliminated. In order to preserve as many features as possible of the original image, the method noise should look as much as possible
22
A. BUADES, B. COLL, AND J. M. MOREL
(a)
(b)
(c)
(d)
(e)
(f)
Fig. 9. On the right-hand side of each pair, we display the weight distribution used to estimate the central pixel of the left image by the NL-means algorithm. (a) In flat zones, the weights are distributed as a convolution filter (as a Gaussian convolution). (b) In straight edges, the weights are distributed in the direction of the level line (as the mean curvature motion). (c) On curved edges, the weights favor pixels belonging to the same contour or level line, which is a strong improvement with respect to the mean curvature motion. (d) In a flat neighborhood, the weights are distributed in a grey-level neighborhood (as with a neighborhood filter). In the cases of (e) and (f), the weights are distributed across the more similar configurations, even though they are far away from the observed pixel. This shows a behavior similar to a nonlocal neighborhood filter or to an ideal Wiener filter.
like white noise. Figure 11 displays the method noise of the different methods for a set of standard natural images. Let us comment on them briefly. • The Gaussian filter method noise highlights all important features of the image. These features have a large Laplacian and are therefore altered by the algorithm; see Theorem 2.1. • As announced in Theorem 2.3, the anisotropic filter method noise displays the corners and high frequency features. The straight edges are instead not to be seen: they have a low curvature. • The total variation method modifies most structures and details of the image. Even straight edges are not well preserved. • The neighborhood filter preserves flat objects and contrasted edges, while edges with a low contrast are not kept. In any case, the contours, texture, and details seem to be well preserved. • The TIHWT method noise is concentrated on the edges and high frequency features. These structures cause coefficients with large enough value, but lower than the threshold. They are removed by the algorithm. The average of the application to all translated versions reduces the method noise, and structures are hardly noticeable.
Image denoising methods
23
a)
b)
c) Fig. 10. Weight distribution of NL-means applied to a movie. In a), b) and c) the first row shows a five frames image sequence. In the second row, the weight distribution used to estimate the central pixel (in white) of the middle frame is shown. The weights are equally distributed over the successive frames, including the current one. They actually involve all the candidates for the motion estimation instead of picking just one per frame. The aperture problem can be taken advantage of for a better denoising performance by involving more pixels in the average.
• It is difficult to find noticeable structure in the DCT empirical Wiener filter method noise. Only some contours are noticeable. In general, this filter seems to perform much better than all local smoothing filters and other frequency domain filters. Its results are similar to those of a hard stationary wavelet thresholding. • The NL-means method noise seems closest to a white noise.
24
A. BUADES, B. COLL, AND J. M. MOREL
Fig. 11. Image method noise. From left to right and from top to bottom: original image, Gaussian convolution, anisotropic filtering, total variation, neighborhood filter, HWT, TIHWT, DCT empirical Wiener filter, and the NL-means algorithm. The parameters have been set for each method to remove a method noise with variance σ 2 = 2.52
5.2.2. The “noise to noise” criterion. The noise to noise principle requires that a denoising algorithm transforms a white noise into white noise. This paradoxical requirement seems to be the best way to characterize artifact-free algorithms. The transformation of a white noise into any correlated signal creates structure and artifacts. Only white noise is perceptually devoid of structure, as was pointed out by Attneave [5]. Figure 12 shows how denoising methods transform a white noise. The convolution with a Gauss kernel is equivalent to the product in the Fourier domain with a Gauss kernel of inverse standard deviation. Therefore, convolving the noise with a kernel reinforces the low frequencies and cancels the high ones. Thus, the filtered noise actually shows big grains due to its prominent low frequencies. Noise filtered by a wavelet thresholding is no more a white noise. The few coefficients with a magnitude larger than the threshold are spread all over the image. The pixels which do not belong to the support of one of these coefficients are set to zero. The visual result is a constant image with superposed wavelets as displayed in Figure
Image denoising methods
25
Fig. 12. The noise to noise criterion. From left to right and from top to bottom: original noise image of standard deviation 20, Gaussian convolution, anisotropic filtering, total variation, neighborhood filter, HWT, TIHWT, DCT empirical Wiener filter, and NL-means. Parameters have been fixed for each method so that the noise standard deviation is reduced by a factor 4.
12. It is easy to prove that the denoised noise is spatially highly correlated. Given a noise realization, the filtered value by the neighborhood filter at a pixel i only depends on its value n(i) and the parameters h and ρ. The neighborhood filter averages noise values at a distance from n(i) less or equal than h. Thus, when the size ρ of the neighborhood increases, by the law of large numbers the filtered value tends to the expectation of the Gauss distribution restricted to the interval (n(i) − h, n(i) + h). This filtered value is therefore a deterministic function of n(i) and h. Independent random variables are mapped by a deterministic function on independent variables. Thus the noise to noise requirement is asymptotically satisfied by the neighborhood filter. The NL-means satisfies the noise to noise principle in the same extent as a neighborhood filter. However, a mathematical statement and proof of this property are more intricate and we shall skip them. 5.2.3. Visual quality comparison. The visual quality of the restored image is another important criterion to judge the performance of a denoising algorithm. Figures 13–15 control on classic benchmark images the absence of artifacts and the
26
A. BUADES, B. COLL, AND J. M. MOREL
correct reconstruction of edges, texture, and fine structure. Figure 13 illustrates the fact that a nonlocal algorithm is needed for the correct reconstruction of periodic images. Local smoothing filters and local frequency filters are not able to reconstruct the wall pattern. Only NL-means and the global Fourier– Wiener filter reconstruct the original texture. The Fourier–Wiener filter is based on a global Fourier transform which is able to capture the periodic structure of the image in a few coefficients. But this only is an ideal filter: the Fourier transform of the original image is being used. Figure 9(e) shows how NL-means chooses the correct weight configuration and explains the correct reconstruction of the wall pattern. Figure 14 shows that the frequency domain filters are well adapted to the recovery of oscillatory patterns. Although some artifacts are noticeable in both solutions, the stripes are well reconstructed. The DCT transform seems to be more adapted to this type of texture, and stripes are a little better reconstructed. For a much more detailed comparison between sliding window transform domain filtering methods and wavelet threshold methods, we refer the reader to [95]. NL-means also performs well on this type of texture, due to its high degree of redundancy. 5.2.4. Mean square error comparison. The mean square error is the square of the Euclidean distance between the original image and its estimate. This numerical quality measurement is the more objective one, since it does not rely on any visual interpretation. Table 1 shows the mean square error of the different denoising methods with the images presented in this paper. This error table seems to corroborate the observations made for the other criteria. One sees, for example, how the frequency domain filters have a lower mean square error than the local smoothing filters. One also sees that in the presence of periodic or textural structures the empirical Wiener filter based on a DCT transform performs better than the wavelet thresholding. Note that, in the presence of periodic or stochastic patterns, NL-means is significantly more precise than the other algorithms. Of course, the errors presented in this table cannot be computed in a real denoising problem. Let us remark, however, that a small error does not guarantee a good visual quality of the restored image. 6. NL-means five years later.
Fig. 13. Denoising experience on a periodic image. From left to right and from top to bottom: noisy image (standard deviation 35), Gauss filtering, total variation, neighborhood filter, Wiener filter (ideal filter),TIHWT, DCT empirical Wiener filtering, and NL-means.
Image denoising methods
27
Fig. 14. Denoising experience on a natural image. From left to right and from top to bottom: noisy image (standard deviation 35), total variation, neighborhood filter, translation invariant hard thresholding (TIHWT), empirical Wiener and NL-means.
Fig. 15. Denoising experience on a natural image. From left to right and from top to bottom: noisy image (standard deviation 35), total variation, neighborhood filter, translation invariant hard thresholding (TIHWT), empirical Wiener and NL-means.
6.1. The non-local paradigm. Since the publication of the 2005 paper [21], several equivalent terms have been devised: “exemplar-based” processing, “self-similarity”, “patch-based” processing, “non-local” processing, “block-matching”, or “sparse dictionaries of blocks”. They all refer to generalizations or alternatives of the non-local means algorithm. Our conclusions on the better denoising performance of a non-local method with respect to state of the art algorithms such as the total variation or the wavelet thresholding have been widely accepted [79] and [43]. The “method noise” methodology to compare the denoising performance has been adopted ever since. The “noise-to-noise” criterion introduced in [19] tackles the risk that, starting from pure noise, a denoising algorithm creates structured features. This may well explain the interest for NL-
28
A. BUADES, B. COLL, AND J. M. MOREL
Table 1 Mean square error table. A smaller mean square error indicates that the estimate is closer to the original image. The numbers have to be compared on each row. The square of the number on the left-hand column gives the real variance of the noise. By comparing this square to the values on the same row, it is quickly checked that all studied algorithms indeed perform some denoising. This is a sanity check! In general, the comparison performance corroborates the previously mentioned quality criteria. Image Boat Lena Barbara Baboon Wall
σ 8 20 25 35 35
GF 53 120 220 507 580
AF 38 114 216 418 660
TV 39 110 186 365 721
YNF 39 129 176 381 598
EWF 33 105 111 396 325
TIHWT 28 81 135 365 712
NL-means 23 68 72 292 59
means in scientific or medical imaging, where the neutrality of algorithms is crucial. Improvements or adaptations of NL-means have been proposed in cryon microscopy [29], fluorescence microscopy [10], Magnetic resonance imaging (MRI) [60], [7], [90], [67], multispectral MRI: [61], [13], and diffusion tensor MRI (DT-MRI) [89]. The notion of image self-similarity itself has been explored and quantified in [2] who notice that “ blocks are well approximated by a number of other blocks at the same or different scales when affine grey scale transformations are employed.” See a similar conclusion in [72]. Likewise, several papers have explored which degree of invariance could be applied to image blocks. [99] explores a rotationally invariant block matching strategy improving NL-means, and [37] uses cross-scale (i.e., downsampled) neighborhoods in the NL-means filter. Self-similarity has also been explored in the Fourier domain for MRI in [62]. NL-means is a computationally demanding algorithm. Several papers have proposed fast and extremely fast (linear) implementations, by block pre-selection [55], [8], by Gaussian KD-trees to classify image blocks [1], by SVD [68], by using the FFT to compute correlation between blocks [86] and by statistical arguments [26]. The statistical validity of the NL-means algorithm is wide open. See [84], [49] and [36] (where a bayesian interpretation is proposed) or [92] where a bias of NL-means is corrected. [44] gives “a probabilistic interpretation and analysis of the method viewed as a random walk on the patch space” 6.2. Generalization to other image processing tasks or other data. The non-local denoising principle also works for 3D data set points [97], [31], and [47]. But it has also be expanded to most image processing tasks: Demosaicking, the operation which transforms the “R or G or B” raw image in each camera into an “R and G and B” image [20], [56], movie colorization, [41] and [52]; image inpainting by proposing a non local image inpainting variational framework with a unified treatment of geometry and texture [4] (see also [91]) ; Zooming by a fractal like technique where examples are taken from the image itself at different scales [36]; movie flicker stabilization [30], compensating spurious oscillations in the colors of successive frames; Superresolution an image zooming method by which several frames from a video, or several low resolution photographs, can be fused into a larger image [75]. The main point of this super-resolution technique is that it gives up an explicit estimate of the motion, allowing actually for a multiple motion, since a block can look like several other blocks in the same frame. The very same observation is made in [35] for devising a super-resolution algorithm and in [39], [28].
Image denoising methods
29
Other classic image nonlocal applications include Image contrast enhancement by applying a reverse non local heat equation [16], and Stereo vision, by performing simultaneous non-local depth reconstruction and restoration of noisy stereo images [46]. Of course, nonlocal techniques apply still better to movies, the main discovery being that, contrary to the previous state of the art algorithms, Denoising image sequences does not require motion estimation [15]. This claim is extensively explored in [10], [9], [19]. 6.3. Hybrid approaches : combining NL-means and linear transforms. Most improvements of NL-means combine the non-local principle with former classic algorithms, and have indeed shown an improved denoising performance. Probably the best performing method so far is the hybrid method BM3D proposed in [27], which combines not less than block-matching, linear transform thresholding, and Wiener filtering! In the words of the authors: The enhancement of the sparsity is achieved by grouping similar 2-D image fragments (e.g., blocks) into 3-D data arrays which we call groups. Collaborative filtering is a special procedure developed to deal with these 3-D groups. We realize it using the three successive steps: 3-D transformation of a group, shrinkage of the transform spectrum, and inverse 3-D transformation. The result is a 3-D estimate that consists of the jointly filtered grouped image blocks. By attenuating the noise, the collaborative filtering reveals even the finest details shared by grouped blocks and, at the same time, it preserves the essential unique features of each individual block. The filtered blocks are then returned to their original positions. Because these blocks are overlapping, for each pixel, we obtain many different estimates which need to be combined. Aggregation is a particular averaging procedure which is exploited to take advantage of this redundancy. A significant improvement is obtained by a specially developed collaborative Wiener filtering. Another iterative and variational version of NL-means which improves the patch distance at each iteration is given in [12]. A related approach combining NL-means and wavelet sub-band mixing is proposed in [73]. 6.4. Non-local PDE’s, non local variational principles. The relationship of neighborhood filters to classic local PDE’s has been discussed in [17] and [18] leading to an adaptation of NL-means which avoids the staircasing effect. Yet, the main interest has shifted to defining non-local PDE’s. The extension of the NL-means method to define nonlocal image-adapted differential operators and non-local variational methods starts with [50], which proposes to perform denoising and deblurring by a non-local functionals. The general goal of this development is actually to give a variational to all neighborhood filters, and to give a non local form to the total variation as well. More precisely, the neighborhood filters derive from the functional Z J(u) =
g( Ω×Ω
|u(x) − u(y)|2 )w(|x − y|)dxdy, h2
where g and w have a Gaussian decay. The non local total variation is Z N LBV (u) := |∇u(x) − ∇(y)|dxdy. Ω×Ω
30
A. BUADES, B. COLL, AND J. M. MOREL
In the same line, a functional yields a (variational) interpretation to NL-means: µ ¶ Z Gσ ∗|u(x−.)−u(y−.)|2 (0) h2 JN L(u) = 1 − e− w(|x − y|)dxdy. Ω×Ω
Non local regularization seems adapted to image deblurring, a notoriously ill-posed problem. The non-local differential operators permit to define a total variation or a Dirichlet integral. Several articles on deblurring have followed this variational line [48], [65], [42] (for image segmentation), [10] (in fluorescence microscopy), [98], again for nonlocal deconvolution and [54] for deconvolution and tomographic reconstruction. In [39], a paper dedicated to another notoriously ill-posed problem, the super-resolution, the non-local variational principle is viewed as “an emerging powerful family of regularization techniques”, and the paper “proposes to use the example-based approach as a new regularizing principle in ill-posed image processing problems such as image super-resolution from several low resolution photographs.” A particular notion of non-local PDE has emerged, whose coefficients are actually image-dependent. For instance in [41] the image colorization is viewed as the minimization of a discrete partial differential functional on the weighted block graph. Thus, it can be seen either as a non-local heat equation on the image, or as a local heat equation on the space of image patches. In an almost equivalent framework, in [83] the set of blocks is viewed as a weighted graph, and the weights of the edge between two blocks centered at x and y respectively are decreasing functions of the block distances. Then a graph Laplacian can be calculated on this graph, seen as the sampling of a manifold, and NL-means can be interpreted as the heat equation on the set of blocks endowed with these weights. In the same way, the neighborhood filter is associated with a heat equation on the image graph. This approach is further extended to a variational formulation on patch graphs in [40]. In this same framework [16] proposed to perform image contrast enhancement by applying a non-local reverse heat equation. Finally, always in this non-local partial differential framework, [11] extends the Mumford-Shah image segmentation energy to contain a non-local self-similarity term replacing the usual Dirichlet term. The square of the gradient is replaced by the square of the non-local gradient. 6.5. Sparse representations on blocks. The exploration of image redundancy and its application to image restoration has led to new attempts at sparse image representations by block dictionaries [49]. The paper [56] contains a careful bibliographical analysis of sparse image representations. It also proposes an algorithm building a redundant block basis. Using the K-SVD algorithm, an optimal redundant basis is looked for in the space of blocks, with the criterion that the decomposition of all other blocks in the image must be as sparse as possible. Such sparse bases can the be efficiently used to such tasks as image denoising and image demosaicking. This approach and variants applied to video have been considered in [57], [74], and [24]. Acknowledgments. We thank Fran¸cois Malgouyres, St´ephane Mallat, Yves Meyer, Stanley Osher, Guillermo Sapiro, and Luminita Vese for valuable conversations and comments. Several experiments have used the public software libraries MegaWave, Wavelab, and Advanced Image Processing Lab. REFERENCES [1] A. Adams, N. Gelfand, J. Dolson, and M. Levoy, Gaussian KD-Trees for Fast HighDimensional Filtering.
Image denoising methods
31
[2] S.K. Alexander, E.R. Vrscay, and S. Tsurumi, A simple, general model for the affine selfsimilarity of images, Lecture Notes in Computer Science, 5112 (2008), pp. 192–203. [3] L. Alvarez, P.L. Lions, and J.M. Morel, Image selective smoothing and edge detection by nonlinear diffusion. II, SIAM Journal on Numerical Analysis, (1992), pp. 845–866. [4] P. Arias, V. Caselles, and G. Sappiro, A variational framework for non-local image inpainting, Proc. of EMMCVPR. Springer, Heidelberg, (2009). [5] F. Attneave, Some informational aspects of visual perception, Psychological review, 61 (1954), pp. 183–193. [6] S.P. Awate and R.T. Whitaker, Unsupervised, information-theoretic, adaptive image filtering for image restoration, IEEE Trans. PAMI, 28 (2006), pp. 364–376. [7] C. Barillot and F. Rennes, An optimized blockwise non local means denoising filter for 3D magnetic resonance images, Transactions on Medical Imaging, (2007), p. 18. [8] R.C. Bilcu and M. Vehvilainen, Combined Non-Local averaging and intersection of confidence intervals for image denoising, in 15th IEEE Intern. Conf. on Image Processing, 2008, pp. 1736–1739. [9] J. Boulanger, C. Kervrann, and P. Bouthemy, Space-time adaptation for patch-based image sequence restoration, IEEE Trans. PAMI, 29 (2007), pp. 1096–1102. [10] J. Boulanger, J.B. Sibarita, C. Kervrann, and P. Bouthemy, Non-parametric regression for patch-based fluorescence microscopy image sequence denoising, in 5th IEEE Int. Symp. on Biomedical Imaging: From Nano to Macro, 2008. ISBI 2008, 2008, pp. 748–751. [11] X. Bresson and TF Chan, Non-local unsupervised variational image segmentation models, UCLA CAM Report, (2008), pp. 08–67. [12] T. Brox and D. Cremers, Iterated nonlocal means for texture restoration, Lecture Notes in Computer Science, 4485 (2007), p. 13. [13] A. Buades, A. Chien, JM Morel, and S. Osher, Topology preserving linear filtering applied to medical imaging, SIAM Journal on Imaging Science, 1 (2008), pp. 26–50. [14] A. Buades, B. Coll, and JM Morel, Image data process by image noise reduction and camera integrating the means for implementing this process, French Patent 0404837. [15] , Denoising image sequences does not require motion estimation, in IEEE Conference on Advanced Video and Signal Based Surveillance, 2005, 2005, pp. 70–74. [16] A. Buades, B. Coll, and J.M. Morel, Image enhancement by non-local reverse heat equation, Preprint CMLA, 22 (2006). [17] , Neighborhood filters and PDE’s, Numerische Mathematik, 105 (2006), pp. 1–34. [18] , The staircasing effect in neighborhood filters and its solution, IEEE Transactions on Image Processing, 15 (2006), pp. 1499–1505. [19] , Nonlocal image and movie denoising, International Journal of Computer Vision, 76 (2008), pp. 123–139. [20] A. Buades, B. Coll, JM Morel, and C. Sbert, Self-Similarity Driven Color Demosaicking., IEEE Transactions on Image Processing, 18 (2009), pp. 1192–1202. [21] A. Buades, B. Coll, and J. M. Morel, A review of image denoising algorithms, with a new one, Multiscale Modeling Simulation, 4 (2005), pp. 490–530. [22] F. Catte, F. Dibos, and G. Koepfler, A morphological scheme for mean curvature motion and applications to anisotropic diffusion and motion of level sets, in IEEE International Conference Image Processing, vol. 1, 1994. [23] A. Chambolle and P.L. Lions, Image recovery via total variation minimization and related problems, Numerische Mathematik, 76 (1997), pp. 167–188. [24] P. Chatterjee and P. Milanfar, Image denoising using locally learned dictionaries, Computational Imaging VII. Edited by Chatterjee, Priyam; Milanfar, Peyman. Proceedings of the SPIE, 7246 (2009), pp. 72460V–72460V. [25] R.R. Coifman and D.L. Donoho, Translation-invariant de-noising, Lecture Notes In Statistics, (1995), pp. 125–125. [26] P. Coupe, P. Yger, and C. Barillot, Fast non local means denoising for 3D MRI images, MICCAI (2), pp. 33–40. [27] K. Dabov, A. Foi, V. Katkovnik, and K. Egiazarian, Image denoising by sparse 3D transform-domain collaborative filtering, IEEE Transactions on Image Processing, 16 (2007), pp. 2080–2095. [28] A. Danielyan, A. Foi, V. Katkovnik, and K. Egiazarian, Image And Video SuperResolution Via Spatially Adaptive Block-Matching Filtering, in Proceedings of International Workshop on Local and Non-Local Approximation in Image Processing, 2008. [29] J. Darbon, A. Cunha, T.F. Chan, S. Osher, and G.J. Jensen, Fast nonlocal filtering applied to electron cryomicroscopy, in 5th IEEE Int. Symp. on Biomedical Imaging: From Nano to Macro.
32
A. BUADES, B. COLL, AND J. M. MOREL
[30] J. Delon and A. Desolneux, Flicker stabilization in image sequences, hal.archives-ouvertes.fr. [31] B. Dong, J. Ye, S. Osher, and I. Dinov, Level set based nonlocal surface restoration, Multiscale Modeling & Simulation, 7 (2008), p. 589. [32] D.L. Donoho, De-noising by soft-thresholding, IEEE Transactions on Information Theory, 41 (1995), pp. 613–627. [33] D.L. Donoho and J.M. JOHNSTONE, Ideal spatial adaptation by wavelet shrinkage, Biometrika, 81 (1994), pp. 425–455. [34] S. Durand and M. Nikolova, Restoration of wavelet coefficients by minimizing a specially designed objective function, in Proc. IEEE Workshop on Variational, Geometric and Level Set Methods in Computer Vision, 2003, pp. 145–152. [35] M. Ebrahimi and E.R. Vrscay, Multi-frame super-resolution with no explicit motion estimation, in Proceedings of the 2008 International Conference on Image Processing, Computer Vision, and Pattern Recognition. [36] , Solving the Inverse Problem of Image Zooming Using” Self-Examples”, Lecture Notes in Computer Science, 4633 (2007), p. 117. , Examining the role of scale in the context of the non-local-means filter, Lecture Notes [37] in Computer Science, 5112 (2008), pp. 170–181. [38] A.A. Efros and T.K. Leung, Texture synthesis by non-parametric sampling, in International Conference on Computer Vision, vol. 2, Corful, Greece, 1999, pp. 1033–1038. [39] M. Elad and D. Datsenko, Example-based regularization deployed to super-resolution reconstruction of a single image, The Computer Journal, (2007). [40] A. Elmoataz, O. Lezoray, and S. Bougleux, Nonlocal discrete regularization on weighted graphs: a framework for image and manifold processing, IEEE Transactions on Image Processing, 17 (2008), pp. 1047–1060. [41] A. Elmoataz, O. Lezoray, S. Bougleux, and V.T. Ta, Unifying local and nonlocal processing with partial difference operators on weighted graphs, in International Workshop on Local and Non-Local Approximation in Image Processing, 2008. [42] G. Gilboa and S. Osher, Nonlocal linear image regularization and supervised segmentation, Multiscale Modeling and Simulation, 6 (2008), pp. 595–630. [43] B. Goossens, H. Luong, A. Pizurica, and W. Philips, An Improved Non-Local Denoising Algorithm, in Proceedings of the 2008 International Workshop on Local and Non-Local Approximation in Image Processing, Lausanne, Switzerland, 2008. [44] S.S. Gornale, R. Manza, V. Humbe, and K.V. Kale, Performance analysis of bi-orthogonal wavelet filters for lossy fingerprint image compression, International Journal on Signal Processing (Accepted). [45] F. Guichard, J.M. Morel, and R. Ryan, Contrast invariant image analysis and PDEs, Book in preparation. [46] Y.S. Heo, K.M. Lee, and S.U. Lee, Simultaneous depth reconstruction and restoration of noisy stereo images using non-local pixel distribution, in IEEE Conference on Computer Vision and Pattern Recognition, 2007, pp. 1–8. [47] B. Huhle, T. Schairer, P. Jenke, and W. Straßer, Robust non-local denoising of colored depth data, in IEEE Computer Society Conference on Computer Vision and Pattern Recognition Workshops, 2008, pp. 1–7. [48] M. Jung and LA Vese, Nonlocal variational image deblurring models in the presence of Gaussian or impulse noise. [49] C. Kervrann, J. Boulanger, and P. Coupe, Bayesian non-local means filter, image redundancy and adaptive dictionaries for noise removal, Lecture Notes In Computer Science, 4485 (2007), p. 520. [50] S. Kindermann, S. Osher, and P.W. Jones, Deblurring and denoising of images by nonlocal functionals, Multiscale Modeling and Simulation, 4 (2006), pp. 1091–1115. [51] E. Levina, Statistical issues in texture analysis, Ph. D. Thesis, (2002). [52] O. Lezoray, V.T. Ta, and A. Elmoataz, Nonlocal graph regularization for image colorization, International Conference on Pattern Recognition, (2008). [53] M. Lindenbaum, M. Fischer, and A. Bruckstein, On Gabor’s contribution to image enhancement, Pattern Recognition, 27 (1994), pp. 1–8. [54] Y. Lou, X. Zhang, S. Osher, and A. Bertozzi, Image recovery via nonlocal operators, UCLA CAM Reports (08-35). [55] M. Mahmoudi and G. Sapiro, Fast image and video denoising via nonlocal means of similar neighborhoods, IEEE Signal Processing Letters, 12 (2005), pp. 839–842. [56] J. Mairal, M. Elad, G. Sapiro, et al., Sparse representation for color image restoration, IEEE Transactions on Image Processing, 17 (2008), p. 53. [57] J. Mairal, G. Sapiro, and M. Elad, Learning multiscale sparse representations for image
Image denoising methods
33
and video restoration, SIAM Multiscale Modeling and Simulation, 7 (2008), pp. 214–241. [58] F. Malgouyres, Noise selection approach to image restoration, in Proceedings of SPIE, vol. 4478, 2001, p. 34. [59] S. Mallat, A Wavelet Tour of Signal Processing, Academic press, 1999. ´ n, J. Carbonell-Caballero, J.J. Lull, G. Garc´ıa-Mart´ı, L. Mart´ı-Bonmat´ı, [60] J.V. Manjo and M. Robles, MRI denoising using Non-Local Means, Medical Image Analysis, 12 (2008), pp. 514–523. ´ n, M. Robles, and N.A. Thacker, Multispectral MRI Denoising Using Non-Local [61] J.V. Manjo Means, in Proc. MIUA, vol. 7, pp. 41–45. [62] G.S. Mayer, E.R. Vrscay, M.L. Lauzon, B.C. Goodyear, and J.R. Mitchell, Selfsimilarity of Images in the Fourier Domain, with Applications to MRI, Lecture Notes in Computer Science, 5112 (2008), pp. 43–52. [63] B. Merriman, J. Bence, and S. Osher, Diffusion generated motion by mean curvature, in Computational Crystal Growers Workshop, Amer. Math. Soc. Providence, 1992. [64] Y. Meyer, Oscillating Patterns in Image Processing and Nonlinear Evolution Equations, American Mathematical Society, Providence, RI, 22, University Lecture Series (2001). [65] M. Mignotte, A non-local regularization strategy for image deconvolution, Pattern Recognition Letters, 29 (2008), pp. 2206–2212. ´ [66] E.A. Nadaraya, On non-parametric estimates of density functions and regression curves, Theory of Probability and its Applications, 10 (1965), p. 186. ´e, SNR enhance[67] B. Naegel, A. Cernicanu, J.N. Hyacinthe, M. Tognolini, and J.P. Valle ment of highly-accelerated real-time cardiac MRI acquisitions based on non-local means algorithm, Medical Image Analysis, (2009). [68] J. Orchard, M. Ebrahimi, and A. Wong, Efficient Non-Local-Means Denoising using the SVD, in Proceedings of The IEEE International Conference on Image Processing, 2008. [69] E. Ordentlich, G. Seroussi, S. Verdu, M. Weinberger, and T. Weissman, A discrete universal denoiser and its application to binary images, in International Conference on Image Processing, vol. 1, 2003. [70] S. Osher, M. Burger, D. Goldfarb, J. Xu, and W. Yin, Using geometry and iterated refinement for inverse problems (1): Total variation based image restoration, Department of Mathematics, UCLA, LA, CA, 90095 (2004), pp. 04–13. [71] P. Perona and J. Malik, Scale-space and edge detection using anisotropic diffusion, IEEE Trans. PAMI, 12 (1990), pp. 629–639. ´, Sparse modeling of textures, Journal of Mathematical Imaging and Vision, 34 (2009), [72] G. Peyre pp. 17–31. [73] C. Pierrick et al., 3D Wavelet Subbands Mixing for Image Denoising, International Journal of Biomedical Imaging, 2008 (2008). [74] M. Protter and M. Elad, Image sequence denoising via sparse and redundant representations, IEEE Trans. on Image Processing, (2008). [75] M. Protter, M. Elad, H. Takeda, and P. Milanfar, Generalizing the non-local-means to super-resolution reconstruction, IEEE Transactions on Image Processing, (2008). [76] GG Roussas, Nonparametric regression estimation under mixing conditions, Stochastic processes and their applications, 36 (1990), pp. 107–116. [77] L.I. Rudin and S. Osher, Total variation based image restoration with free local constraints, in IEEE International Conference on Image Processing, vol. 1, 1994. [78] L. Rudin, S. Osher, and E. Fatemi, Nonlinear total variation based noise removal algorithms, Physica D, 60 (1992), pp. 259–268. [79] H.J. Seo, P. Chatterjee, H. Takeda, and P. Milanfar, A comparison of some state of the art image denoising methods, in Proc. 41st Asilomar Conference on Signals, Systems, and Computers, 2007. [80] C.E. Shannon, A mathematical theory of communication, ACM SIGMOBILE Mobile Computing and Communications Review, 5 (2001), pp. 3–55. [81] A. Sharf, M. Alexa, and D. Cohen-Or, Context-based surface completion, ACM Transactions on Graphics (TOG), 23 (2004), pp. 878–887. [82] S.M. Smith and J.M. Brady, SUSANA new approach to low level image processing, International Journal of Computer Vision, 23 (1997), pp. 45–78. [83] A.D. Szlam, M. Maggioni, and R.R. Coifman, A general framework for adaptive regularization based on diffusion processes on graphs, Yale technichal report, (2006). [84] N.A. Thacker, J.V. Manjon, and P.A. Bromiley, A Statistical Interpretation of Non-Local Means, in 5th International Conference on Visual Information Engineering, 2008, pp. 250– 255. [85] C. Tomasi and R. Manduchi, Bilateral filtering for gray and color images, in Computer Vision,
34
A. BUADES, B. COLL, AND J. M. MOREL
1998. Sixth International Conference on, 1998, pp. 839–846. [86] J. Wang, Y. Guo, Y. Ying, Y. Liu, and Q. Peng, Fast non-local algorithm for image denoising, in 2006 IEEE International Conference on Image Processing, 2006, pp. 1429–1432. [87] G.S. Watson, Smooth regression analysis, Sankhy¯ a: The Indian Journal of Statistics, Series A, (1964), pp. 359–372. [88] T. Weissman, E. Ordentlich, G. Seroussi, S. Verdu, and MJ Weinberger, Universal discrete denoising: Known channel, IEEE Transactions on Information Theory, 51 (2005), pp. 5–28. ´, S. Prima, P. Coupe ´, S.P. Morrissey, and C. Barillot, Non-local means [89] N. Wiest-Daessle variants for denoising of diffusion-weighted and diffusion tensor MRI, Lecture Notes in Computer Science, 4792 (2007), p. 344. ´, S.P. Morrissey, and C. Barillot, Rician noise [90] N. Wiest-Daessle, S. Prima, P. Coupe removal by non-local means filtering for low signal-to-noise ratio MRI: Applications to DT-MRI, Lecture Notes in Computer Science, 5242 (2008), pp. 171–179. [91] A. Wong and J. Orchard, A nonlocal-means approach to exemplar-based inpainting, in 15th IEEE International Conference on Image Processing, 2008, 2008, pp. 2600–2603. [92] H. Xu, J. Xu, and F. Wu, On the biased estimation of nonlocal means filter, in 2008 IEEE International Conference on Multimedia and Expo, 2008, pp. 1149–1152. [93] L.P. Yaroslavsky, Local adaptive image restoration and enhancement with the use of DFT and DCT in a running window, in Proceedings of SPIE, vol. 2825, 1996, p. 2. [94] L. Yaroslavsky and M. Eden, Fundamentals of Digital Optics, 2003. [95] L.P. Yaroslavsky, K.O. Egiazarian, and J.T. Astola, Transform domain image restoration methods: review, comparison, and interpretation, in Proc. of SPIE, vol. 4304, 2001, p. 155. [96] L. P. Yaroslavsky, Digital Picture Processing, Springer-Verlag New York, Inc., Secaucus, NJ, USA, 1985. [97] S. Yoshizawa, A. Belyaev, and H.P. Seidel, Smoothing by example: Mesh denoising by averaging with similarity-based weights, in IEEE International Conference on Shape Modeling and Applications, 2006, pp. 9–9. [98] X. Zhang, M. Burger, X. Bresson, and S. Osher, Bregmanized nonlocal regularization for deconvolution and sparse reconstruction, UCLA CAM Report, (2009), pp. 09–03. [99] S. Zimmer, S. Didas, and J. Weickert, A rotationally invariant block matching strategy improving image denoising with non-local means, in Proc. 2008 International Workshop on Local and Non-Local Approximation in Image Processing, 2008.