SPIE International Symposium on
4–9 February 2012 San Diego, California, USA
1. Conference code: MI101 2. Name of conference: Physics of Medical Imaging 3. Title of paper:
Image Fusion algorithm for Differential Phase Contrast Imaging 4. Author list: Ewald Roessla , Thomas Koehlera , Udo van Stevendaala , Nik Hauserb , Zhentian Wangc , Marco Stampanonic,d a
Philips Research Laboratories, Innovative Technologies, Hamburg, Germany Department of Gynecology and Obstetrics, Interdisciplinary Breast Center Baden, Kantonsspital Baden, 5404 Baden, Switzerland c Swiss Light Source, Paul Scherrer Institut, 5232 Villigen, Switzerland d Institute for Biomedical Engineering, University and ETH Z¨ urich, 8092 Z¨ urich, Switzerland
b
EMail:
[email protected] 5. Presentation Preference: Oral presentation 6. Keywords: differential phase contrast imaging, Talbot-Lau interferometry, image composition, mammography
Text Summary Purpose: Differential phase-contrast imaging in the x-ray domain provides three physically complementary signals [1, 2]: the attenuation, the differential phase-contrast, related to the refractive index, and the dark-field signal, related to the total amount of radiation scattered into very small angles. In medical applications, it is of the utmost importance to present to the radiologist all clinically relevant information in as compact a way as possible. Hence, the need arises for a method to combine two or more of the above mentioned signals into one image containing all information relevant for diagnosis. We present an image composition algorithm that fuses the attenuation image and the differential phase contrast image into a composite, final image. The merging is performed in such a way that the composite image is characterized by minimal noise-power at each frequency component. Methods: The algorithm is based on the assumption that, approximately, the linear attenuation coefficient µ and the refractive index decrement δ can be transformed into one another by a simple scaling operation: δ(x, y, z) = c µ(x, y, z) .
(1)
The validity of this approximation depends on the relative importance of the Compton-effect as compared to the photo-electric effect and on the magnitude of the variations in effective atomic number in the sample. From the above assumption it immediately follows that the Fourier transforms of the measured quantities f (x, y)
and g(x, y), denoting the line-integrals of the attenuation and the gradient of the refractive index decrement, respectively, R (2) f (x, y) = µ(x, y, z)dz C
g(x, y) =
R C
are related via the following equation:
∂ ∂x δ(x, y, z)dz
(3)
,
G(kx , y) = −2πi kx c F (kx , y) .
(4)
F (kx , y) and G(kx , y) denote the 1-dimensional Fourier transform of the image data along the direction perpendicular to the x-ray gratings. Using the fact that the noise in f (x, y) and g(x, y) is uncorrelated to a very good extent (see, e.g., [3], p.56), we derive optimal frequency dependent filter functions ω1 (kx ) and ω2 (kx ) for a noise-optimal combination h(x, y) of images f (x, y) and g(x, y) in Fourier space: H(kx , y) = ω1 (kx )F (kx , y) + ω2 (kx )
1 G(kx , y) , −2πikx c
(5)
where ω1 (kx ) and ω2 (kx ) are given by: ω1 (kx )
=
1 x 2 1+( k k0 )
and ω2 (kx ) =
( kkx0 )2 1 + ( kkx0 )2
(6)
and where the constant frequency k0 is defined by 1 k0 = 2πc
s
σg2 . σf2
(7)
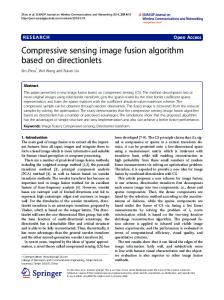
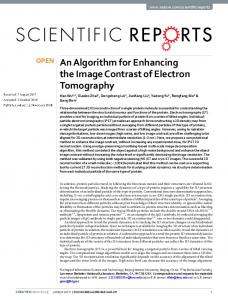
The choice expressed in Eq. (6) minimizes the noise in H(kx , y), expressed by Eq. (5) at each frequency component kx . σf2 and σg2 denote typical values for the noise variance in the images f (x, y) and g(x, y). The algorithm was applied for two different examples, the scan data of a test phantom (a cable strap with hook structures of constant gradients) and a differential phase-contrast scan of native human breast tissue. Results: The results of the scan of the cable strap are shown in Fig. 1 below. Part (a) of Figure 1 illustrates the amplification of low frequency noise during the Fourier-based integration. Note that the dc frequency component in this Figure was taken from the corresponding component from the attenuation image shown in part (b). The reduced noise level in the fused image can be appreciated in part (c) as compared to part (b). The noise reduction factor (increase in SNR) achieved by the application of the algorithms was measured in a small region-of-interest in the flat part of the cable strap and is given by 1.8. The results of the scan of native breast tissue are shown in Figure 2, below. Note that the images show only a small region of the total scan field of view. New or breakthrough work to be presented: We present a novel algorithm to combine data from differential phase contrast projection imaging devices in a noise optimal way under the assumption of a simple scaling law between the attenuation coefficient µ and refractive index decrement δ. This assumption is certainly well satisfied for biological tissue like breast tissue where the local changes in the effective atomic number of the tissue are typically small. Very importantly, we found that the achieved increase in SNR in the case of the test-sample by about a factor of 1.8 is already above the required increase for compensating for the loss of √ usable radiation in the analyzer gratings, which would be a factor of 2. Conclusion: Our results indicate that already the fusion of the attenuation image and the differential phase contrast image holds the potential to overcome the problems related to dose utility in this technique due to typically highly attenuating analyzer gratings. The information of the dark-field image [2] has not been taken into account yet and might further be a useful ingredient for more complete fusion algorithms.
(a)
(b)
(c)
Figure 1: Integrated phase image (a), attenuation image (b) and fused image (c) as obtained with the proposed algorithm. All images are displayed on a linear grey-scale ranging from 0 (black) to 0.03 (white) and represent the line-integrals of the linear attenuation coefficient (either directly as in the case of (b) or indirectly as in the case of (a) and (c)).
References [1] F. Pfeiffer, T. Weitkamp, O. Bunk, and C. David, “Phase retrieval and differential phase-contrast imaging with low-brilliance X-ray sources,” Nature Phys. 2, 258 – 261 (2006). [2] F. Pfeiffer, M. Bech, O. Bunk, P. Kraft, E. F. Eikenberry, C. Br¨ onnimann, C. Gr¨ unzweig, and C. David, “Hard-X-ray dark-field imaging using a grating interferometer,” Nature Mater. 7, 134 – 137 (2008). [3] S. M. Kay, Fundamentals of statistical signal processing, Volume 1, Estimation Theory (Prentice Hall Signal Processing Series, Prentice Hall PTR, New Jersey, 1993).
1 50
0.95
100 0.9 150 0.85
200 250
0.8
300
0.75
350 0.7 400 0.65
450 500 100
200
300
400
500
600
700
800
900
1000
0.6
(a) 1 50
0.95
100 0.9 150 0.85
200 250
0.8
300
0.75
350 0.7 400 0.65
450 500 100
200
300
400
500
600
700
800
900
1000
0.6
(b)
Figure 2: Attenuation image (a) and fused image (b) as obtained with the proposed algorithm applied to data from a scan of a native, human breast tissue sample. The images are displayed on a linear grey-scale ranging from 0.6 (black) to 1.0 (white) and again represent the line-integrals of the linear attenuation coefficient.