N e u r o r a d i o l o g y / H e a d a n d N e c k I m a g i n g • P i c t o r i a l E s s ay Allmendinger et al. Perfusion CT of Stroke
FOCUS ON:
Downloaded from www.ajronline.org by 54.210.20.124 on 10/29/15 from IP address 54.210.20.124. Copyright ARRS. For personal use only; all rights reserved
Neuroradiology/Head and Neck Imaging Pictorial Essay
CME SAM
Andrew Mark Allmendinger 1 Elizabeth R. Tang2 Yvonne W. Lui2 Vadim Spektor 1 Allmendinger AM, Tang ER, Lui YW, Spektor V
Imaging of Stroke
Imaging of Stroke: Part 1, Perfusion CT—Overview of Imaging Technique, Interpretation Pearls, and Common Pitfalls OBJECTIVE. Perfusion CT is being increasingly used as a diagnostic tool for the evaluation of acute ischemic stroke. It can be performed rapidly and aids in the detection of salvageable tissue (penumbra) from the unsalvageable core infarct. The purpose of this article is to provide an overview of the imaging technique, interpretation pearls, and common pitfalls encountered in perfusion CT of the brain. CONCLUSION. Perfusion CT has proven to be a valuable tool in the diagnosis of acute ischemic stroke. The knowledge provided by these cases will allow the reader not only to confidently identify the presence of acute ischemic stroke, but also to recognize the common pitfalls and limitations of perfusion CT in this setting.
P
erfusion CT is a readily accessible and rapid technique that can aid in the detection of acute ischemic stroke. Moreover, it can help identify patients likely to benefit from early reperfusion. Despite these advantages, interpretation of perfusion CT can be complex and is not without pitfalls. This article will review normal and ischemic perfusion patterns followed by an illustrative case series of common pitfalls and limitations of perfusion CT in the setting of acute ischemic stroke.
Keywords: acetazolamide, ischemia, penumbra, perfusion CT, stroke DOI:10.2214/AJR.10.7255 Received April 30, 2010; accepted after revision November 16, 2010. 1 Department of Radiology, St. Vincent’s Catholic Medical Center, 170 W 12th St, New York, NY 10011. Address correspondence to A. M. Allmendinger (
[email protected]). 2 Department of Radiology, Albert Einstein College of Medicine, Montefiore Medical Center, Bronx, NY.
CME/SAM This article is available for CME/SAM credit. AJR 2012; 198:52–62 0361–803X/12/1981–52 © American Roentgen Ray Society
52
Advantages and Potential Disadvantages of Perfusion CT The advantages of perfusion CT include its widespread availability, speed of image acquisition, relative lower cost compared with MRI, and ease of patient monitoring [1, 2]. Unenhanced CT remains the mainstay of imaging evaluation for the acute stroke patient. Unenhanced CT allows the identification of large areas of clearly infarcted tissue and hemorrhage and can sometimes reveal proximal vessel thrombus. In most medical centers today, unenhanced CT is the main diagnostic test used to triage patients and identify those who are candidates for thrombolysis [3–5]. CT angiography (CTA) and perfusion CT may be performed immediately after unenhanced CT. CTA and perfusion CT allow better identification of infarct, vessel thrombus, and vessel stenosis. CTA shows the vascular anatomy, and perfusion
CT shows physiologic processes including cerebral blood volume (CBV) and cerebral blood flow (CBF); the information provided by perfusion CT may allow widening of the reperfusion time window [6–9]. Perfusion CT has been shown to increase diagnostic certainty for stroke detection by expert and nonexpert readers [10]. Among nonexpert readers, review of perfusion CT maps increased correct stroke diagnosis fourfold over that achieved by review of unenhanced CT studies alone [10]. Perfusion CT can also help to identify acute strokes that are too large—that is, cases in which the administration of thrombolytic therapy carries an unacceptably high risk of hemorrhagic conversion. Perfusion CT has several important drawbacks compared to conventional nonenhanced CT that need to be addressed: additional radiation dose; IV contrast administration; additional cost; and longer total time required for image acquisition, processing, and interpretation. Although CTA and perfusion CT do require additional radiation dose over unenhanced CT, the newest scanners with optimized protocols can image the entire cranium without substantial increases in radiation dose. However, suboptimal protocols have resulted in alarming amounts of radiation exposure—as much as eight times the expected dose. Several instances of excess radiation exposure relating to perfusion CT have recently been uncovered, prompting the U.S. Food and Drug Administration to investigate [10].
AJR:198, January 2012
Downloaded from www.ajronline.org by 54.210.20.124 on 10/29/15 from IP address 54.210.20.124. Copyright ARRS. For personal use only; all rights reserved
Perfusion CT of Stroke The risks of iodinated contrast administration are well known and, overall, are thought to fall within an acceptable level of risk in the workup of the acute stroke patient with regard to risks, benefits, and alternatives. The additional time required to perform CTA and perfusion CT is on the order of mere minutes, an acceptable period of time in the acute stroke setting. Postprocessing time and interpretation time are much more variable however, similar to that of MRI. In our experience, postprocessing and interpretation can be performed in as short a time as a few minutes—that is, in the time it takes for the patient to be moved from the CT scanner to an appropriate clinical care unit. The cost-benefit ratio of perfusion CT needs to be further assessed both from the medical institution perspective and from the public health perspective. Normal Perfusion There are several perfusion CT parameters that are commonly discussed: CBV, CBF, mean transit time (MTT), and time to peak enhancement (TTP). CBV is a measure of the total volume of blood within an imaging voxel including blood in the tissues and blood vessels. CBV is measured in units of milliliters of blood per 100 g of brain. CBF is the total volume of blood moving through a voxel in a given unit of time and is commonly measured in units of milliliters of blood per 100 g of brain tissue per minute. After a bolus of contrast material is injected, time is required for each individual molecule of contrast material to circulate. The MTT is the average transit time of all the molecules of contrast medium with the bolus through a given volume of brain measured in seconds. MTT can be approximated according to the central volume principle: MTT = CBV / CBF. TTP is defined as the time from the start of the contrast injection to maximal enhancement measured in seconds. These parameters are commonly derived from perfusion CT source data using deconvolution analysis. Arterial and venous regions of interest (ROIs) and pre- and postenhancement cutoff values are selected from the perfusion CT source images to generate representative arterial input and venous outflow time-attenuation curves. These time-attenuation curves are then used to calculate the perfusion CT parameters. The A2 segment of the anterior cerebral artery is commonly used to obtain the arterial input function (AIF) ROI because it
travels perpendicular to the axial plane. This segment is present on several axial slices and is typically easy for either a technologist or a radiologist to locate. Similarly, the superior sagittal sinus can be used to obtain the venous output function (VOF) ROI. Interpretation of perfusion CT maps is most commonly done through visual inspection, an effective method for identifying areas of core infarct and penumbra. This method has the advantage of speed and simplicity; however, qualitative methods are highly dependent on user interpretation. Some centers advocate calculating quantitative perfusion parameters. These parameters have been shown to be effective in showing core infarct and penumbra and in predicting therapeutic outcome; however, protocols and guidelines for quantitative thresholds vary and clearly defined thresholds for guiding therapy have not yet been standardized. In cases of normal perfusion (Fig. 1), there is bilateral symmetric perfusion of all perfusion CT parameters. The CBF and CBV are higher in gray matter than in white matter secondary to normal physiologic differences between these tissues [11]. Acute Infarction The diagnosis of acute ischemic stroke is made on perfusion CT by identifying areas of decreased CBF and CBV, and increased MTT and TTP. Matched perfusion abnormalities on CBV and MTT maps correspond to areas of nonsalvageable brain tissue and neuronal death, also known as “core infarct” [12] (Figs. 2 and 3). Mismatched areas of abnormal perfusion—namely, areas of prolonged MTT and diminished CBF where CBV is relatively preserved—correspond to areas of salvageable tissue. In such an area, also called “ischemic penumbra,” decreases in CBV may be only mild. Because of compensatory cerebrovascular mechanisms, many patients are able to preserve CBV within an area at risk for ischemic injury shortly after the initial insult. Patients with areas of CBV-MTT mismatch that are large or that involve eloquent areas of brain may be good candidates for reperfusion therapy. CBF may also be decreased to a lesser degree within ischemic penumbra [2]. Assessment of Cerebrovascular Reserve Cerebrovascular stenoocclusive disease is most commonly related to intracranial atherosclerotic disease and can result in di-
minished distal arterial perfusion pressure. There are, however, mechanisms for compensation including autoregulatory vasodilatation and collateral circulation. During stress, areas affected by cerebrovascular stenoocclusive disease are at risk for ischemia because cerebrovascular reserve, in the form of collateral vessels and autoregulatory response, is limited. Acetazolamide, a carbonic anhydrase inhibitor, causes short-term vasodilatation of the cerebral arterioles and when used in conjunction with perfusion CT helps estimate cerebrovascular reserve. Comparison of baseline perfusion CT maps with those obtained after acetazolamide administration shows decreases in CBF and prolongation of MTT (Fig. 4) in areas of hemodynamic impairment [13, 14]. These changes occur because vessels already maximally dilated because of autoregulatory reflex vasodilation do not have the same response to acetazolamide. One investigator has shown that regions showing prominent changes in MTT after acetazolamide should be considered atrisk territories [14]. Pitfalls in Perfusion CT Arterial and Venous Outflow Function The ability to obtain appropriate AIFs and VOFs is crucial for obtaining valid perfusion maps. Arterial and venous ROIs and pre- and postenhancement cutoff values are selected from the perfusion CT source images to generate representative AIF and VOF time-attenuation curves. These time-attenuation curves are then used to calculate the perfusion CT parameters. The A2 segment of the anterior cerebral artery is commonly used to obtain the AIF ROI because it travels perpendicular to the axial plane and is easy to locate on multiple images. Similarly, the superior sagittal sinus is frequently used to obtain the VOF ROI (Fig. 5). Technical problems may arise in cases of intracranial and extracranial stenosis and occlusion that result in decreased intracranial blood flow. Decreased blood flow may impair accurate calculation of perfusion CT maps (Fig. 6). Improper placement of ROIs can affect both visual and quantitative assessments of perfusion CT metrics [15]. For example, poor placement of either the AIF ROI or the VOF ROI can result in the appearance of global hypoperfusion (Fig. 5). Slice Selection Most symptomatic cerebral ischemic events involve the middle cerebral artery (MCA) territory; therefore, many current perfusion CT pro-
AJR:198, January 2012 53
Downloaded from www.ajronline.org by 54.210.20.124 on 10/29/15 from IP address 54.210.20.124. Copyright ARRS. For personal use only; all rights reserved
Allmendinger et al. tocols image select slices through the level of the basal ganglia. This results in exclusion of a large volume of brain parenchyma including the posterior fossa and brainstem. Infarcts within the superior cerebral hemispheres may also be excluded from the imaging volume (Fig. 7). Obtaining an accurate clinical history is critical to directing imaging protocol and slice selection. Most recently, whole-brain imaging using 256-MDCT scanners has shown promise in resolving this pitfall without substantial increases in radiation dose [16]. Microvascular Disease and Small Infarcts White matter changes are frequently encountered on CT in elderly patients with cerebrovascular occlusive disease. These changes are thought to be related to microvascular ischemia and can be distinguished from acute infarctions because they do not involve the gray matter or follow vascular territories. Reductions in CBF to brain parenchyma affected by white matter disease have been shown using a variety of modalities including PET [17], MRI [18], and recently perfusion CT [12] (Fig. 8). Careful attention must be paid to the unenhanced CT findings because chronic white matter changes may be mistaken for acute infarction if they are severe and asymmetric. Small infarcts are another potential source of pitfalls in perfusion CT interpretation. Small infarcts occurring in the deep gray matter and central white matter tracks can be symptomatic, leading to substantial neurologic deficits. A limitation of perfusion CT is that the calculated maps have a relatively low resolution and these small infarcts may be missed (Fig. 9). Arterial Vascular Stenosis Extracranial carotid stenosis, intracranial carotid stenosis, or stenosis of any of the proximal cerebral arteries may lead to hypoperfusion in the cerebral hemisphere supplied by these vessels [15, 19]. Therefore, perfusion asymmetry is present on perfusion CT maps that may be difficult to distinguish from acute ischemia. The most consistent and reproducible perfusion CT finding in the setting of extracranial carotid stenosis is MTT prolongation [15, 20] (Fig. 10). Poststenotic regions may also overestimate the region of ischemic penumbra in the setting of acute ischemia. The corresponding CBF and CBV maps show variable changes. This pitfall stresses the importance of performing concurrent CTA to evaluate for regions of vascular stenosis.
54
Seizure Mimicking Stroke In the setting of seizures, perfusion CT maps may show hyperperfusion in the ictal regions suggesting ischemia in the contralateral hemisphere (Fig. 11). Clinically, this finding may lead to a diagnostic dilemma because both postictal paralysis and status epilepticus can mimic acute stroke. Seizures may also be the initial presentation of an acute stroke, further complicating perfusion CT interpretation. Although perfusion CT in the setting of seizures has not been studied in detail [21], seizure activity should be considered a potential pitfall in perfusion CT. Vasospasm Vasospasm is another condition in which perfusion CT findings may mimic areas of penumbra in the setting of acute stroke. Severe vasospasm has been correlated with transient prolongation of MTT and with diminished CBF [22]. Prolongation of MTT in the setting of subarachnoid hemorrhage was associated with vasospasm and early mortality in animal models [23]. Additionally, perfusion CT has been used in humans to assess the therapeutic effect of both intraarterial vasodilators [24] and intravascular stent placement [25], with improved CBF and MTT after treatment. Perfusion abnormalities in the setting of vasospasm should be considered at-risk territories similar to what is seen in the ischemic penumbra. Summary Perfusion CT is increasingly being used in the setting of acute cerebral ischemia because it can be performed rapidly and is readily accessible. Common pitfalls include chronic infarct, vascular stenosis, chronic white matter changes, seizures, and vasospasm—all of which can be mistaken for acute ischemia. Vascular stenosis can mimic and overestimate areas of ischemic penumbra; therefore, perfusion CT should always be performed and interpreted in conjunction with CTA. Care must also be taken to avoid technical pitfalls in slice selection and postprocessing selection of ROIs. Perfusion CT pitfalls can be avoided as the interpreter becomes familiar with their appearance and knowledgeable of the potential technical and physiologic causes. References 1. Rai AT, Carpenter JS, Peykanu JA, Popovich T, Hobbs GR, Riggs JE. The role of CT perfusion imaging in acute stoke diagnosis: a large sin-
gle-center experience. J Emerg Med 2008; 35:287–292 2. Srinivasan A, Goyal M, Al Azri F, Lum C. State of the art imaging of acute stroke. RadioGraphics 2006; 26(suppl 1):S75–S95 3. [No authors listed]. Tissue plasminogen activator for acute ischemic stroke: the National Institute of Neurological Disorders and Stroke rt-PA Stroke Study Group. N Engl J Med 1995; 333:1581–1587 4. Dzialowski I, Hill MD, Coutts SB, et al. Extent of early ischemic changes on computed tomography (CT) before thrombolysis: prognostic value of the Alberta Stroke Program Early CT Score in ECASS II. Stroke 2006; 37:973–978 5. Furlan A, Higashida R, Wechsler L, et al. Intraarterial prourokinase for acute ischemic stroke: the PROACT II study—a randomized controlled trial. Prolyse in Acute Cerebral Thromboembolism. JAMA 1999; 282:2003–2011 6. Schramm P, Schellinger PD, Klotz E, et al. Comparison of perfusion computed tomography and computed tomography angiography source images with perfusion-weighted imaging and diffusion-weighted imaging in patients with acute stroke of less than 6 hours’ duration. Stroke 2004; 35:1652–1658 7. Silvennoinen HM, Hamberg LM, Lindsberg PJ, Valanne L, Hunter GJ. CT perfusion identifies increased salvage of tissue in patients receiving intravenous recombinant tissue plasminogen activator within 3 hours of stroke onset. Am J Neuroradiol 2008; 29:1118–1123 8. Wintermark M, Meuli R, Browaeys P, et al. Comparison of CT perfusion and angiography and MRI in selecting stroke patients for acute treatment. Neurology 2007; 68:694–697 9. Hellier KD, Hampton JL, Guadango JV, et al. Perfusion CT helps decision making for thrombolysis when there is no clear time of onset. J Neurol Neurosurg Psychiatry 2006; 77:417–419 10. Hopyan J, Ciarallo A, Dowlatshahi D, et al. Certainty of stroke diagnosis: incremental benefit with CT perfusion over noncontrast CT and CT angiography. Radiology 2010; 255:142–153 11. Rostrup E, Knudsen GM, Law I, Holm S, Larsson HB, Paulson OB. The relationship between cerebral blood flow and volume in humans. Neuroimage 2005; 24:1–11 12. Heiss WD. Flow thresholds of functional and morphological damage of the brain tissue. Stroke 1983; 14:329–331 13. Chen A, Shyr MH, Chen TY, Lai HY, Lin CC, Yen PS. Dynamic CT perfusion imaging with acetazolamide challenge for evaluation of patients with unilateral cerebrovascular steno-occlusive disease. Am J Neuroradiol 2006; 27:1876–1881 14. Smith LM, Elkins JS, Dillon WP, Schaeffer S, Wintermark M. Perfusion-CT assessment of the
AJR:198, January 2012
Downloaded from www.ajronline.org by 54.210.20.124 on 10/29/15 from IP address 54.210.20.124. Copyright ARRS. For personal use only; all rights reserved
Perfusion CT of Stroke cerebrovascular reserve: a revisit to the acetazolamide challenges. J Neuroradiol 2008; 35:157–164 15. Waaijer A, van der Schaaf IC, Velthuis BK, et al. Reproducibility of quantitative CT brain perfusion measurements in patients with symptomatic unilateral carotid artery stenosis. Am J Neuroradiol 2007; 28:927–932 16. Murayama K, Katada K, Nakane M, et al. Wholebrain perfusion CT performed with a prototype 256-detector row CT system: initial experience. Radiology 2009; 250:202–211 17. Hatazawa J, Shimosegawa E, Satoh T, et al. Subcortical hypoperfusion associated with asymptomatic white matter lesions on magnetic resonance imaging. Stroke 1997; 28:1944–1947 18. O’Sullivan M, Lythgoe DJ, Pereira AC, et al. Patterns of cerebral blood flow reduction in patients
with ischemic leukoaraiosis. Neurology 2002; 59:321–326 19. Huang BY, Castillo M. Radiological reasoning: extracranial causes of unilateral decreased brain perfusion. AJR 2007; 189(suppl):S49–S54 20. Waaijer A, van Leeuwen MS, van Osch MJ, et al. Changes in cerebral perfusion after revascularization of symptomatic carotid artery stenosis: CT measurement. Radiology 2007; 245:541–548 21. Royter V, Paletz L, Waters MF. Stroke vs. status epilepticus: a case report utilizing CT perfusion. J Neurol Sci 2008; 266:174–176 22. Wintermark M, Dillon WP, Smith WS, et al. Visual grading system for vasospasm based on perfusion CT imaging: comparisons with conventional angiography and quantitative perfusion CT. Cerebrovasc Dis 2008; 26:163–170 23. Laslo AM, Eastwood JD, Pakkiri P, et al. CT
A
B
C
D
perfusion-derived mean transit time predicts early mortality and delayed vasospasm after experimental subarachnoid hemorrhage. Am J Neuroradiol 2008; 29:79–85 24. Nogueira RG, Lev MH, Roccatagliata L, et al. 2009 Intra-arterial nicardipine infusion improves CT perfusion-measured cerebral blood flow in patients with subarachnoid hemorrhage-induced vasospasm. Am J Neuroradiol 2009; 30:160–164 25. Majoie CB, van Boven LJ, van de Beek D, et al. Perfusion CT to evaluate the effect of transluminal angioplasty on cerebral perfusion in the treatment of vasospasm after subarachnoid hemorrhage. Neurocrit Care 2007; 6:40–44 26. Lui YW, Tang ER, Allmendinger AM, Spektor V. Evaluation of CT perfusion in the setting of cerebral ischemia: patterns and pitfalls. Am J Neuroradiol 2010; 31:1552–1563
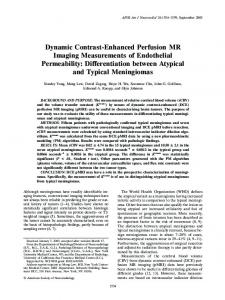
Fig. 1—Healthy 53-year-old man. A–D, Unenhanced CT scan (A) and perfusion CT maps showing cerebral blood flow (B), cerebral blood volume (C), and mean transit time (D) reveal normal symmetric brain perfusion. All color maps are coded red for higher values and blue for lower values.
AJR:198, January 2012 55
Downloaded from www.ajronline.org by 54.210.20.124 on 10/29/15 from IP address 54.210.20.124. Copyright ARRS. For personal use only; all rights reserved
Allmendinger et al.
A
B
C
Fig. 2—88-year-old woman who presented with acute-onset right facial droop and aphasia. A, Unenhanced CT scan shows no abnormal areas of perfusion to suggest acute infarction. B–D, Perfusion CT maps showing cerebral blood flow (B), cerebral blood volume (CBV) (C), and mean transit time (MTT) (D) depict large area of matched deficit on CBV and MTT maps (arrows) indicative of core infarct in left middle cerebral artery territory. All color maps are coded red for higher values and blue for lower values.
D
A
B
C
Fig. 3—51-year-old man who presented with right facial droop and acute aphasia. A, Unenhanced CT scan shows no evidence of acute infarction. B, Perfusion CT map showing cerebral blood flow reveals region of decreased perfusion within left middle cerebral artery (MCA) territory (arrows). All color maps are coded red for higher values and blue for lower values. C, Perfusion CT map showing cerebral blood volume shows relative symmetric maintenance of blood volume. Entire left MCA territory shown here represents area of ischemic penumbra. D, Perfusion CT map showing mean transit time reveals prolongation within same region (arrows) corresponding to region shown in B.
D 56
AJR:198, January 2012
Downloaded from www.ajronline.org by 54.210.20.124 on 10/29/15 from IP address 54.210.20.124. Copyright ARRS. For personal use only; all rights reserved
Perfusion CT of Stroke
A
B
C
D
E
F
G
H
Fig. 4—54-year-old woman who presented with 1-month history of dizziness and recent right-sided weakness. A, Unenhanced CT scan shows no evidence for acute ischemia. B, Axial maximum-intensity-projection image from CT angiography shows severe stenosis (arrow) of M1 segment of left middle cerebral artery (MCA). Note adjacent prominent collateral vessels. C–H, Perfusion CT maps show cerebral blood flow (CBF) before (C) and after (D) administration of acetazolamide, cerebral blood volume (CBV) before (E) and after (F) administration of acetazolamide, and mean transit time (MTT) before (G) and after (H) administration of acetazolamide. Technique and scaling of images are identical before and after acetazolamide administration. There is minimal increase in CBF and moderate global increase in CBV after acetazolamide administration. However, there is increased asymmetric perfusion between poststenotic territory (left) and nonstenotic territory (right). This asymmetry is best shown by MTT prolongation after acetazolamide administration in portions of left MCA territory relative to baseline perfusion CT scan. All color maps are coded red for higher values and blue for lower values.
AJR:198, January 2012 57
Downloaded from www.ajronline.org by 54.210.20.124 on 10/29/15 from IP address 54.210.20.124. Copyright ARRS. For personal use only; all rights reserved
Allmendinger et al.
A
B
C
Fig. 5—68-year-old man with right upper extremity weakness. (Reprinted with permission from [26]: Lui YW, Tang ER, Allmendinger AM, Spektor V. Evaluation of CT perfusion in the setting of cerebral ischemia: patterns and pitfalls. American Journal of Neuroradiology, volume 31, issue 9, pages 1552–1563, 2010 © by the American Society of Neuroradiology) A, Cerebral blood volume (CBV) map shows findings that mimic appearance of global hypoperfusion because of inappropriate venous region-of-interest (ROI) selection. All color maps are coded red for higher values and blue for lower values. B, Example of appropriate placement of arterial input function and venous outflow function ROIs is shown: in anterior cerebral artery (ACA) and superior sagittal sinus, respectively. C, CBV map corresponding to B shows normal perfusion.
Fig. 6—55-year-old woman who presented with left hemiparesis. Unenhanced CT (not shown) was normal. A, Perfusion CT source image shows poor contrast opacification in right anterior cerebral artery (ACA). A2 segment of ACA is commonly used for placement of arterial input function region of interest (ROI). In this case, this ROI was inadequate and resulted in nondiagnostic functional perfusion CT maps. B, Mean transit time map is shown as example.
Fig. 7—65-year-old man with right-sided weakness and aphasia. A, Unenhanced CT scan shows no evidence for acute stroke. (Fig. 7 continues on next page)
58
A
B
A
AJR:198, January 2012
Downloaded from www.ajronline.org by 54.210.20.124 on 10/29/15 from IP address 54.210.20.124. Copyright ARRS. For personal use only; all rights reserved
Perfusion CT of Stroke
B
C
D
Fig. 7 (continued)—65-year-old man with right-sided weakness and aphasia. B–D, Perfusion CT performed at admission shows symmetric and normal-appearing perfusion on cerebral blood flow (B), cerebral blood volume (C), and mean transit time (D) maps. All color maps are coded red for higher values and blue for lower values. E, Diffusion-weighted image obtained 12 hours after A–D shows multiple left periventricular infarcts outside volume imaged during perfusion CT.
E
A
Fig. 8—83-year-old man with change in mental status. A, Unenhanced CT scan shows left periatrial microvascular ischemic changes (arrows). (Fig. 8 continues on next page)
AJR:198, January 2012 59
Downloaded from www.ajronline.org by 54.210.20.124 on 10/29/15 from IP address 54.210.20.124. Copyright ARRS. For personal use only; all rights reserved
Allmendinger et al.
B
C
D
Fig. 8 (continued)—83-year-old man with change in mental status. B–D, Left periatrial microvascular ischemic changes shown in A correspond to perfusion abnormalities (arrows, B and C) on cerebral blood flow (B) and cerebral blood volume (C) maps and, to lesser extent, on mean transit time (MTT) map (P). This patient also had right internal carotid artery stenosis leading to prolongation of MTT. All color maps are coded for higher values and blue for lower values.
A
Fig. 9—58-year-old woman with left-sided weakness. A, Unenhanced CT scan shows normal findings. B–D, Maps show subtle, asymmetric diminished cerebral blood flow (B) and cerebral blood volume (C) and prolongation of mean transit time (D) in posterior limb of right internal capsule. These findings were not prospectively identified. All color maps are coded red for higher values and blue for lower values. E, Diffusion-weighted image obtained same day as A–D confirms small acute infarct in posterior limb of internal capsule. (Reprinted with permission from [26]: Lui YW, Tang ER, Allmendinger AM, Spektor V. Evaluation of CT perfusion in the setting of cerebral ischemia: patterns and pitfalls. American Journal of Neuroradiology, volume 31, issue 9, pages 1552–1563, 2010 © by the American Society of Neuroradiology)
60
B
C
D
E
AJR:198, January 2012
Downloaded from www.ajronline.org by 54.210.20.124 on 10/29/15 from IP address 54.210.20.124. Copyright ARRS. For personal use only; all rights reserved
Perfusion CT of Stroke
A
B
C
Fig. 10—83-year-old man with change in mental status (same patient as Fig. 8). Unenhanced CT (not shown) was normal. A, There is decreased cerebral blood flow in right middle cerebral artery and anterior cerebral artery territories (arrows). All color maps are coded red for higher values and blue for lower values. B, Cerebral blood volume appears relatively normal. C, Mean transit time is prolonged in right middle cerebral artery and anterior cerebral artery territories (arrows). D, CT angiogram reveals long segment of severe right internal carotid artery stenosis (arrow).
D
AJR:198, January 2012 61
Downloaded from www.ajronline.org by 54.210.20.124 on 10/29/15 from IP address 54.210.20.124. Copyright ARRS. For personal use only; all rights reserved
Allmendinger et al. Fig. 11—55-year-old man who presented with acute altered mental status, right facial droop, and right upper extremity weakness. These symptoms were preceded by witnessed generalized tonicclonic seizure. Initial unenhanced CT (not shown) was normal. (Reprinted with permission from [26]: Lui YW, Tang ER, Allmendinger AM, Spektor V. Evaluation of CT perfusion in the setting of cerebral ischemia: patterns and pitfalls. American Journal of Neuroradiology, volume 31, issue 9, pages 1552–1563, 2010 © by the American Society of Neuroradiology) A, Diffusion-weighted image shows normal findings. B, Cerebral blood volume map shows hypoperfusion in left hemisphere, mimicking core infarct. EEG and PET studies performed later showed right hemispheric seizure focus, which supports belief that postictal hyperperfusion is related to seizure rather than relative hypoperfusion related to left hemispheric infarct. Patient’s condition improved and his symptoms eventually resolved.
A
B
F O R YO U R I N F O R M AT I O N
This article is part of a self-assessment module (SAM). Please also refer to “Imaging of Stroke: Part 2, Pathophysiology at the Molecular and Cellular Levels and Corresponding Imaging Changes,” which can be found on page 63. Each SAM is composed of two journal articles along with questions, solutions, and references, which can be found online. You can access the two articles at www.ajronline.org, and the questions and solutions that comprise the Self-Assessment Module via http://www.arrs.org/Publications/AJR/index.aspx. The American Roentgen Ray Society is pleased to present these SAMs as part of its commitment to lifelong learning for radiologists. Continuing medical education (CME) and SAM credits are available in each issue of the AJR and are free to ARRS members. Not a member? Call 1-866-940-2777 (from the U.S. or Canada) or 703-729-3353 to speak to an ARRS membership specialist and begin enjoying the benefits of ARRS membership today!
62
AJR:198, January 2012