Immersive Environment Technologies for Planetary Exploration John Wright, Frank Hartman, Brian Cooper National Aeronautics and Space Administration(NASA) Jet Propulsion Laboratory(JPL) California Institute of Technology M/S 168-514 4800 Oak Grove Drive Pasadena, CA USA 91109-8099 FAX: (818) 393-6962, E-mail:
[email protected] ABSTRACT Immersive environments are successfully being used to support mission operations at the Jet Propulsion Laboratory. This technology contributed to the Mars Pathfinder Mission in planning sorties for the Sojourner rover. Results and operational experiences with these tools are being incorporated into the development of the second generation of mission planning tools. NASA's current plan includes two rovers being deployed to Mars in 2003 and early 2004. The next generation Rover Control Workstation utilizes existing technologies and more to provide a multimodal, collaborative, partially immersive environment. This system includes tools for planning long range sorties for highly autonomous rovers, tools for building the three-dimensional (3D) models of the terrain being explored, and advanced tools for visualizing telemetry from remote spacecraft and landers. These tools comprise a system for immersing the operator in the environment of another planet, body, or space to make the mission planning function more intuitive and effective.
Keywords: Immersive environments, Pathfinder, terrain modelling, visualization, Mars, Rover Control Workstation, JPL.
1.0 Introduction The application of immersive environments to mission operations within the Visualization and Earth Sciences Applications Group at the Jet Propulsion Lab began with the Sense of Active Presence (SOAP) task. The group has been involved in scientific data visualization for various missions and has produced a variety of wellknown animations including “L.A.: The Movie” with flights over the Los Angeles basin and San Andreas fault and “Mars: The Movie” with flights over the Candor Chasma area. Portions of “Mars” were used in the movie
“Total Recall” and the group has contributed several minutes of animation to a number of Imax films. The SOAP task was the first to apply the terrain modelling and animation techniques developed within the group in a rapid turnaround mode to support mission operations. During the Mars Pathfinder mission, tools developed within the SOAP task produced 3D models of the terrain around the lander for use in generating and reviewing operations sequences for the Sojourner rover. Current tasks within the group are extending the Rover Control Workstation (RCW) used during Pathfinder to incorporate 3D visualization in a more integrated manner. These tasks are building on systems described in their early stages in previous work [Wright] in which early research into immersive systems hardware and software were described. A new task is the System for Unifying Multiresolution Models and Integrating Threedimensional Terrains (SUMMITT) task which is integrating various subsystems into a more complete system for creating the 3D terrain models from orbiter, descent, lander, and rover imagery. These terrain models will be used to support the Mars '03 rover missions and landed operations. The Advanced Telemetry Visualization (ATV) task uses 3D visualization for reviewing mission operations through playback of telemetry returned from the craft and will also be used to support Mars '03. The RCW is being upgraded with more robust sortie planning and visualization tools. These include multimodal visualization tools offering a map view, a stereo view, and an immersive 3D view, as well as sortie rehearsal tools utilizing terrain models and mission playback from telemetry using ATV.
2.0 RCW Architecture Programming the rover to perform a sortie can be a laborious process as every possible obstacle must be analyzed and the safest route selected. Control-feedback loop turnaround times in minutes or hours preclude direct control of a rover in a man-in-the-loop configuration. The Mars '03 rovers will roam multiple kilometers from their landing sites. To support this capability, rovers will include onboard intelligence to perform a higher level of sortie planning, navigation, and obstacle avoidance than has been possible to date. This new paradigm of rover functionality will call for a new type of operator control, with much more interaction with the environment and less low-level control of rover operations. This new modality will utilize data visualization technology to provide a multi-dimensional "sense of presence" for operation and data analysis of teleoperated and semiautonomous vehicles. This will give the operator, or mission planner, the freedom to roam the vehicle's environment, thus providing a more intuitive and richer human/computer interface. The operator will be able to explore potential sites through the interface prior to committing the rover. Routes and destinations can be
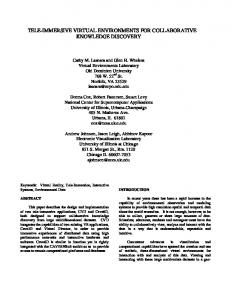
preexamined and designated through the interface. This adaptation of commercial technologies to the flight system environment will provide a more sophisticated and intuitive interface for human interaction with exploration vehicles and provide a better understanding of in-situ operations leading to better decision making. An additional benefit is the use of the immersive interface for analysis and interaction with the science data, both by researchers and by the educational community and the public. This task involves the development of an immersive environment for scientific data analysis and autonomous vehicle control, providing a sense of presence within the Internal Sensors
E xternal Sensors
Na vigation Algorithms
Guidance Control
Terrain Database ONBOARD SYSTEMS
EARTHBOUND SYST EMS Immersive Operator Station
Update Module
Visual Database
Figure 1: Rover Navigation System Block Diagram vehicle's environment. Figure 1 shows how the immersive operator station fits within the control loop of a typical autonomous exploration vehicle. Both the vehicle and the operator station begin with an initial database describing the terrain to be explored. This database will typically be created with descent imagery and lander panoramic data merged with previously available data from orbiters or Earth-based sensors. The operator will be immersed in a visual database, which may contain infrared data or information from other sensors but which will be presented to the operator visually. The operator explores the database, selecting interesting areas to explore and designating desired routes. The rover will receive this planning information, comparing potential routes with its terrain
database to identify hazards, and select a route. The vehicle will traverse the route, using alternative routes as appropriate to avoid previously unknown hazards, and transmit imagery and other data back to the ground station within operational constraints. As new data is received, the visual and material databases are updated, essentially filling in the coarse picture with highresolution information. Any part of the visual database may be explored at any time and multiple individuals may access the database at the same time. This allows researchers and educators access to data in parallel with the operators. The RCW deployed for the Pathfinder mission was based on two basic visualization tools, the Stereo View and the Flying Camera View as described in [Cooper]. These two basic modalities are continued in the updated version and combined with a Map View tool to provide the most important visualization functions of the in-situ environment. The Stereo View mode provides the most basic, raw look at the image data returned from the stereo imagers. The imagery is displayed using a stereo monitor with the individual stereo pairs arranged in position relative to the camera pointing when the images were captured. Use of stereo glasses provides the operator with a view of the data in its least processed form. Depth and other stereo cues allow the operator to get a fundamental feel for the environment. The minimal level of processing ensures that no artifacts have been added to the data and that no important features have been hidden. One problem with the Stereo View tool is that it is very difficult for a human to judge the separation of objects in the foreground and background so as to decide if the rover can fit between two rocks. The Flying Camera tool alleviates this problem by providing a means to examine the in-situ environment from any vantage point. The stereo imagery from the imagers is processed to generate a 3D model of the terrain in the immediate vicinity. This model is stored in a form that can be loaded and visualized with a high level of detail and interactive rendering rates. The camera can then be positioned to view possible routes and constrictions to verify that the rover can indeed traverse the planned route. The Flying Camera tool also supports visualization of a model of the rover that can be positioned anywhere within the environment to verify fit and feasibility. The Map View tool adds a natural, maplike visualization mode to the suite of tools in the RCW. Consisting primarily of descent imagery, the Map View tool displays the sortie planning area from above at various resolutions depending on the availability of data. It also provides natural access to georeferencing information and to navigation data such as landmark datasets, reference points, and direction. It is easy to lose direction in the Flying Camera tool but the Map View tool displays a compass indicating North when desired. Another
indicator points to a specified reference point, such as the lander, to make it easier to navigate samples back to a return vehicle, even when out of sight of the lander. Other features of the Map View tool include specification of hazard or protected regions and contour lines for analysis of slope. The other main component of the RCW for sortie planning is the Activity Editor which is essentially a text visualization tool for displaying the sequence of commands being produced. All four tools are integrated with a message passing executive which maintains a consistent view of the planned sequence among all the tools. Commands, such as traverse to waypoint, may be specified in any of the tools and the creation or editing of such a command is immediately reflected in the other tools. Additionally, multiple copies of each visualization tool may be launched by the same executive yet running on distributed systems to provide for a collaborative planning environment.
simultaneously and to be synchronized. This provides for collaborative sortie planning as the operators can activate displays for the Principal Investigators, even at remote sites, and collaboratively review planned activities. All of the primary sortie planning modules have been prototyped and integrated into the system. This includes the Executive, Activity Editor, MapView tool, StereoView tool, and Flying Camera tool. The ATV tool (described later) is to be integrated this year, as is the DARTS/DSHELL package which is a dynamic simulation package for the rover models. Figure 3 includes two views of the 3D terrain area around the Pathfinder lander. The image on the top shows a model of the lander and rover inserted in the terrain area with Yogi to the left side. The image on the bottom shows a view from above the lander looking toward Yogi which is just right of center.
Telemetry DARTS/ DSHELL
ATV
Activity Editor
Message Logger
Executive
Mapview
Stereo
Flying Camera
3D Data Repository
Figure 2 - RCW System Architecture To support this operational paradigm, a set of system requirements were developed. The basic set includes multimodality, partial immersion, and support for collaboration. To address these requirements, the RCW architecture was designed as a distributed system utilizing a message passing interface for synchronizing the subsystems. Figure 2 shows the basic system architecture. A central Executive is responsible for routing messages throughout the system. The message passing is achieved through use of the Parallel Virtual Machine (PVM) library from the University of Tennessee and Oak Ridge National Laboratory. Use of PVM allows each module to execute on any platform within the PVM network. This allows distributed operations, with specific tools running on platforms that best support that type of tool. In addition, the design of the Executive allows multiple copies of each tool to be run
Figure 3: Rendered views of Pathfinder landing area
3.0 Modelling Terrains The System for Unifying Multiresolution Models and Integrating Three-dimensional Terrains (SUMMITT) task has the goal of developing the underlying modelling technology for supporting missions involving rovers. Three-dimensional models of terrain areas are an invaluable asset in planning operations and in reviewing the predicted and telemetered operations of a robot arm. The SUMMITT task had the initial goal of supporting the Mars Volatiles and Climate Surveyor (MVACS) team during the Mars ‘98 mission, which unfortunately failed. The next Mars surface operations missions are the Mars '03 missions that plan to land two rovers. These missions expect to have orbital imagery from Mars Global Surveyor (MGS) and Mars '01, descent imagery from the lander, and lander imagery from a stereo imager similar to the Imager for Mars Pathfinder (IMP) used during the Pathfinder mission. These sources of imagery will be combined to create a multiresolution terrain model with very high resolution detail available within the immediate area of operations of the rover. Figure 3 gives an overall block diagram of the terrain modelling system. The three primary sources of data are orbiter imagery, descent imagery, and lander imagery. Each type of imagery is partially processed independently, then combined with data derived from the other imagery to create the multiresolution terrain models. Many of the processing steps described in the block diagram and in the following text have been developed as part of a variety of tasks within JPL. A key goal of this task is to identify the portions already developed and establish the necessary steps to integrate those technologies into the overall system. Georeferenced Image Database
Orbital Imagery
Descent Imagery
Lander Imagery
2.5D Mesh Voxel
Voxel Mesh 2.5D
Voxel Mesh 2.5D
Register
Register Transform
Transform
Merge
Merge
3D Terrian Model
Figure 3: Terrain Modelling System Block Diagram
The fundamental problem is the registration of the different terrain models generated independently from the different data sources. For essentially orthonormal views, such as orbital and descent imagery, simple image correlation works well and has been extensively utilized. The orbital data becomes the baseline 3D model and the descent data is used to enhance the baseline. However, processing the lander/rover imagery is more difficult. Two techniques were considered for performing this process and registering the models from the lander imagery to the baseline model. One technique is to reproject the models into an orthonormal view and then use two-dimensional methods to register the images to orbital and descent imagery. A difficulty is the inherent change in resolution across the orthonormalized image and research is needed to resolve this problem. An additional method which has been demonstrated and selected at JPL is 3D registration of the 3D models. Methods of registering polygonal surface models are being developed by the Robotic Vision group. These techniques use optimization techniques to match the 3D surface of the terrain model generated from the lander imagery to a similar 3D surface generated from the baseline model. The resulting match parameters are then used to correct the position and orientation information for the lander. A similar approach under development in the VESA group uses volumetric primitives (voxels) to represent the terrain to be matched. Voxels have some advantages over the polygonal surface matching methods in that it is easier to represent unknown volumes, such as regions occluded by rocks and hills, and easy to use, multiresolution data structures are available in which to combine the models once they are matched. These methods are still under development but have been proven to be effective. The images in figure 4 display the results of registering a baseline model, with coarse, large voxels, with a higher resolution terrain model generated from a low-level, oblique view. The view on the top shows the two models overlaid with an artificially induced error in the camera position. The view on the bottom shows the result of the registration process and the accuracy of the alignment. The registration uses an iterative closest points method based on the work of [Champleboux]. The voxels from the oblique view are colored red to facilitate distinguishing them from the baseline voxels but appear as darker in grayscale images herein. Note that the red/darker voxels are significantly smaller and more dense than those of the baseline model. The entire voxel model is stored in an octree structure which supports
multiresolution data and rapid access. Once a terrain model has been generated, it is typically converted to a polygon model for utilization by a visualization tool. Because the operator will be making planning decisions that require detailed local knowledge combined with general understanding of more distant terrain, the polygon models must be multiresolution also, or at least reflect the multiresolution nature of the underlying data samples. The multiresolution nature of the data precludes the use of a simple algorithm such as Marching Cubes [Lorensen,]. To extract the polygon model from the octree, a modified version of the Marching Triangles algorithm [Hilton], was developed. The modified version utilizes all the points in the model to generate a Delaunay triangulation in three-space. Figure 5 shows an example of a multiresolution model converted to a multiresolution triangle mesh, both shaded and wireframe. From the wireframe model it is easy to see that the oblique view of the hill was from the upper left as the small triangles are on that side of the peak. The preceding discussion of lander imagery is equally applicable to rover imagery. On Sojourner, the stereo imager was very small and no attempts have been made to generate 3D terrain models from its imagery. This was done exclusively with the IMP imagery. For Mars ‘03, the rovers are expected to carry IMP-like imagers to capture high-resolution stereo imagery of the terrains under exploration. In these cases there will likely be two modelling paradigms. In one, the rover will traverse to a new region, then stop and capture a panoramic image for creating a local model. Identification of landmarks previously noted by the lander and rover will be used to triangulate the rover’s position. If the area is completely new, terrain matching will be performed between the high resolution model, generated from the stereo imagery, and the baseline model. However, if the new region partially overlaps a previously explored region, then terrain matching techniques may be used to register the overlapping sections and thus identify the new position of the rover. In a more localized case, the rover may move to image a region occluded by a rock, such as Yogi, at the previous position. In this case, a large portion of the 3D models generated from each location will overlap, with only the occluded portion being different. Terrain matching will work well in this case to integrate the newly revealed and modelled area into the baseline model.
Figure 4 - Multiresolution Voxel Models Being Registered These techniques are currently used or are under development at JPL and are planned to be in place to support the upcoming Mars missions beginning with Mars ‘03.
However, it is still up to the operator to try to convert the telemetry reading into a specific problem and to mentally visualize the problem in the context of the spacecraft as a whole. This tool ties the telemetry to a detailed CAD model which can react to the telemetry in a predetermined way. For example, telemetry from the Sojourner rover can be replayed to illustrate rocker arm movements and wheel rotations. Fault conditions can cause the suspect region to change color, perhaps red if overheating or blue if too cold. The model provides immediate feedback on the part of the craft giving the fault which can speed up fault isolation and corrective response. The following represents a set of the key features of the ATV tool in the context of the Mars Pathfinder mission and the Sojourner rover: - display rover attitude based on accelerometer data - display rover articulation based on chassis sensors (bogeys, differential, and APXS deployment) - display rover position based on dead reckoning (X, Y, heading), and optional traverse trail - display highest hazard state using color-coding - camera controls: translate and rotate, zoom, jump to model playback controls: step forward/reverse, animate/interpolate at varying speed - display graphical plots of telemetry data for review - selection of telemetry channels for display to allow focus on specific activities Figure 5 - Multiresolution Polygon Model Produced From Registered Voxel Models
4.0 ADVANCED TELEMETRY VISUALIZATION The result of this task was the development of tools and technologies for advanced telemetry visualization through the use of higher-level graphics linked to telemetry parameters. Of primary interest is the use of detailed CAD models of the craft being monitored with links to telemetry events which will produce a response in the view of the model. These responses can range from nonalarm conditions such as wheel rotations or arm joint angles to alarm type indications with specific reactions such as parts changing color or flashing or exploding models to focus on the sensor giving the anomalous reading. This type of tool can aid greatly in visualizing the area which is suffering from an anomalous reading or in replaying the actions of the craft from a section of telemetry data. This tool will reduce the time, training, and experience necessary to successfully interpret telemetry from a spacecraft. Older tools were very manually intensive when it came to interpreting spacecraft telemetry. More recent tools, such as Cybergrid, are very effective at monitoring large numbers of telemetry items for health as it can identify values within and outside of nominal ranges in an easy to recognize manner.
These capabilities are layered on top of a higher-level rendering system capable of using more sophisticated, existing models. Open Inventor was chosen as the models are also compatible with Performer, a high performance rendering system, and VRML for distribution over the Web. Thus this system may be used to provide mission status visualizations to the public. The ATV system is intended to be a generic system which is configurable for any mission. The project provides an Open Inventor model of the spacecraft and a Telemetry Description File (TDF) specifying the relationship of telemetry channels to model responses. The visualization system loads this information, queries the telemetry data files, and provides visualization of spacecraft behavior. This provides a generic interface to allow adaptation of the system for multiple missions. These may be very sophisticated and have significant amounts of telemetered data.
5.0 CONCLUSION The Jet Propulsion Lab is moving forward with several efforts to develop enhanced immersive technologies for supporting mission operations. From the highly successful Mars Pathfinder mission through upcoming Mars missions launching in 2001, and 2003, immersive technologies and systems will aid the operations teams in
making mission critical decisions. Creating models of the operational environment and providing visualization tools to explore and interact with that environment are the key aspects being explored. Complete systems which take all the data available and use it to create an immersive environment, enable scientists to interact with the environment and establish science mission goals, collate science requests into mission operations sequences for uplink, rehearse expected activities within the environment, replay actual mission activities based on telemetry, and compare actual operations to predicted operations are on the horizon. Immersive technologies will continue to offer more capability to mission operations teams in the foreseeable future. This will be especially important as exploratory craft gain in autonomy and intelligence and begin to explore farther afield from their initial landing site. Operations will change from precisely specifying number of revolutions of each wheel to broadly defining goals and strategies. Such paradigms require a broader understanding of the environment to facilitate rapid decision making. While the level of immersion can vary from simple two-dimensional displays through stereo displays and virtual workbenches and on up to full immersion with head-mounted displays, haptic and tactile feedback, and intuitive manipulators, the main goal is to provide the operators with a better understanding of the operational environment.
REFERENCES Cooper, B. (1998) Driving on the Surface of Mars Using the Rover Control Workstation, Proceedings of SpaceOps ‘98, Tokyo, Japan, June, 1998. Champleboux, G., Lavallee, S., Szeliski, R., and Brunie, L., (1992) From Accurate Range Imaging Sensor Calibration to Accurate Model-Based 3-D Object Localization, Proceedings of IEEE CVPR '92, pp. 83-89, 1992. Ellis S.R. (1994). What are Virtual Environments? IEEE Computer Graphics and Applications. 17-22. Hilton, A., Stoddart, A.J., Illingworth, J., and Windeatt, T. (1996) Marching Triangles: Range Image Fusion for Complex Object Modelling. Proceedings of International Conference on Image Processing, 1996. Hughes, R.G. & Forrest, A.R. (1996). Perceptualisation Using a Tactile Mouse. IEEE Visualization '96 Proceedings Piscataway, NJ: IEEE. 181-188. Lorensen, W. and Cline, H. (1987) Marching Cubes: A High Resolution 3D Surface Construction Algorithm. Proceedings of SIGGRAPH '87, pp. 163-169, July 1987.
McKenna, M. & Zeltzer, D. (1992). Three Dimensional Visual Display Systems For Virtual Environments. Presence: Teleoperators and Virtual Environments. 1(4). Cambridge, MA: MIT Press. 421-458. Shimoga, K. B. (1993). A Survey of Perceptual Feedback Issues in Dexterous Telemanipulation. VRAIS '93: 1993 IEEE Virtual Reality Annual International Symposium. Piscataway, NJ: IEEE. 263-279. Stuart, R. (1996). The Design of Virtual Environments. New York McGraw Hill. Volbracht, S. (1996). An Experimental Comparison of 3D Display Modes. IEEE Visualization '96. Hot Topics. Piscataway, NJ: IEEE. 8-11. Wright, J., Hartman, F., and Cooper, B. (1998) Immersive Environments for Mission Operations: Beyond Mars Pathfinder, Proceedings of SpaceOps '98, Tokyo, Japan, 1998.