differential, and to minimize errors that arise from between-technician variation in sample preparation. Our .... tho Count Calibration Kit, Ortho Diagnostic Systems Inc.; .... Auto- mated software determinations of lymphocyte subsets were equivalent to those made by an expert using manual ..... Thus, we provide a unique tool.
Cytometry (Communications i n Clinical Cytometry) 22:48-59 ( 1 9 9 5 )
Immunologic Differentiation of Absolute Lymphocyte Count With an Integrated Flow Cytometric System: A New Concept for Absolute T Cell Subset Determinations Thomas J. Mercolino, Mark C. C o n n e l l y , Eric J. Meyer, Marilyn D. Knight, J o h n W. Parker, G r e g o r y T. Stelzer, and G i o a c c h i n o D e C h i r i c o Immunocytometry Systems Research and Development, Ortho Diagnostic Systems, Raritan, New Jersey (T.J.M..M.C.C., E.J.M., M.I>.K., G.D.); LJniversityof Southern California Flow Cytometry Clinical Laboratory, Los Angeles, California (J.W.P.); Cytometry Associates, Brentwood, Tennessee (G.T.S.)
We describe a method to obtain results for immune status monitoring that uses a three-test panel, comprised of isotype control and 2 specific Mab tests (CD4/CD8/CD3 and CD16/CD19/CD3), in conjunction with a flow cytometer that directly measures absolute counts. Automated software is used for lineagespecific gating of three-color immunofluorescence to determine lymphocyte and lymphocyte subset counts. The autogating function of this software is shown to yield equivalent results to manual analysis by an expert user, and to be effective when as few as 25 target cells are present. The software is also shown to perform automatic quality control checks of the sample preparation, reagent, and automated analysis. We demonstrate that the sum of T (CD3 + ), B (CD19 ), and natural killer (NK, CD16 CD3-) cells, as a determination of all lymphocytes, correlates well with lymphocytes measured using a light scatter differential. Moreover, T B NK lymphocyte count is shown to be less error-prone than lymphocyte count from light scatter differential, and to minimize errors that arise from between-technician variation in sample preparation. Our data suggest that the new approach that we describe could offer an alternative to the traditional two-stage methods for measuring absolute counts of lymphocyte subsets for immune status monitoring. As such this method could reduce, through objective automated analysis, testing cost and complexity, without sacrificing the quality of results. Q 1995 Wiley-Liss, Inc.
+
+
+ +
Key terms: lymphocyte count, immune status monitoring, T cell subset determination
Immunofluorescence analysis by flow cytometry is used widely as part of the ldboratory determination of absolute T cell subset counts. CD4 T cell count and the CD4 T cell percent of lymphocytes remain the laboratory measurements of choice for monitoring disease progression, and for timing therapy in human immunodeficiency virus (HIV) infected individuals (5). These measurements have other clinical applications, including transplantation monitoring ( 2 5 ) , and diagnosis of immunodeficiencies. both primary and secondary ( 2 9 ) . Two of the most significant problems that have been encountered in absolute T cell subset determinations are intrinsic to the most widely used methods. First, in a typical flow cytometric analysis, light scatter parameters, which measure aspects of cellular morphology, are used as the primary means to identify lymphocytes. Since the ability to differentiate cell types solely on the basis of light scatter is limited, and interferences are well known, strategies have been developed to validate that light scat-
+
6 1995 Wiley-Liss, Inc.
+
ter gates acceptably identify lymphocytes (16). The second, and perhaps more serious, problem is that many flow cytometers d o not measure the volume of sample that is analyzed. This necessitates that automated hematology instruments be used to provide a total white blood cell count (WBC) and differential to obtain the absolute number of lymphocytes per unit volume. However, since all hematology instruments d o not use the same technology for these measurements, they may be a major source of variability in assays of the CD4 count (2, 21).
Received for publication May 4, 1994; accepted October 1 1 , 1 9 9 4 . Address reprint requests to Thomas J. Mercolino, Ph.D., Ortho Diagnostic Systems, Mailstop K-6, 1001 US Highway 2 0 2 , Raritan NJ 08869-0606. Gioacchino DeChirico's current address is lmmucor Italia, Via Sporting Mirasole, N. 4 , 20090 Noverasco di Opera, Milan, Italy.
A NEW CONCEPT FOR CELL SUBSET DETERMINATIONS
The ORTHO CytoronAbsolute is unique among commercially available flow cytometers in that it delivers precise volumetric aliquots of samples for analysis. The volumetric delivery may be calibrated such that accurate and precise absolute cell subset determinations may be made with this single platform (7). Moreover, the calibration method yields standardized determinations at geographically distinct sites. Thus, the design of the CytoronAbsolute could address limitations of the more commonly used methods for determining absolute lymphocyte subsets. We have tested whether the limitations intrinsic to light-scatter based (morphological) determinations of lymphocytes may be overcome by using I ineage-specific monoclonal antibodies as the primary means of identifying relevant cell populations. We report here that a system of reagents and software, coupled with a flow cytometer calibrated to make volumetric determinations, may be used to automatically identify, quantitate, and quality control all lymphocyte subset determinations. These operations may be accomplished without operator attendance. Our results confirm the feasibility of a singleinstrument automated cell subset analysis, which may offer significant advantages when compared to the conventional two-stage procedure which uses hematology plus flow cytometry.
MATERIALS AND METHODS Samples Blood was collected at Ortho Diagnostic Systems (ODS, Raritan, NJ), from healthy donors, into three tubes containing ethylene diamine tetraacetic acid (EDTA, K3) as the anticoagulant (Becton Dickinson Vacutainer, Rutherford, NJ). Twenty-four different samples were obtained from 23 individuals, i.e., one of the donors was used for two samples. Samples were sent via overnight carrier to to each of two external sites, the University of Southern California (USC, in Los Angeles, CA.), and Cytometry Associates (Brentwood, TN). Donor samples that were retained at ODS were stored overnight at room temperature, then processed and run at approximately the same time as at the other study sites.
Monoclonal Antibodies for lymphocyte and Subset Identification The following reagent specificities and conjugated fluorochromes define the Ortho Trio panel (OTP): Trio Isotypic Control IgG 1 and IgG2a-Fluorescein isothiocyanate (FITC)/IgGl and IgG2a-Phycoerythrin (PE)/IgG2aCy5PE (CyP) (24), lot 93PD0173; Trio OKT4FITC/ OKT8PE/OKT3 CyP, lot 93PD0145; Trio CDlGFITC/ OKT19PE/OKT3CyP,lot 92PD0167. In order to compare ImmunoCount System results to standard two-color immunofluorescence, we used the following Ortho-Mune'" OK-Combo reagents: CD45FITC/CD14PE, lot 401; Isotypic Control IgG2aFITC/IgG2aPE, lot 402; OKT3FITCI OKT4PE, lot 403; OKT3FITC/OKT8PE, lot 403; and OKT3FITC/OKB19PE,lot 401.
49
Sample Processing All samples were prepared by a whole blood stain and erythrocyte lysis procedure. Samples were stained with OTP reagents (Ortho Diagnostic Systems) according to the manufacturer's directions. Briefly, the simplified procedure used for OTP reagents allowing direct determination of absolute subset counts in each tube was: (1) addition of 10 pl reagent to tube; (2) addition of 100 )*I whole blood; (3) incubate 20-30 min; (4) addition of 2 ml lysing reagent; (5) incubate 10-15 min. In contrast to the method recommended for the two-color OrthoMune Th' OK-Combo reagents, the OTP procedure contains no centrifugation or aspiration steps. To prepare samples with decreasing number of cells per unit volume, serial two-fold dilutions (to 1:16) of 4 normal blood specimens were prepared using phosphate buffered saline (PBS) as diluant. Aliquots of the undiluted and diluted specimens were stained according to the OTP procedure.
Absolute Count Calibration and Verification Using Microparticles Four microparticle suspensions were used to calibrate and verify the counting function of CytoronAbsolute (Ortho Count Calibration Kit, Ortho Diagnostic Systems Inc.; lot CK500). The calibrator suspension contains a known number of particles per unit volume; for the kit that we used the calibrator contained 7,428 particles/pL. The verifier suspensions consist of separate suspensions of low ( 1,641 particles/pL), medium (7,547 particles/pL), and high ( 12,794 particles/pL) microparticle counts. The kits were used according to the manufacturer's instructions. Briefly, the constant flow rate was calibrated from the known number of particles per unit volume in one suspension (the calibrator); then, the counts in the other three suspensions (verifiers) were determined as unknowns to verify the calibration and counting linearity.
Daily Instrument Setup and QC A daily quality control protocol was designed to monitor Ortho CytoronAbsolute performance. On each day that samples were processed, each site determined the number of particles/pL from Ortho Count verifier bead suspensions as unknowns; this ensured fluidics performance. After photomultiplier tube gains and and color compensation were set manually, using a normal donor sample stained with OTP reagents, these settings required no modification through the course of the study. However, to monitor the green and orange fluorescence detectors, each site also ran fluorescent microparticles conjugated with FITC and PE (QC3 Beads, Flow Cytometry Standards, Inc., Research Triangle Park, NC; Lot 930510). The red fluorescence detector was monitored using nonfluorescent microbeads (Simply Cellular Beads, Flow Cytometry Standards, Inc.) stained with the same OKT3-CyP that had been formulated into the OTP reagents.
50
MERCOLINO ET AL.
Data Collection, Analysis, and Reporting All flow cytometric data were collected as flow cytometry standard (FCS) listmode files using Ortho ImmunoCount Software running on an 1BM'"-compatible 486/ DX66 equipped with an external optical disk. The optical disks were transferred to ODS for post-acquisition analysis of the FCS files with the same version of software. All data were analyzed using automated Ortho ImmunoCount Software. For comparison and verification of automated analysis, we analyzed, from six randomly selected samples, a subset of files in parallel with WinList'" listmode analysis software (Verity, Portland, ME). An experienced user manually set gates to determine CD3 , CD19 , and CDl6 cells, and all lymphocytes by light scatter using the methods that are automated within Ortho ImmunoCount Software (20).
+
+
+
RESULTS Details of the Ortho ImmunoCount Software analysis algorithm for OTP reagents are given elsewhere (20). However, the general concepts which define this algorithm are as follows: Data acquisition and analysis on the ImmunoCount System are controlled within reagent-specific ( i t . , tube-specific) protocols. Each protocol contains information relevant to antibody specificity, their fluorochrome conjugates, and proper instrument setup parameters. Additionally each protocol contains the criteria required for automatic analysis of the tube, such as the parameters required to set logical gates that assign events to T, B, NK, CD3 CD4 , CD3 CD8 , or other cell populations. Protocols, in turn, may be linked together into panels. Panel specific properties define the operations performed, including all mathematical calculations of results, as well as the reporting structures associated with the reagent panel. In the ImmunoCount data acquisitiodanalysis scheme for OTP, an absolute total lymphocyte count is determined from FWD-SC vs. RT-SC (LS lymphocyte count), and fluorescent background levels are determined from the isotype control tube. From the CD4/CD8/CD3tube, a second replicate LS lymphocyte count is made. In parallel, T-cell count are measured by "T-gate" ( 17) and from the LS gate. The T-gated events are used for CD4 and CD8 count determinations. In the CDlb/CD19/CD3 test, a third LS lymphocyte count and replicates of the T-cell counts, as described for the previous tube, are determined. CD19+ (B cell) absolute counts and CD16-t CD3-NK cells are also determined in this third tube of the panel. The software calculates the sum of T (CD3 ), B (CD19 ), and NK (CD16 CD3-) cells as an immunologic determination lymphocytes (Immunologic Sum, or IS lymphocyte count). Figure 1 shows the logical gating strategy that is used for these determinations. Additionally, the software calculates results derived from data collected across tubes, the utility of which is described below. In order to verify that the automatic gates set within ORTHO ImmunoCount software identified the same cells as would be identified by an expert who used a manual
+
+
+
+
+
+
+
gating methods, WinList software (Verity) was used to analyze list mode files generated from six normal donor specimens labelled with OTP reagents. The same FCS files were then analyzed using automated ORTHO Immunocount software. In both the manual and automatic analyses, lymphocytes were determined by forward and right-angle light scatter gates. By analogy to, and in extension of, the technique for ''T gating" described by Mandy et al. (17), T, B, and NK lymphocytes were enumerated in both methods on the basis of CD3 , CDl9 , and CD16 CD3- expression, respectively, vs. right-angle light scatter (RT-SC). Results of automatic vs. manually determined counts are plotted in Figure 2. Automated software determinations of lymphocyte subsets were equivalent to those made by an expert using manual light scatter gates. The sensitivity of the software autogating algorithm was measured by its ability to gate clusters comprised of low cell number. We assessed sensitivity by staining and analyzing aliquots from normal samples that had been serially diluted with phosphate buffered saline (PBS). T lymphocytes were autogated as described above, then these gated events were analyzed for CD4 or CD8 expression with the automatic cursor positioning algorithm found in ImmunoCount software (20). B cells and NK cells were automatically determined, as described in Figure 1. Table 1 shows the results of CD4+ T cell counts, CD8+ T cell counts, and the sum of T (CD3+), B ( C D l 9 + ) , and NK (CD16+CD3-) cells, each determined in duplicate from 4 donor samples. These data demonstrated that the software autogated reliably, even when there were only 25 cells per cluster, or less. Table
+
+
+
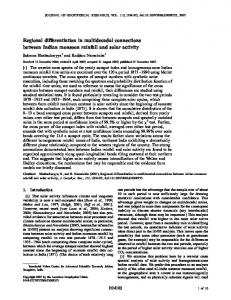
FIG.1. A: Analysis of the isotype control. A software-driven logical gate (autogate) "A" is determined for the lymphocyte population, and an absolute lymphocyte count by LS is determined (graph 1). The green (FL1) and orange (FL2) fluorescent background distributions for the lymphocyte gate are plotted on a green vs. orange fluorescence cytogram (graph 21, and quadrant statistical region markers are automatically set on the cytogram to define positive and negative staining regions. The non-specific fluorescent background counts are measured in search regions which correspond to those used in the analysis of tubes containing specific antibodies (graphs 3,4, and 5). On the red (FL3) fluorescence histogram, a region marker is automatically set to define the positive staining threshold (graph 6). These marker settings and values are used in analysis of subsequent tubes in OTP. B: Analysis of the T cell subset determination tube. Typically, the CD4/CD8/CD3 stained sample is run and analyzed next. In the CD4iCD8iCD3 protocol, as in the Control protocol, an LS lymphocyte count LS determined from autogate "A" (graph 1). An autogate "B" is set around the CD3' events to obtain the absolute T-cell count (graph 2). These gated events are plotted in a green vs. orange (CD4 vs. CD8) fluorescence (graph 3) for absolute Cd4 and CD8 count determinations. For quality control purposes, the LS gated lymphocyte events are analyzed in a red (CD3) fluorescence histogram (graph 4) to obtain a CD3 count by a second method within this same tube. C: Analysis of the NKiBiT tube. In the CD16ICD19ICD3 test, a third LS lymphocyte count is determined (graph 1 , autogate "A"). Replicate T-cell counts are made by two methods, as described for B (graphs 2 and 6). Additionally, however, the CD3 cells, autogated from "B," graph 2, are plotted on green vs. orange (CD16 vs. CD19) fluorescence (graph 3), in order to measure CD3+CD16+ count. The absolute CD16' and CD19' (B cell) absolute counts are determined using appropriate immunofluorescence vs. RT-SC autogates (graphs 4 and 5, respectively). The CD3+CD16+ events are subtracted from the absolute CD16 total count to yield CD16+CD3- NK cells.
ORTHO TRIO CONTROL Graph 1
FW-SC
Graph 3
Control GR-FL
Control RD-FL
RT-SC
Graph 2, Gate A Dest
Control OR-FL
RT-SC
RT-SC
Gmph 4
Grsoh 6. GaL A Desl
'1
Counb
OR-FL
I
ContmU RU-FL
A
Control/ GR-FL
ORTHO TRIO CD4/CDS/CD3 Graph 3, Gate B Dest
6wph 1
FW-SC
CD8 OR-FL
RT-SC
C D 4 GR-FL
Gcvoh 2
Graph 4, Gale A D-1.
C0""t.S
T-l
,1L CD3/ RD-FL
B
RT-SC
ORTHO TRIO CDl6/CDl9/CD3 Graph 3, Gale B Dest
6raph 1
CD19 OR-FL
EW-SC
CD191 OR-FL
RT-SC
CDIU GR-FI
RT-SC
Graph 2
6mph 4
Graph 6, Gate A Dul
CD16 GR-FL
CD3 RD-FL
C
Graph 5
RT-SC
Counts
RT-SC
FIG 1
L CD3l RD-FL
52
MERCOLINO ET A t
3000
1
2500
-~
2000
--
@*%
n
w
2 83
6
L5 1500
--
4.
1000 --
0
500
1500
1000
2000
2500
3000
MANUAL GATING IN WJNLIST FIG. 2. Autogating by ImmunoCount software compared to manual analysis. Counts of total lymphocytes, determined from FW-SC and RT-SC, and C D 3 + , CD16+, and CD19+ lymphocytes were gated automatically by Ortho ImmunoCount software. From the corresponding FCS listmode files an experienced user gated these cell populations.
1 also shows the precision of determinations from samples prepared in duplicate. The accuracy of the autoanalysis was determined by comparing the observed cell counts to those that are expected, as calculated from the mean of the two determinations of the undiluted sample times the dilution factor. When data in the table were pooled across all 4 samples, linear regression analysis of observed vs. expected counts yielded: a slope 1.00 ? 0.01, an intercept of 19 f 5, and a correlation coefficient of 1.00 for CD3 C D 4 counts; a slope 0.99 +- 0.02, an intercept of 12 f 4, and a correlation coefficient of 0.99 for CD3+CDS+ counts; and, a slope 1.00 ? 0.01, an intercept of 28 ? 10, and a correlation coefficient of 1.00 for the IS lymphocyte counts. We sought to determine whether the IS lymphocyte count can be used as an immunologic determination of all lymphocytes. Twenty-four normal donor specimens were shipped to three sites, where each sample was stained with the OTP reagent panel in duplicate. The IS lymphocyte count was calculated within ImmunoCount software, and compared to a light scatter based lymphocyte count made on a calibrated CytoronAbsolute, a measure shown to compare to lymphocyte counts derived from automated hematology analyzers ( 7 ) . Regression analysis of IS lymphocyte count vs. the mean of the three total lymphocyte counts determined from forward angle light scatter (FWD-SC) vs. RT-SC (LS lymphocyte count) yielded a slope of 0.84 ? 0.04, an intercept of 213 C 67, and a correlation coefficient of 0.86. These data are shown in Figure 3 , which also shows that “outlier” points occurred in this comparison.
+
+
Since three replicate determinations for LS lymphocytes were made within a subject panel, we hypothesized that quality control (QC) information may be deduced from the precision with which this absolute lymphocyte count is determined by LS. To test this, we calculated the range, expressed as a percentage of the mean from LS lymphocyte counts measured in the three tubes of the OTP; then, to automatically identify outlier data points, we set an arbitrary criterion as any replicate determination differing from the mean by more than k 10%.Figure 3 shows that all of the outlier points were identified in this way. When the outlier points are excluded from the calculation, the correlation between the two methods improved (slope of 0.94 ? 0.01, intercept = 19, and correlation coefficient = 0.99). This strongly suggests that IS lymphocyte counts, based upon cell lineage specific markers, were more reliable than the LS lymphocyte count. We tested whether we could extend the internal QC to yield a means whereby any failure of the autoanalysis would be detected automatically. Table 2 shows the replicate measurements that are made with the OTP method. Since measurements are made as direct absolute counts, the results from each tube for a given subject could be compared or combined with others from the same test panel, as shown in Table 2 . Thus, the QC checks could be calculated within the software algorithm, and flagged levels could be reported. Data from 84 samples were analyzed in this part of our testing. Of these, 44 passed all QC criteria. An expert analyst visually inspected each autogate that had been set in these tests and determined that
53
A NEW CONCEPT FOR CELL SUBSET DETERMINATIONS
Table 1 Autoanalysis of Diluted Samples"
CD3 + CD4 + Donor
1
2
+
Dilution
EXP
Obs 1
Obs 2
Exp
CD3 C D 8 Obs 1
1.oo 0.50 0.25 0.13 0.06 1.00 0.50 0.25 0.13 0.06 1.00 0.50 0.25 0.13 0.06 1.00 0.50 0.25 0.13 0.06
1,433 716 358 179 90 1,343 67 1 336 168 84 684 342 171 85 43 424 212 106 53 26
1,436 765 392 20 1 92 1,321 695 406 203 75 695 390 203 103 56 424 215 108 69 34
1,429 754 375 179 87 1,364 743 350 173 109 672 399 224 88 40 423 23 1 125 65 34
333 167 83 42 21 59 1 295 148 74 37 468 234 117 59 29 299 150 75 37 19
34 1 220 86 49 24 558 325 148 93 35 502 275 145 58 28 300 158 85 32 23
+
IS lymphocyte count Obs 2 Obs 1
Obs 2
EXP
325 198 105 54 28 623 316 151 88 44 434 267 122 59 27 298 177 95 51 31
2,350 1,175 588 294 147 3,011 1,505 7 53 376 188 1,584 792 396 198 99 1,087 543 272 136 68
2,427 1,276 62 1 305 134 3,022 1,640 854 40 1 198 1,669 890 466 203 117 1,071 559 305 147 64
2,274 1,226 604 327 148 3,000 1,580 751 398 199 1,499 849 472 216 107 1,103 576 318 157 83
"Exp = expected value, calculated from the mean of determinations made on the undiluted sample X dilution factor; O b s l = observation 1; Obs 2 = observation 2.
4000
3500
z
P
3000
8 2500
1 T
00
I
o ! 0
H 0
,
,
500
1000
1500
I
,
I
,
1
1
1
2000
2500
3000
3500
4000
4500
5000
MEAN LS LYMPHOCYTE COUNT FIG.3. Comparison of IS to LS lymphocyte count. IS lymphocyte count is plotted vs. LS lymphocyte count for all data points (0). The latter parameter comes from the mean of three replicate determinations from corresponding samples. Overlaid (m) are only points for which no LS lymphocyte QC "flag" was detected (see text).
in none were the gates set inappropriately. For the 40 remaining samples failure occurred in one or more criteria, as shown in Table 3. Cytogram output from these tests was similarly inspected by an experienced analyst. In five samples, LS was the only flag detected, LS range was 11% (vs. 10% cut-off), yet all autogates appeared appropriately set. For the remaining samples where LS
only, or LS and CD3 were the only flags set, staining and autoanalysis appeared acceptable. In 9 samples where one of the CD3 flags only was detected, staining and autoanalysis appeared acceptable, and this flag was not exceeded by more than 4% from the arbitrary cut-off. For these 20 samples, an expert determined that reanalysis was not required in order to improve the quality of re-
54
MERCOLINO ET AL
Table 2 Summary of Measurements in 3-Tube Ortho Trio Panela I
CONTROL Tube
CD4/CDS/CD3 Tube
NK/B/T Tube
aWhere comparisons are made by ImmunoCount software between replicates made in different tubes by the same method, a horizontal border is shown: A = calculated range of LS lymphocytes compared to mean; B = between tube comparison of CD3 determination, by two methods. Between-method comparisons made by ImmunoCount software are represented by the vertical bars: C = lymphocytes by light scatter compared to the sum of T + B+NK cells (IS lymphocyte count, shaded area, NKiBiT tube); D = T cells determined by T-gate compared to T cells determined from LS gate; and, E = total T cells compared to sum of CD4+ and CD8+ T cells (shaded area, CD4iCD8iCD3 tube).
sults. To measure the objectivity of this assessment, we reanalyzed the list mode from these 20 samples, and the qualitative assessment was confirmed in all cases (data not shown). Likewise, all of the remaining 20 samples were manually reanalyzed from the listmode data. Six samples failed to give a reportable result after manual reanalysis; in all six, the WLS flag was detected, alone or in combination with other flags. Thus, the internal QC had sufficient sensitivity to detect every instance of failure of the autoanalysis, and IS/LS may be the most informative flag to detect when data are of insufficient quality to be reportable. When autoanalysis ‘‘pass’’and manual reanalysis “pass” samples are considered together, there were 93% “reportable” results, where reportable means no qualifier needs to be given. Further evidence of the advantage of IS lymphocyte counting over LS-based differentials is given in Figure 4 . Two technicians prepared OTP samples from the same 1 0 normal donor samples. T cell subsets were determined as a fraction of the mean LS lymphocyte count, or as a fraction of IS lymphocyte count. The between-technician variation was lower when matched determinations were compared from IS lymphocyte count. Since all analysis was performed with objective, automatic gating, this result is especially significant (i.e., variation does not come
from subjective differences in gate settings between individuals).
DISCUSSION We have developed a method that uses lineage-specific gating and three-color immunofluorescence to determine lymphocyte counts. A summary of the reportable results generated from ImmunoCount software with OTP reagents is given in Table 4. We have demonstrated that this method is less error-prone than identifying lymphocytes based primarily upon their light scatter. Further, we have shown that the utility of cell lineage-specific IS lymphocyte differentials may be enhanced through the automatic gating capability of commercially available software. Automated software analysis of three-color immunophenotyping reagents extracted substantial, objective, quality control information that improved the reliability of reported results. Recently, CDC (5) has published recommendations for the flow cytometric analysis of lymphocyte subsets in HIV individuals. The recommendation made therein suggests that to optimally enumerate the CD4 lymphocyte population, a six-tube panel of two-color immunofluoresence reagents should be used. The OTP reagent configuration, using three-color reagents, is designed to
+
+
A NEW CONCEPT FOR CELL SUBSET DETERMINATIONS
Table 3 Results From Autoanalvsis QC From 84 SamDles Type of flags detected” C, only C and A C, A, and (B, D, or E) All C A, only (B,D, or El, only A, and (B, D, or E) All, no C
Number of samples 3 3 2 8 5 21 6 32
Percent of flagged samples requiring manual reanalysis (%) 100 100 100 100 0
57 0 38
”Acceptance criteria such that no flag detected: A, calculated range from 3 absolute lymphocyte counts by light scatter = t 10% of mean (LS flag); 6, calculated range of replicate CD3 determinations (between tubes) = 5% of mean (CD3 flag); C, IS lymphocyte count compared to mean LS lymphocyte count by light scatter = 95% to 100% (ISILS flag); D, difference between CD3 determined by two methods (within tube) = ? 5% (CD3 flag); E, sum of CD4 CD3 cells and CD8 + CD3 cells compared to total CD3+ count = 9 5 % to 100% (CD3 flag).
*
+
+
+
yield the equivalent information from three tubes per panel as is obtained in the six-tube panel. Further, OTP reagents are formulated to be used to obtain direct absolute cell subset counts on Ortho CytoronAbsolute, and a gating strategy designed to accurately identify lymphocytes and eliminate the need to account for non-lymphocyte elements (5). This eliminates the need for a separate measurement of absolute count, an additional test performed in the two-stage method (5). A comparison of the information obtained in these two approaches is shown in Table 5. By analogy and extension of the “lymphosum” concept proposed by Schenker et al. (23), a value was generated for the sum of the T-cells, B-cells, and NK-cells from the CD3+, CD19+, and CD16+CD3- lymphocyte counts, respectively. These measurements were made as direct absolute counts, and thus summed to a measurement of absolute lymphocyte count. To distinguish this approach from the lymphosum concept, we propose that this measurement be called the “ImmunoSum” lymphocyte count. We used ImmunoSum as the primary determination of total lymphocytes, and, therefore, as the denominator when calculating each subset’s frequency as a percentage of lymphocytes (see Table 4). These fractions correlated well with those determined with two-color reagents in a traditional sample preparation and data analysis scheme (data not shown). Since measurements were made as direct absolute counts, the results from each tube for a given subject could be compared or combined with others from the same test panel. Thus, a variety of cross-checks could be made between the replicate measurements that were made as a result of the OTP reagent analysis. These checks formed the basis of the internal QC on the autoanalysis. We have shown that internal QC had sufficient sensitivity to detect every instance (6/6) of failure of the
55
autoanalysis. Conversely, in a significant fraction of samples (20/84), internal QC flags were detected in samples for which no subjective or objective evidence exists for actual test failure. Thus, an optimization of the stringency of these flag cut-offs may improve QC specificity without adversely affecting its sensitivity. Differential discrimination of leukocyte subsets was historically based upon morphological differences between cell types (10). Monoclonal antibodies raised against antigens on leukocyte cell surfaces has revolutionized differentiation of functional cell subsets (reviewed in 26). Although the original methods used in flow cytometry were based upon “fluorescence activated” triggering, the standard for analysis of peripheral blood leukocyte subsets from whole blood relies primarily upon light scatter to trigger the flow cytometer measurement. Further, the CDC continues to recommend the possibility that light scatter parameters be used to identify lymphocytes, and that lymphocytes so identified may be used as the denominator in calculation of clinicallyrelevant, fractional subset reporting (5). Recognizing the limitations of lymphocyte differentials based upon cellular morphology (i.e., light scatter parameters) ( 12), immunologic validation of the lymphocyte gate with antibodies to CD45 and CD14 has become recommended practice (5,16). There are, however, significant limitations to the CD45/CD14 approach for lymphocyte gate validation. First, this method assumes that the relative number of cells bearing these markers remains the same in a fixed gate applied to data from multiple tubes. This assumption is not valid under many commonly occurring circumstances, such as when there is incomplete erythrocyte lysis in a tube other than the 45/14 “validation tube.” Further, unlike lineage-restricted markers, CD45 expression is not limited to lymphocytes (6). Rather, CD45 antigen density is found in a continuum across leukocytes. In order to discriminate lymphocytes within this continuum, subjective criteria of “bright” CD45 expression and failure to express CD14 has been used (16). However, up to 16% of monocytes have been shown to be CD14 negative (8).Down regulation of CD14 on monocytes can also occur as a result of exposure to interleukin-4 (22) and may be generally associated with their activation (30). Thus, the CD45KD14 validation method does not correct for Contamination of the lymphocyte gate by CD14 negative monocytes. In addition, basophils, which scatter light similarly to lymphocytes, must be discriminated solely by subjective assessment of their CD45 antigen density. A practical solution to many of these problems was proposed by Mandy and colleagues (17). They gated cells using heterogeneous parameters derived from RT-SC and anti-CD3 fluorescence, in a lineage-specific protocol. They showed that cells so identified were 100% CD45 bright lymphocytes, with 0% CD14 positive cell interference, and contain >99%of all CD3 positive T cells. Since the T gating protocol could be combined with an analysis of CD4 and CD8 expression on the T cells, they proposed that it could be adapted for the acquired
MERCOLINO ET AL.
56
80 90
T
+ +
+
'
+
+ +
+
+ +
+
+
+
+ + +
++
0'
0
00
!.:!
O
c
m
10
A0
0
-
10
20
30
40
70
60
50
80
90
Subset Percentage (Technician 1)
90 T
70
*
P
Y
10
1
t
0 1
0
+
+
G+ 0
.
8
. .
.
4
1
10
20
30
B
I
,
,
I
I
i
40
50
60
70
80
90
Subset Percentage (Technician 1)
FIG. 4. A: Between-technician variability: subsets expressed as fraction of LS lymphocytes. B: Between-technician variability: subsets expressed as fraction of IS lymphocytes. T cell subsets were determined from the same samples independently by two different technicians. Data
obtained by each technician are expressed as fraction of total lymphocytes using the mean LS lymphocyte count (A), or the IS lymphocyte count (B). = total CD3+ T cells; o = CD3+CD4+; rn = CD8+CD3 + ,
immunodeficiency syndrome (AIDS) immunophenotyping in the clinical laboratory. Another approach designed to circumvent the difficulties associated with LS-based T cell subset analysis, especially in HIV+ patient samples, has been proposed by Nicholson and colleagues (10). This method utilizes CD45 expression in conjunction with right angle light scatter to identify lymphocytes. They showed that they could achieve excellent correlation of CD4 percent of T cells, between the RT-SC/CD45 gate, from a simulta-
neous three-color, one tube assay (CD45/CD4/CD3), vs. the morphologic RT-SC/FWD-SCgate. Neither of these published schemes provide in formation about B cells, natural killer (NK) cells, and, in the latter method, CD8+ T cell frequency. Since in neither method are determinations made in replicate, quality control of results is difficult, and perhaps impossible, to obtain. Unlike those previously described, the method described here takes advantage of measurements made as
+
+
A NEW CONCEPT FOR CELL SUBSET DETERMINATIONS
Table 4 Summary of Results Reported by the lmmunocount System Absolute C D 4 + T-cell count Absolute CD8 T-cell count Absolute CD3+ T-cells Absolute CD19 B-cells Absolute CD16+CD3- NK-cells IS Lymphocyte count ( T + B NK) Mean LS lymphocyte count CD4+ T-cells as Yo of IS lymphocyte count CD8+ T-cells as Yo of IS lymphocyte count CD3 T-cells as % of IS lymphocyte count CD19+ B-cells as % of IS lymphocyte count CD16+CD3- NK-cells as % of IS lymphocyte count CD4/CD8 Ratio determination
+
+
+
+
direct absolute counts; since we may combine results originating from each of the tubes in the subject panel, duplicate or triplicate measurements obtained or measurements of the same parameter by more than one method can serve as the basis for rigorous internal quality control. Internal quality control results indicate whether automatic analysis of the data may require expert review, and helps to determine whether re-analysis of the data is warranted. Thus, we provide a unique tool to assist in the review of results obtained for the OTP used in the ImmunoCount system. Procedural errors, and even rare occurences of biologically based test failures ( 3 ) , may be automatically detected through our internal quality control procedure. The method incorporates the advantages of both the T gating and CD45 gating procedures. We extend these concepts to more specifically identify lymphocytes using cell lineage specific markers (IS lymphocyte count). We have shown the advantages of this parameter over LS lymphocyte, which is based upon morphologic parameters, alone, and widely used in traditional approaches. These advantages include a measurement which we have shown contains less intrinsic error, since the correlation between the the LS and IS methods improved when the QC-flagged points were identified by a criterion that detects variability solely in the LS measurement. This strongly suggests that measuring total lymphocyte counts and lymphocyte subset counts based upon cell lineage specific markers (IS lymphocyte count) are more reliable than results determined solely from light scatter base measurements (LS lymphocyte count), and validate IS as a gating strategy to determine lymphocytes. Our data also show that the automated gating and population assignment based upon immunologic identification of cells minimizes errors that arise from between-technician variation in sample preparation. The cell surface markers selected for analysis in the OTP are well documented to provide information necessary to quantitate all lymphocytes. CD3 is the invariant chain of the T antigen receptor, and its expression defines the T lymphocyte lineage. CDlC) is expressed early in the
57
maturation of B cells, and is strictly associated with normal lymphocytes that bear surface Ig, thus defining the B lymphocyte lineage (1,16). Utilization of a completely lineage restricted marker for NK cells is more problematic. Cell sorting experiments have demonstrated that CDl6 was not found on a small proportion of cells with NK activity (14). In that study, cells with the CD16CD56+ phenotype maximally represented only 5% of NK activity, with CD16+ cells accounting for the balance. Thus, in a case where NK cell frequency was high ( 2 0 % , for example), utilization of CDl6 alone as an NK marker would fail to detect only 1% of lymphocytes. This is within the small error of the determinations of the method described here. Further, CDl6 expression has been observed on monocytes ( 1,30). However, these authors found that CDl6 was acquired by monocytes as they matured to macrophage phenotype. Part of the phenotypic change was an increase in size ( l ) , which likely accounts for their exclusion by RT-SC in our method. Likewise, we observed that RT-SC effectively discriminates neutrophils, despite their high CDl6 expression. Importantly, basophils, which are among the most difficult cell of the myeloid lineage to discriminate from lymphocytes on the basis of light scatter, fail to express CDl6 (9,27). CD56, alone, has been suggested as sufficient to identify NK cells (5), and event the best single marker for NK cells (13). However, in HIV patient samples, an absolute increase in CDl6+ 56-3-cells has been observed at the same time total NK number is decreasing through disease progression (JV Giorgi, personal communication; 11). Moreover, the CD56 marker lacks fidelity to NK cells or even to hematopoietic tissue (4,15,28). Further, CD56 expression on T cells can be quite high, and the expression of this marker is more variable than CDl6 on lymphocytes from different individuals (our unpublished observations). CDl6 also has the practical advantage of staining lymphocytes in a well-defined cell cluster suitable for autogating. Ultimately, the appropriateness of CDl6 as a means to include essentially all NK cells is confirmed by our results, i.e., a detectably large number of lymphocytes do not appear to be excluded from IS lymphocyte count. We have combined the techniques discussed for del ineation of lymphocytes with a flow cytometer that makes accurate, cross-site-calibrated absolute counts (7). We overcame the problems associated with making a lymphocyte count with different conventional hematology analyzers. Robinson et al. showed that at low counts, different manufacturers’ hematology instruments may differ by as much as 40% in results reported for lymphocytes ( 2 1 ). In studies of cross site CD4 count assays, hematology instrumentation has been identified as the major source of variation when two-stage procedures are used (2). The design of the Ortho CytoronAbsolute allows subset counts to be measured directly. In this respect, it is unique among commercially available flow cytometers, and it eliminates the need for additional instrumentation to provide an absolute cell count.
+
MERCOLINO ET AL
58
Table 5 Trio Reagent Vs. Recommended 6-Tube PaneP 6-Tube panel 1. lsotypic control 2. CD3iCD4 3. CD3iCD8 4. CD3ICD19 5. CDYCD16 &/or CD56
Trio reagents 1. lsotypic control 2. CD4/CD8/CD3
3 . CD16ICD19ICD3
6. CD45iCD14
Results obtained Detection of nonspecific interactions Quantitation of CD4 + T cells (CD3 + CD4 Quantitation of CD8 T cells (CD3 C D 4 + ) Total lymphocytes (TRIO, only) Total T cells (CD3 + ) Total B cells (CD19+) Total NK cell (CD16+CD3-) Validate the lymphocyte gate
+
+
+
”(1,17)
We believe that the method described here is the first report of direct absolute cell subset determinations using simultaneous three-color, cell lineage specific fluorescent monoclonal antibody reagents and a flow cytometer calibrated to make volumetric determinations. The configuration of reagents reduces the number of tests required to achieve equivalent results to a recommended immune status monitoring panel (5). These reagents require minimal sample preparation, and no centrifugation or aspiration steps. The software that we have used for analysis is designed to identify relevant cell populations objectively and automatically. The software also performs automatic quality control checks of the sample preparation, reagent, and automated analysis. In addition, the system may be operated as fully walk-away with respect to sampling, data acquisition, analysis, and report generation. Specimens which require additional expert analysis are automatically identified, since the automatically generated subject reports include QC results, thereby minimizing expert intervention prior to reporting results. These automated features should combine to improve laboratory productivity. The current guidelines provided by the Centers for Disease Control, Atlanta (CDC) anticipate “alternative technologies” to traditional flow cytometry which reduce variability through one measurement of absolute count, and reduce cost in time and technical expertise (5). The method that we describe here satisfies these expectations of alternatives to flow cytometry without sacrificing flow cytometry’s advantages, and could be validated within individual clinical laboratories per that guideline. We believe that the best way to obtain a clinically relevant cell count is to count clinically relevant cells directly. To do this, we have capitalized upon multiparameter flow cytometry to provide results that may be reported with high confidence. We expect that the improvements embodied in this method could reduce testing complexity and lower costs yet fully maintain the quality of reported results. The automated, multi-color approach that we have described may be extended to other applications as well (19).
ACKNOWLEDGMENTS We are grateful to Lorraine Dumas, Neil Flynn, Alan Lackey, and Gloria Vicent for their superb technical con-
tribution to this work, and to Joan Foure for clerical assistance.
LITERATURE CITED 1 Abel PM, McSharry C , Galloway E, Ross C , Severn A, Toner G, Gruer L, Wilkinson PC: Heterogeneity of peripheral blood monocyte populations in human immunodeficiency virus- 1 seropositive patients. FEMS Microbiol Immunol 5517-23, 1992. 2. Aboulker, JP, Autran, B, Bcldjord K, Touraine F, Debre P Consistency of routine measurements of CD4’, CD8’ peripheral blood lymphocytes. J Immunol Methods 154:155-161, 1992. 3. Angadi CV: Lack of Leu-3a eptiope on T-helper (CD4) lymphocytes. J Clin Lab Analysis 4193-195, 1990. 4. Barkowitz RS, Umpierre SA, Goldstein DP, Anderson DJ: Cross-reactivity of monoclonal antibodies directed against lymphocyte markers with trophoblast cells of normal placenta and gestational placenta, hydatiform mole and gestational choriocarcinoma. Gynaecol Oncol 2 9 9 4 , 1988. 5 . Centers for Disease Control: Revised guidelines for the performance of CD4 T cell determinations in persons with human immunodeficiency virus (HIV) infections. Morbidity Mortality Weekly Report, 43:l-21, 1994. 6. Cobbold S, Hale G, Waldmann H: Non-lineage, LFA-I family, and leukocyte common antigens. In: Leukocyte Typing 111 White Cell Differentiation Antigens, McMichael AJ (ed). Oxford University Press, New York, 1987, pp. 788-803. 7. Connelly MC, Knight M, Giorgi JV,Kagan J. Landay AL, Parker JW, Spino C, Wilkcning C , Mercolino TJ: Standardization of absolute CD4 lymphocyte counts across laboratories: An evaluation of Ortho CytoronAbsolutc flow cytometry system. < 8. Dimitriu-Bona A, Burmester GR, Waters SJ, W mononuclear phagocyte differentiation antigens, I. Patterns of antigenic expression on the surface of human monocytes and macrophages defined by monoclonal antibodies. J Immunol 130:145-149,
+
+
1983.
9. Ganr P, Pecquet C , Lambin P, Abuaf N, Leynadier F, Rouger P: Flow cytometric evaluation of human basophils. Cytometry 14:344-348,
1993. 10. Hoffman RA, Kung PC, Hansen WP, Goldstein G: Simple and rapid
11. 12. 13.
14.
15.
16. 17.
measurement of human T lymphocytes and their subclasses in peripheral blood. Proc Natl Acad Sci USA 77:4914-4917, 1980. Hultin L, Tan S, Matud J, Giorgi JV:The relationship between CD16 and CD56 antigen expression and NK activity in HIV-infected homosexual men. Cytometry (Suppl.) 6:74, 1993. Kriimer E, Grosmuller F: Light scatter based lymphocyte gate: Helpful tool or source of error? Cytometry 15:87-89, 1994. Landay A, Ohlsson-Wilhelm B, Giorgi JV: Application of flow cytometry to the study of HIV infection. AIDS 4479-497, 1990. Lanier LL, Le AM, Civin CI, Loken MR, Phillips JH: The relationship of C D l 6 (Leu-11) and Leu-19 (NKH-1) expression o n human peripheral blood NK cells and cytotoxic T lymphocytes. J Immunol 136:4480-86, 1986. lanier LL, Testis K, Bindl J, Phillips JH: Identity of Leu-19 (CD56) leukocyte differentiation antigen and neural cell adhesion molecule. J Exp Med 1692233-2241, 1989. Inken MR, Brosnan JM, Bach BA, Ault KA: Quality control in flow cytometry: 1. Establishing optimal lymphocyte gates for immunophenotyping by flow cytometry. Cytometry 11:453, 1990. Mandy FF, Bergeron M, Recktenwald D, Izaguirre CA: A simultaneous three-color T cell subsets analysis with single laser flow cytometers
59
A NEW CONCEPT FOR CELL SUBSET DETERMINATIONS
18.
19.
20. 21.
22.
23.
24.
using T cell gating protocol. J Immunol Methods 156:151-162, 1992. Nicholson, JKA, Jones BM, Hubbdrd M: CD4 T-lymphocyte determinations on whole blood specimens using a single-tube three-color assay. Cytometry 6:685-689, 1993. Peters RE, Janossy G, Ivory K, Al-Ismail S,Campana D, Mercolino T: B cell gating with CD37/~/h.Leukemia 8:1864-1870, 1994. Petrou G, Mryer E, Sato S, Griffis M, Mercolino TJ: A reliable autogating algorithm for automating 3-color immunophenotypic analysis. In preparation. Robinson G, Morgan I., Evans M, McDermott S, Pereira S, Wansbrough-Jones M, Griffin G: Effect of type of hematology analyser on CD4 count. Lancet 340:485, 1992. Ruppert J, Schutt C, Ostermeier D, Peters JH: Down-regulation and release of CD14 on human monocytes by 11,-4 depends on the presence of serum or Gm-CSF. Adv Exp Med Biol 329:291-6, 1993. Schenker EL, Hultin LE, Bauer KD, Ferbas J , Margolick JB, GiorgiJV: Evaluation of dual-color flow cytometry immunophenotyping panel in a multicenter quality assurance program. Cytometry 14307-317, 1993. Shih C C , Bolton G, Sehy D, Lay G, Campbell D, Hudng CM: A novel
25. 26. 27.
28.
29.
30.
dye that facilitates three-color analysis of PBMC by flow cytometry. Ann NY Acad Sci 677389-95, 1993. Stelzer GT, McLeish KR, Lorden RE, Watson S L Alterations in T-lymphocyte subpopulations associated with renal allograft rejection. Transplantation 37:261, 1984. Stewart CC: Multiparameter analysis of leukocytes by flow cytome, try. Methods Cell Biol 35427-50, 1990. Takahashi K, Takata M, Suwaki T, Kawata N, Tdnimoto Y, Soda R. Kimura 1: New flow cytometric method for surface phenotyping basophils from peripheral blood. J Immunol Methods 162:17-2 1, 1993. Van Camp B, Durie BGM, Spier C, De Waele M, Van reit I, Vela E, Frutiger Y, Richter L, Grogan TM: Plasma cells in multiple myeloma express a natural killer cell-associated antigen: CD56 (NKH-1; Leu19). Blood 76377-382, 1990. Wright JJ, Wagner DK, Blaese RM, Hagengruber C, Waldmann TA, Fleisher TA: Characterization of common variable immunodeficien~ cy: Identification of a subset of patients with distinctive immunophenotypic and clinical features. Blood 762046-2041, 1990. Ziegler-Heitbrock HW, Fingerle G, Strobel M, Schraout W: The novel subset of CD14 +/CD16 blood monocytes exhibits features of tis, sue macrophages. Eur J Immunol 23:2053-2058, 1993.
+