www.advhealthmat.de
COMMUNICATION
www.MaterialsViews.com
Polymer Supported Directed Differentiation Reveals a Unique Gene Signature Predicting Stable Hepatocyte Performance Baltasar Lucendo Villarin, Kate Cameron, Dagmara Szkolnicka, Hassan Rashidi, Nicola Bates, Susan J. Kimber, Oliver Flint, Stuart J. Forbes, John P. Iredale, Mark Bradley, and David C. Hay* The ability to generate renewable sources of human soma, from defined genetic backgrounds, has enormous potential for modern medicine, with immediate impacts being the delivery of tailor-made models of human tissue “in a dish,” and the delivery of cell-based therapies likely to follow. Theoretically, pluripotent stem cells (PSCs) can give rise to all somatic cell types found in the human body,[1] with their self-renewal and differentiation properties offering the prospect of generating unlimited quantities of human cells for biomedical application. Our particular interest lies in the delivery of human hepatocyte like cells (HLCs) derived from PSCs. Numerous hepatocyte differentiation protocols have been established using 2D and 3D cell culture,[2] and encouragingly, the stem cell–derived HLCs produced exhibit many typical hepatocyte characteristics.[3–15] While these attributes are promising, the HLCs produced are immature in status, reminiscent of fetal or neo-natal hepatocytes.[16] One major obstacle to stem cell–derived HLC maturation has been cellular instability in culture. Notably, the use of undefined or xenobiotic culture components has contributed to variable cell performance, making it difficult to unravel the complexity behind hepatocyte differentiation and dedifferentiation. B. L. Villarin, Dr. K. Cameron, D. Szkolnicka, Dr. H. Rashidi, Dr. O. Flint, Prof. S. J. Forbes, Dr. D. C. Hay MRC Centre for Regenerative Medicine University of Edinburgh 5 Little France Drive, Edinburgh EH16 4UU, UK E-mail:
[email protected] N. Bates, Prof. S. J. Kimber Faculty of Life Sciences Michael Smith Building Oxford Road, Manchester M13 9PT, UK Prof. J. P. Iredale MRC Centre for Inflammation Research University of Edinburgh 47 Little France Crescent, Edinburgh EH16 4TJ, UK Prof. M. Bradley School of Chemistry University of Edinburgh West Mains Road, Edinburgh EH9 3FJ, UK This is an open access article under the terms of the Creative Commons Attribution License, which permits use, distribution and reproduction in any medium, provided the original work is properly cited. The copyright line for this article was changed on 3 Aug 2015 after original online publication.
DOI: 10.1002/adhm.201500391 1820
wileyonlinelibrary.com
Therefore, the development of highly defined cell based systems are required if the true potential of stem cell–derived HLCs is to be realized. Such systems should be simple to use, inexpensive, scalable, defined, and capable of delivering a product with predictable performance and long “shelf life.” There have been a number of approaches developed, including the use of differential cytokine or chemical combinations, 3D cell aggregation, and perfused devices, to mimic the liver niche and architecture.[17–20] While these approaches marked significant progress, their complexity and/or undefined nature has limited large-scale deployment of the technology. In order to tackle this issue, we hereby report on the use of a defined biopolymer substrate in conjunction with a serum-free differentiation procedure with both research and good manufacturing practice (GMP) grade PSCs. Importantly, those stem-derived populations displayed robust and predictable performance in cell culture which was hallmarked by gene expression of matrix metalloproteinase 13 (MMP13), delta catenin (CTNND2), and thrombospondin 2 (THBS2). H9 human embryonic stem cells (hESCs), displaying an appropriate morphology and expressing stem cell markers (Oct-4 and Nanog, SSEA-4, TRA-1–60, and TRA-1–81) were expanded and used for the differentiation experiments. Importantly, SSEA-1 expression was minimal in these populations (Figure S1A–D, Supporting Information). Additionally, hESCs were able to spontaneously differentiate to all the three germ layers and directly differentiate to HLCs (Figure S1E, Supporting Information and Figure 1). Following validation, hESC populations were directly differentiated to hepatoblasts using a defined procedure.[20] Stem cell–derived hepatoblasts were removed from their substrate and replated, under serum-free conditions, onto a chemically defined polyurethane surface (PU). At 10, 15, and 20 d postreplating, hepatocyte differentiation status was studied by immunostaining for a marker of hepatocyte differentiation, HNF4α, and dedifferentiation, vimentin. Stem cell– derived hepatocytes expressed stable levels of HNF4α on the PU for up to 20 d in culture (Figure 1A). The converse was true for Matrigel (MG) cultures which began to deteriorate from day 15 onward, and by day 20 approximately fourfold fewer cells expressed HNF4α (22% ± 1.8) (Figure 1B). The loss of the hepatocyte phenotype was also corroborated by staining for a marker of hepatocellular dedifferentiation. Stem cell–derived HLCs replated on PU expressed low levels of vimentin, ranging from 23% to 35% (Figure 1A). In contrast, stem cell–derived hepatocytes on MG demonstrated greater dedifferentiation, with staining ranging from 54% to 78% (Figure 1B). These results were further supported by immunostaining studies
© 2015 The Authors. Published by Wiley-VCH Verlag GmbH & Co. KGaA, Weinheim
Adv. Healthcare Mater. 2015, 4, 1820–1825
www.advhealthmat.de www.MaterialsViews.com
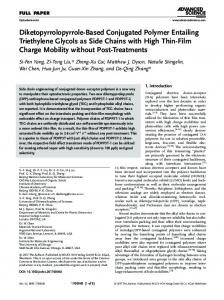
COMMUNICATION Figure 1. Serum-free hepatocyte differentiation of hESCs on a defined polyurethane surface (PU), and a biological matrix Matrigel (MG). A,B) Expression of hepatocyte nuclear factor 4α, (HNF4α - red), and the dedifferentiation marker vimentin (green) in hESC-derived hepatocytes maintained on PU or MG at different time points during the differentiation procedure. Cell nuclei were counterstained with DAPI (blue). IgG controls demonstrate the specificity of immunostaining. The yield percentage of positive cells was calculated from five random fields of view containing at least 400 cells each. Data are expressed as mean ± SD. Images are taken at 20× magnification. Scale bar represents 100 µm. C,D) HLC cytochrome P450 3A and 1A2 (CYP3A and CYP1A2) activity maintained on PU or MG during differentiation. Units of activity are expressed as relative light units (RLU) mL−1 mg−1 of protein. E) Albumin production was detected by ELISA and expressed as micrograms of albumin mL−1 24 h−1 mg−1. Data represent mean ± SD (n = 3).*P < 0.05, **P < 0.01, ***P < 0.001. Images were taken at 20× and the scale bar represents 100 µm.
examining human albumin and cytochrome P450 3A (CYP3A) expression (Figure S2, Supporting Information). hESC-derived HLCs differentiated on PU generated cell populations that were 86% (±4%) and 88% (±1.7%) positive for albumin and CYP3A, respectively, 20 d postreplating. This was an approximate twofold improvement compared with MG cultures, with 43% (±9.5%) and 44% (±8.8%) cells positive for albumin and CYP3A, respectively. The immunostaining studies were further supported by functional analysis. Analysis of cytochrome P450 activity revealed a 30-fold increase in CYP3A activity and a ninefold increase in the CYP1A2 activity in cells cultured on PU (Figure 1C,D). The ability to secrete albumin was also improved threefold in HLCs differentiated on PU (Figure 1E). The improved differentiation status of the stem cell–derived HLCs generated under defined conditions was further supported by their response to compounds which measure hepatocyte metabolic capacity (Figure S3, Supporting Information). Stem cell–derived HLCs differentiated on PU displayed consistent performance in response to two compounds, BMS-827278-01 and BMS-835981-01, which require metabolic activation, via CYP2D6, to toxic endpoints. This was in contrast to HLCs differentiated using MG surfaces which exhibited less consistent performance, presumably due to deficiencies in the CYP2D6 metabolic pathway (Figure S3, Supporting Information). Given the superior performance of HLCs under defined conditions, we were keen to identify genes important in this process. We therefore employed PCR array technology to screen for candidate genes. The RT2 Profiler PCR array
Adv. Healthcare Mater. 2015, 4, 1820–1825
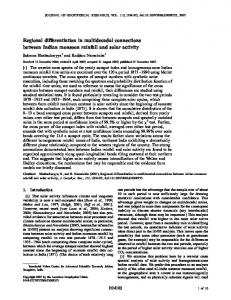
profiled the expression of 84 genes important for cell–cell and cell–matrix interactions. Stem cell–derived HLCs differentiated on MG and PU (20 d postreplating) were compared and from these studies, we identified increased expression of six genes: ADAMTS13, NCAM1, CTNND2, THBS2, MMP10, and MMP13, on PU (Figure 2A,B and Table S4, Supporting Information). The output of the array was validated by real time quantitative PCR (qPCR). One of the candidate genes, ADAMTS13, was not amplified to the same extent and was therefore was excluded from further studies (Figure 2C). The remaining genes were found to be enriched three to sixfold in HLCs differentiated on PU. In order to understand the role each gene played in hepatocyte function, we employed small interfering RNA (siRNA) technology to knockdown the target gene products. HLCs were transfected twice over a 48 h period during differentiation (days 13–15). Posttransfection, gene knockdown was assessed by qPCR. Gene knockdown was dependent on the siRNA used. NCAM1 and CTNND2 levels decreased by ≈25%, MMP10 levels fell by ≈40%, MMP13 decreased by ≈60%, while THBS2 levels fell by ≈75% (Figure 3A) after transfection. In response to gene knockdown, albumin secretion fell by ≈30% and ≈50% in cells transfected with siRNAs to CTNND2 and MMP13, respectively (Figure 3B). Whereas, CYP3A function was reduced by ≈25% and ≈30% in response to the knockdown of THBS2 and MMP13, respectively (Figure 3C). These studies demonstrated that THBS2, MMP13, and CTNND2 are important in stabilizing HLC phenotype under defined conditions.
© 2015 The Authors. Published by Wiley-VCH Verlag GmbH & Co. KGaA, Weinheim
wileyonlinelibrary.com
1821
www.advhealthmat.de
COMMUNICATION
www.MaterialsViews.com
1822
At this point albumin production was stable, while the production of AFP decreased approximately fivefold over the same 5 d time frame. In these experiments, Man 11 derived HLCs were only stable up to 15 d in culture, and therefore could not be characterized past this point (Figure S6A, Supporting Information). The ability to differentiate and maintain human somatic cells in culture has revolutionary potential. However, the delivery of reliable and stable human models is a major barrier limiting current endeavors. The development of defined differentiation systems, free of xenobiotic materials or undefined additives, is required to achieve this objective. Figure 2. Differential gene expression of HLCs maintained on PU or MG. A) The scatter We developed an interdisciplinary approach, plot represents expression of the major ECM components and matrix associated receptors expressed in human cells. The scatter plot represents threefold change in gene expression. blending polymer chemistry, and defined Symbols outside the boundary areas indicate fold-differences greater or lesser than threefold. biological differentiation systems. The focus B) Graph representing the induced genes in hESC-derived HLCs maintained on PU. C) qPCR of our studies was to identify novel genetic was employed to validateon the upregulated genes identified on the array. Data represent mean signatures associated with stable hepatocyte ± SD (n = 3). **P < 0.01, ***P < 0.001 versus Matrigel. differentiation from both research and GMP grade hESC lines (Figure 1 and Figure S3, Supporting Information). In a focused survey of human cell The manufacture of stem cell–derived somatic cells is membrane components and receptors, using a PCR array, we likely to play an important part in developing cell based theridentified five genes which were enhanced in cells differentiapies of the future. To be able to deliver clinical grade mateated in a defined culture environment. Those genes, which rials, one must use clinical grade components. In this vein, appear to be new markers of hepatocyte differentiation, could we employed two hESC lines which were derived under GMP be broadly divided in two categories; extracellular matrix (ECM) conditions, Man 11 and Man 12. Both Man lines were charremodelers (MMP10 and MMP13) or cell–cell and cell–matrix acterized in detail, displaying typical hESC morphology and interactors (THBS2, CTNND2, and NCAM1) (Figure 2). The expressing Oct-4 and Nanog. hESC surface maker expresMMPs are a family of proteins known to display substrate sion was also detected by flow cytometry. Man 11 and Man specificity for particular ECMs. Their activity is regulated by 12 hESCs expressed SSEA-4, TRA-1–60, and TRA-1–81, but not post-translational modifications and by the tissue inhibitor SSEA-1 (Figure S4A–C, Supporting Information). Additionof matrix metalloproteinases (TIMPs).[21] MMPs are essenally, both hESC lines were able to spontaneously form three germ layers and directly differentiate to HLCs (Figures S4D tial for normal remodeling of the extracellular matrix, tissue and S5, Supporting Information). Encouragingly, Man 11 and morphogenesis, and wound healing.[21] Our analysis indicated Man 12 differentiation was highly efficient, with 87% and 95% that both MMP13 and 10 gene expression was increased over of the Man 11 derived HLCs expressing HNF4α and albumin, cultures differentiated in an undefined manner. It is possible that differences in gene expression may reflect the capacity of respectively. The pattern of expression was similar for Man the cell to remodel the ECM which is known to be important 12 derived HLCs, with 84% and 99% of derived hepatocytes in the maintenance of hepatocyte phenotype.[22–24] In addition expressing HNF4α and albumin, respectively (Figure S5, Supporting Information). Following basic characterization, hESCs to its role in collagen remodeling, we identified MMP13 as a were differentiated toward the hepatocyte lineage. Cytochrome potential regulator of cytochrome P450 metabolism and human P450 activity, albumin and alpha-fetoprotein (AFP) producalbumin secretion (Figure 3). Our analyses also demonstrated tion was measurable in HLCs maintained on PU for at least increased expression of genes which code for proteins involved 15 d postreplating (Figure 3D,F,G and Figure S6A, Supporting in cell–cell and cell–matrix interactions. THBS2, CTNND2, and Information). At this point stem cell–derived HLCs expressed NCAM1 were expressed at greater levels in cell populations difgreater levels of MMP13, CTNND2, and THBS2 than their MG ferentiated under defined conditions. THBS2 and CTNND2 are counterparts (Figure 3E and Figure S6B, Supporting Informaknown to regulate cell adhesion, organization, and migration, tion). There were differences recorded in the gene expression in response to growth factor stimulation.[25–27] Along similar between Man 11 and Man 12 HLCs. CTNND2 expression was lines, NCAM1 has been identified as important in cell motility, marginally increased and MMP 13 expression was reduced in liver development and liver regeneration.[28] In addition to their Man 11 HLCs in comparison to Man 12 HLCs (Figure 3E and proposed roles in cell attachment, organization, and migration, Figure S6B, Supporting Information). THBS2 was expressed at we report our novel findings: a reduction in THBS2 expressimilar levels in both Man 11 and Man 12 HLCs. In addition to sion led to reduced cytochrome P450 function, while reduced changes in gene expression, we also observed differences in the CTNND2 led to reduced albumin secretion (Figure 3B,C). Our stability of Man 11 and Man 12 HLCs. Man 12 HLCs, like their further experiments focused on the functional gene signature H9 counterparts, were stable for up to 20 d on the PU surface. MMP13, THBS2, and CTNND2. In these studies, we employed
wileyonlinelibrary.com
© 2015 The Authors. Published by Wiley-VCH Verlag GmbH & Co. KGaA, Weinheim
Adv. Healthcare Mater. 2015, 4, 1820–1825
www.advhealthmat.de www.MaterialsViews.com
COMMUNICATION Figure 3. Role of the candidate genes in HLCs function. A) Graph representing the decrease of candidate genes in HLCs post-siRNA transfection. B) HLC albumin production, post-siRNA transfection, was detected by ELISA. Data represent the mean ± SD (n = 3). *P < 0.05 versus scrambled control. C) HLC CYP3A activity, post-siRNA transfection, was determined using the pGlo system. Units of activity are expressed as relative light units (RLU) mL−1 mg−1 of protein. Data represent the mean ± SD (n = 3). ***P < 0.001 versus scrambled control. D) Man 11 and Man 12 derived HLCs maintained on PU display CYP3A activity at day 15 postreplating. Units of activity are expressed as RLU mL−1 mg−1 of protein. Data represent the mean ± SD (n = 3). E) Candidate genes upregulated in Man 12 HLCs on PU at day 15 postreplating. Data represent the mean ± SD (n = 3). ***P ≤ 0.001 versus Matrigel. F,G) Man 12 derived HLCs maintained on PU secrete albumin and AFP at days 15 and 20 postreplating. Units of activity are expressed as nanograms of albumin or AFP mL−1 24 h mg−1. Data represent mean ± SD (n = 3). *P < 0.05 versus day 15 HLCs.
two hESC lines derived to GMP and subsequently maintained serum free. Notably, defined and directed differentiation of both GMP lines yielded cell populations which expressed increased levels of MMP13, THBS2, and CTNND2 and thereby supporting data derived from the research grade hESC line. Of note the Man 12 derived HLCs performed best in culture, demonstrating stable albumin production and a fivefold reduction
Adv. Healthcare Mater. 2015, 4, 1820–1825
in AFP secretion over the same 5 d period. These results imply that Man 12 HLCs were maturing in culture as HLC phenotype stabilized. In conclusion, dependable differentiation from pluripotent stem cells requires defined culture parameters. Such systems will permit informative and mechanistic analysis of human biology. The novel gene signature identified in these studies is
© 2015 The Authors. Published by Wiley-VCH Verlag GmbH & Co. KGaA, Weinheim
wileyonlinelibrary.com
1823
www.advhealthmat.de
COMMUNICATION
www.MaterialsViews.com
1824
one example, which may also serve as important gold standard parameters for quality control and manufacture of GMP grade products at scale.
Experimental Section Cell Culture and Differentiation: hESCs H9 (WARF), Man 11 and Man 12 (University of Manchester) were cultured and differentiated to hepatoblasts as reported previously.[20] At day 8 in the differentiation process the cells were cultured in HepatoZYME-SFM media (Life Technologies) supplemented with 10 × 10−6 M hydrocortisone 21-hemisuccinate (Sigma) and 2 × 10⁻³ M GlutaMAX (Gibco) containing 10 ng mL−1 hepatocyte growth factor and 20 ng mL−1 oncostatin M (Peprotech) for 24 h cells. At day 9 stem cell–derived hepatoblasts were removed from their substrate using 5 min at 37 °C incubation with TrypLE (Life Technologies). Following this, HLCs were plated onto an optimized PU polymer surface[29] or Matrigel (BD Biosciences, San Jose) coated surfaces in HepatoZYME-SFM supplemented with 5% KnockOut Serum Replacement (Life Technologies), containing 20 ng mL−1 hepatocyte growth factor, 40 ng mL−1 oncostatin M, and 10 ng mL−1 EGF (Peprotech). 48 h postreplating the HepatoZYME-SFM was supplemented with 10 ng mL−1 hepatocyte growth factor and 20 ng mL−1 oncostatin M. The media was changed every 48 h until the experimental endpoint. RNA Isolation and qPCR: Total RNA was prepared using the RNAeasy Mini Kit (Qiagen, UK) according to manufacturer's instructions. Total RNA was reverse transcribed using QuantiTect Reverse Transcription Kit (Qiagen), as per manufacturer's instructions (Qiagen). Quantitative PCR was carried out using Taqman Fast Advance Mastermix and appropriate primers (Applied Biosystems). The primers are listed in Table S1 (Supporting Information). The samples were analyzed using Roche LightCycler 480 Real-Time PCR System. Results were normalized to GAPDH and expressed as relative expression over the control sample. Quantitative PCRs were run in triplicate. Data analysis was performed using Roche LightCycler 480 Software (version 1.5). PCR Array: Reverse transcription (RT) of RNA samples used on the PCR array was performed using RT2 First Strand Kit, as per manufacturer's instructions (Qiagen). Real-time PCR reactions were performed using RT2 Profiler PCR array (Qiagen) in a 384-well optical plates. Real-time reactions were conducted on an ABI 7900HT (Applied Biosystems). Results were PCR reactions performed in duplicate for each target gene. The gene expression was analyzed by RT2 Profiler PCR array Data Analysis version 5.0 (Qiagen) in the form of cycle threshold (Ct) values. Cell Transfection: hESC-derived HLCs were transfected for two consecutive days (day 13 and day 14) postreplating using the Silencer Select siRNAs (Life Technologies). siRNAs were used at a final concentration of 80 × 10−6 M diluted in Opti-MEM I containing Lipofectamine 2000 (Life Technologies). The siRNA are listed in Table S2 (Supporting Information). Cells were collected at day 15 postreplating for further analysis. Each knockdwon was perfromed in triplicate and scrambled RNA controls were used throughout. Cytochrome P450 Functional Assay: CYP3A and CYP1A2 activity were measured using the pGlo kit from Promega and the assays were carried out as per the manufacturer’s instructions (http://www.promega.com/ tbs/tb325/tb325.pdf). CYP activities were expressed as relative light units (RLU), per mg−1 of protein per mL−1 of tissue culture medium. Measurement of Secreted Albumin: hESC-derived HLCs were cultured in HepatoZYME-SFM. The supernatants were collected for analysis by ELISA (Alpha Diagnostic International) and the data was expressed as micrograms (µg) or nanograms (ng) of albumin or AFP per mL−1, per 24 hours, per mg−1 of protein. Immunofluorescence: Cell cultures at different points during cellular differentiation were fixed in 100% methanol (Sigma-Aldrich) at −20 °C for 30 min. Postfixation, cell monolayers were washed three times with PBS for 5 min at room temperature. After blocking with
wileyonlinelibrary.com
PBS/0.1%Tween/10% BSA for 1 h, the cells were incubated with primary antibodies diluted in PBS/0.1%Tween/1% BSA overnight at 4 °C. Following this the cells were washed three times with PBS/0.1%Tween/1% BSA and then incubated with the appropriate secondary antibody diluted in PBS/0.1%Tween/1% BSA for 1 h at room temperature. Following this the cells were washed twice with PBS/0.1%Tween/1% BSA and once with PBS. Fixed and stained monolayers were then stained with DAPI (Life Technologies) for 20 min at room temperature. Following this cultures were mounted with PermaFluor aqueous mounting medium (Thermo Scientific). The cells were analyzed using a Zeiss Axio Observed Z1 microscope and processing Zeiss Axiovison Rel 4.8 software. The percentage of positive cells and standard deviation was estimated from at least five random fields of view with a least 400 cells per field of view. The primary and secondary antibodies are listed in Table S3 (Supporting Information).
Supporting Information Supporting Information is available from the Wiley Online Library or from the author.
Acknowledgements K.C., H.R., S.J.K., S.J.F., M.B., and D.C.H. were supported by the UK Regenerative medicine platform (MR/K026666/1 and MR/L022974/1). B.L.-V. and D.S. were supported by MRC Ph.D. studentships. S.J.K. and N.B. were supported by the MRC (G0801057) and the BBSRC/TSB (BB/ J021636/1). Author contributions: B.L.-V.: Experimental design; collection and/or assembly of data, data analysis and interpretation; paper writing and proofreading. K.C.: Collection and/or assembly of data; data analysis and interpretation. D.S.: Collection and/or assembly of data; data analysis and interpretation. H.R.: Collection and/or assembly of data; data analysis and interpretation. N.B.: Derivation, characterization, and provision of GMP cell lines. S.J.K.: Derivation, characterization, and provision of GMP cell lines, paper writing and proofreading. O.F.: Provision of pharmaceutical grade compounds, data analysis; paper writing and proofreading. S.J.F.: Data analysis and interpretation; paper writing and proofreading. J.I.: Conception and design; data analysis; financial support; paper writing and proofreading. M.B.: Conception and design; data analysis; financial support; paper writing and proofreading. D.C.H.: Conception and design; data analysis and interpretation; paper writing; financial support; final approval of paper and proofreading. Received: May 24, 2015 Published online: June 24, 2015
[1] J. L. Sterneckert, P. Reinhardt, H. R. Schöler, Nat. Rev. Genet. 2014, 15, 625. [2] D. Szkolnicka, W. Zhou, B. Lucendo-Villarin, D. C. Hay, Annu. Rev. Pharmacol. Toxicol. 2013, 53, 147. [3] S. T. Rashid, S. Corbineau, N. Hannan, S. J. Marciniak, E. Miranda, G. Alexander, I. Huang-Doran, J. Griffin, L. Ahrlund-Richter, J. Skepper, R. Semple, A. Weber, D. A. Lomas, L. Vallier, J. Clin. Invest. 2010, 120, 3127. [4] J. Cai, Y. Zhao, Y. Liu, F. Ye, Z. Song, H. Qin, S. Meng, Y. Chen, R. Zhou, X. Song, Y. Guo, M. Ding, H. Deng, Hepatology 2007, 45, 1229. [5] D. C. Hay, J. Fletcher, C. Payne, J. D. Terrace, R. C. J. Gallagher, J. Snoeys, J. R. Black, D. Wojtacha, K. Samuel, Z. Hannoun, Proc. Natl. Acad. Sci. U.S.A. 2008, 105, 12301. [6] P. Roelandt, S. Obeid, J. Paeshuyse, J. Vanhove, A. Van Lommel, Y. Nahmias, F. Nevens, J. Neyts, C. M. Verfaillie, J. Hepatol. 2012, 57, 246.
© 2015 The Authors. Published by Wiley-VCH Verlag GmbH & Co. KGaA, Weinheim
Adv. Healthcare Mater. 2015, 4, 1820–1825
www.advhealthmat.de www.MaterialsViews.com
Adv. Healthcare Mater. 2015, 4, 1820–1825
[18] L. Sivertsson, J. Synnergren, J. Jensen, P. Björquist, M. IngelmanSundberg, Stem Cells Dev. 2013, 22, 581. [19] M. Vosough, E. Omidinia, M. Kadivar, M.-A. Shokrgozar, B. Pournasr, N. Aghdami, H. Baharvand, Stem Cells Dev. 2013, 22, 2693. [20] D. C. Hay, S. Pernagallo, J. J. Diaz-Mochon, C. N. Medine, S. Greenhough, Z. Hannoun, J. Schrader, J. R. Black, J. Fletcher, D. Dalgetty, A. I. Thompson, P. N. Newsome, S. J. Forbes, J. A. Ross, M. Bradley, J. P. Iredale, Stem Cell Res. 2011, 6, 92. [21] J. P. Iredale, J. Clin. Invest. 2007, 117, 539. [22] D. Muller, B. Quantin, M. C. Gesnel, R. Millon-Collard, J. Abecassis, R. Breathnach, Biochem. J. 1988, 253, 187. [23] J. M. Freije, I. Díez-Itza, M. Balbín, L. M. Sánchez, R. Blasco, J. Tolivia, C. López-Otín, J. Biol. Chem. 1994, 269, 16766. [24] O. Garcia-Irigoyen, S. Carotti, M. U. Latasa, I. Uriarte, M. G. Fernández-Barrena, M. Elizalde, R. Urtasun, U. VespasianiGentilucci, S. Morini, J. M. Banales, W. C. Parks, J. A. Rodriguez, J. Orbe, J. Prieto, J. A. Páramo, C. Berasain, M. A. Ávila, Liver Int. 2014, 34, e257. [25] A. Liu, P. Garg, S. Yang, P. Gong, M. A. Pallero, D. S. Annis, Y. Liu, A. Passaniti, D. Mann, D. F. Mosher, J. E. Murphy-Ullrich, S. E. Goldblum, J. Biol. Chem. 2009, 284, 6389. [26] C. Ozaki, M. Yoshioka, S. Tominaga, Y. Osaka, S. Obata, S. T. Suzuki, Cell Struct. Funct. 2010, 35, 81. [27] T. Ezaki, R.-J. Guo, H. Li, A. B. Reynolds, J. P. Lynch, Am. J. Physiol.: Gastrointest. Liver Physiol. 2007, 293, G54. [28] A. Tsuchiya, W.-Y. Lu, B. Weinhold, L. Boulter, B. M. Stutchfield, M. J. Williams, R. V. Guest, S. E. Minnis-Lyons, A. C. MacKinnon, D. Schwarzer, T. Ichida, M. Nomoto, Y. Aoyagi, R. Gerardy-Schahn, S. J. Forbes, Hepatology 2014, 60, 1727. [29] B. Lucendo-Villarin, K. Cameron, D. Szkolnicka, P. Travers, F. Khan, J. Walton, J. P. Iredale, M. Bradley, D. C. Hay, J. Visualized Exp. 2014, 91, 51723.
© 2015 The Authors. Published by Wiley-VCH Verlag GmbH & Co. KGaA, Weinheim
wileyonlinelibrary.com
COMMUNICATION
[7] R. E. Schwartz, K. Trehan, L. Andrus, T. P. Sheahan, A. Ploss, S. A. Duncan, C. M. Rice, S. N. Bhatia, Proc. Natl. Acad. Sci. U.S.A. 2012, 109, 2544. [8] A. Shlomai, R. E. Schwartz, V. Ramanan, A. Bhatta, Y. P. de Jong, S. N. Bhatia, C. M. Rice, Proc. Natl. Acad. Sci. U.S.A. 2014, 111, 12193. [9] X. Wu, J. M. Robotham, E. Lee, S. Dalton, N. M. Kneteman, D. M. Gilbert, H. Tang, PLoS Pathog. 2012, 8, e1002617. [10] X. Zhou, P. Sun, B. Lucendo-Villarin, A. G. N. Angus, D. Szkolnicka, K. Cameron, S. L. Farnworth, A. H. Patel, D. C. Hay, Stem Cell Rep. 2014, 3, 204. [11] S. Ng, R. E. Schwartz, S. March, A. Galstian, N. Gural, J. Shan, M. Prabhu, M. M. Mota, S. N. Bhatia, Stem Cell Rep. 2015, 4, 348. [12] C. N. Medine, B. Lucendo-Villarin, C. Storck, F. Wang, D. Szkolnicka, F. Khan, S. Pernagallo, J. R. Black, H. M. Marriage, J. A. Ross, M. Bradley, J. P. Iredale, O. Flint, D. C. Hay, Stem Cells Transl. Med. 2013, 2, 505. [13] K. Takayama, Y. Morisaki, S. Kuno, Y. Nagamoto, K. Harada, N. Furukawa, M. Ohtaka, K. Nishimura, K. Imagawa, F. Sakurai, M. Tachibana, R. Sumazaki, E. Noguchi, M. Nakanishi, K. Hirata, K. Kawabata, H. Mizuguchi, Proc. Natl. Acad. Sci. U.S.A. 2014, 111, 16772. [14] D. Szkolnicka, S. L. Farnworth, B. Lucendo-Villarin, C. Storck, W. Zhou, J. P. Iredale, O. Flint, D. C. Hay, Stem Cells Transl. Med. 2014, 3, 141. [15] G. Holmgren, A.-K. Sjögren, I. Barragan, A. Sabirsh, P. Sartipy, J. Synnergren, P. Björquist, M. Ingelman-Sundberg, T. B. Andersson, J. Edsbagge, Drug Metab. Dispos. 2014, 42, 1401. [16] D. Bader, A. Riskin, O. Vafsi, A. Tamir, B. Peskin, N. Israel, R. Merksamer, H. Dar, M. David, Clin. Chim. Acta 2004, 349, 15. [17] K. Takayama, K. Kawabata, Y. Nagamoto, K. Kishimoto, K. Tashiro, F. Sakurai, M. Tachibana, K. Kanda, T. Hayakawa, M. K. Furue, H. Mizuguchi, Biomaterials 2013, 34, 1781.
1825