MAY 2016
LIN AND CHENG
1337
Impact of Soil Moisture Initialization and Soil Texture on Simulated Land–Atmosphere Interaction in Taiwan TZU-SHUN LIN AND FANG-YI CHENG Department of Atmospheric Sciences, National Central University, Taiwan (Manuscript received 3 February 2015, in final form 22 September 2015) ABSTRACT This study investigates the effect of soil moisture initializations and soil texture on the land surface hydrologic processes and its feedback on atmospheric fields in Taiwan. The simulations using the Weather Research and Forecasting (WRF) Model with the Noah land surface model were conducted for a 1-month period from 10 August to 12 September 2013 that included two typhoon-induced precipitation episodes and a series of clear-sky days. Soil moisture from the Global Land Data Assimilation System (GLDAS) was utilized to provide the soil moisture initialization process. In addition, updated soil textures based on field surveys in Taiwan were adopted for the WRF Model. Three WRF sensitivity runs were performed. The first simulation is the base case without any update (WRF-base), the second simulation utilizes GLDAS products to initialize the soil moisture (WRF-GLDAS), and the third simulation includes GLDAS products plus the updated soil textures and soil parameters (WRF-GSOIL). In WRF-base, the soil moisture initialization process is provided from National Centers for Environmental Prediction (NCEP) Final (FNL) Operational Global Analysis data, which are higher than the data from GLDAS products. The WRF-GLDAS and WRF-GSOIL with use of GLDAS data show lower soil moisture than WRF-base and agree better with observed data, while WRF-base shows a systematic wet bias of soil moisture throughout the simulation periods. In WRF-GSOIL, the soil textures with large-sized soil particles reveal higher soil conductivity; as a result, water drains through the soil column in a faster manner than the WRF-GLDAS, which leads to reduced soil moisture in western Taiwan. Among the three simulations, the variation of soil moisture is best simulated in WRF-GSOIL.
1. Introduction Soil moisture plays a fundamental role in the exchange of water and energy cycles between the atmosphere and the land surface through evapotranspiration (ET), which primarily includes bare soil evaporation and plant transpiration of water. The amount of soil moisture will modulate the partition of total available energy at the land surface between sensible heat fluxes (SHFs) and latent heat fluxes (LHFs) and then impact the nearsurface atmospheric conditions. Variations in surface temperature and water vapor induced by soil moisture may also influence the structure of the atmospheric boundary layer, the formation of shallow clouds, precipitation amounts, and wind fields (e.g., Yang et al. 2007; Santanello et al. 2011; Zaitchik et al. 2013; Yang et al.
Corresponding author address: Fang-Yi Cheng, Department of Atmospheric Sciences, National Central University, No. 300, Chun-Da Rd., Zhongli Dist., Taoyuan City 32001, Taiwan. E-mail:
[email protected] DOI: 10.1175/JHM-D-15-0024.1 Ó 2016 American Meteorological Society
2011; Husain et al. 2014). The spatial distributions of soil moisture are affected not only by the land surface hydrologic processes, including precipitation, ET, groundwater, and surface and subsurface runoff processes, but also by the heterogeneity of topography, soil properties, and land-cover characteristics. Based on the past modeling and observational studies, Seneviratne et al. (2010) concluded that the soil moisture could have significant impacts on variations in temperature and precipitation when the soil moisture– atmosphere interactions are strong. In the Global Land– Atmosphere Coupling Experiment (GLACE), Koster et al. (2006) identified eastern China as one of the strong soil moisture–temperature coupling regions. In Meng and Shen (2014), the observational evidence indicates soil moisture had an influence on the hot extremes and the daily temperature range in eastern China and suggested that previous drier surface conditions might intensify summer hot extremes and could potentially be used to predict extreme heat waves. Koster et al. (2004) demonstrated that precipitation could be affected by
1338
JOURNAL OF HYDROMETEOROLOGY
soil moisture anomalies in the transitional region where the evapotranspiration is sensitive to soil moisture changes. Meng et al. (2014) examined spring soil moisture and summer precipitation in southeastern China and found that a strong correlation exists between spring soil moisture and summer precipitation. Zhang et al. (2011) used the Weather Research and Forecasting (WRF) Model to investigate the impact of soil moisture on precipitation and temperature over East Asia and showed that land– atmosphere interaction plays a significant role in summer climate variability. Various studies (e.g., Chen and Dudhia 2001; Seuffert et al. 2002; LeMone et al. 2007; Hong et al. 2009) have indicated that the soil water content is critical in determining the surface flux components and the performance of numerical weather predictions from subseasonal to seasonal variability. Chen and Dudhia (2001) showed that the soil thermal and hydraulic conductivities and the surface energy budget are very sensitive to soil moisture changes in the Fifth-generation Pennsylvania State University–National Center for Atmospheric Research (NCAR) Mesoscale Model (MM5), and they suggested establishing a soil moisture data assimilation system to improve the soil moisture initialization. Seuffert et al. (2002) used a two-way coupling of the German operational mesoscale weather prediction model (Lokal model) with the land surface hydrologic model to investigate the influence of the land surface hydrologic model [TOPMODEL-Based Land Surface–Atmosphere Transfer Scheme (TOPLATS)] on the predicted local weather. Their findings showed improved prediction of energy fluxes and amount of rainfall because of the more accurate representation of vegetation and soil hydrologic processes, especially the lateral water transport and soil moisture. LeMone et al. (2007) analyzed data from a flux tower, radar wind profiler, and aircraft from the May–June 2002 International H2O Project (IHOP_2002) and the April–May 1997 Cooperative Atmosphere–Surface Exchange Study (CASES-97) and found that soil moisture affects the relative magnitude of sensible and latent heat fluxes. Lam et al. (2006) studied the effect of six land surface parameters on Hong Kong’s meteorological simulation, including the roughness length, thermal inertia, soil moisture availability, albedo, surface heat capacity, and surface emissivity. The results suggested that soil moisture availability is the most important controlling parameter of patterns of surface fluxes. The performance of the hydrometeorological processes is strongly dependent on proper soil temperature and soil moisture initialization processes (Mahanama et al. 2008; Trier et al. 2008; Vivoni et al. 2009; Sörensson and Berbery 2015). Wrong initial values of these variables would produce the so-called spinup problem; that is, the initial over- or underestimation may last even
VOLUME 17
several months, and the amplitude is related to the initial error in the soil moistures, especially for short-term to seasonal simulations (Koster and Suarez 2001; Cassardo et al. 2009). Trier et al. (2008, 2011) used the WRF Model and found that the initial soil wetness affects regionalscale thermodynamic conditions and precipitation. In contrast to initial soil moisture, soil moisture evolution has negligible impacts on the mean near-surface thermodynamic variables. Hong et al. (2009) adopted a WRF Model coupled with the Noah land surface model (LSM) to improve soil moisture initialization using the HighResolution Land Data Assimilation System (HRLDAS), which was developed to provide soil moisture data in high spatial resolution by NCAR. In general, initial soil moisture fields for numerical weather predictions are provided from reanalysis fields. For example, in the WRF system, the initial fields of soil moisture and temperature can be supplied from the National Centers for Environmental Prediction (NCEP) Final (FNL) Operational Global Analysis or the European Centre for Medium-Range Weather Forecasts (ECMWF) model predicted fields that are, however, at coarse resolution. Nevertheless, soil moisture initialization using data from an LSM that is different from the LSM used for a regional model may result in some erroneous predictions because soil moisture values are not transferable from one model to another (Reichle et al. 2004; Dirmeyer et al. 2006; Sörensson and Berbery 2015). To provide a proper soil moisture initialization process for the meteorological modeling applications in Taiwan, the Global Land Data Assimilation System (GLDAS; Rodell et al. 2004) produced from four uncoupled land surface models was adopted to provide the optimal soil states. In GLDAS, atmospheric conditions driving the land model were downscaled from reanalysis data; precipitation and temperature were bias corrected against a set of satellite observation-based data via data assimilation techniques before they were supplied as input forcing for the LSM. The details of GLDAS are described in the following section. The physical and hydraulic properties of the soil also play a vital role in accurately simulating land surface hydrologic processes, including the amount of water that infiltrates downward through soil layers and the amount of soil water available for ET. The importance of soil textures on land surface hydrologic processes has been illustrated in several studies. Warrach-Sagi et al. (2008) changed the parameterization of the hydraulic conductivity and diffusivity and updated the high-resolution soil texture dataset. The simulation results led to a significant improvement in the streamflow simulations. Mostovoy and Anantharaj (2008) performed sensitivity tests to evaluate the effects of the hydraulic parameters
MAY 2016
LIN AND CHENG
on simulated soil moisture by the Noah LSM and suggested that the accuracy of simulated soil moisture was strongly dominated by soil texture through related hydraulic parameters. Gao et al. (2008) mentioned that soil texture distribution played an important role in the development of local precipitation in the Heihe River basin in northwestern China. Zhang et al. (2012) implemented land surface datasets, including the new landcover and land-use types, soil types, and monthly green vegetation fraction and surface albedo for the Hawaiian region, and generally improved the climatological simulation of atmospheric fields. In the WRF Model, the soil parameters, such as field capacity, wilting point, porosity, saturation soil matric potential, and thermal diffusivity, are determined from a lookup table that is dependent on the corresponding soil textures (Chen and Dudhia 2001). The official release of soil textures in the WRF–Noah framework is developed by the U.S. Department of Agriculture (USDA) 30-s State Soil Geographic (STATSGO) database for the North America region and the 5-min (around 9 km) Food and Agriculture Organization of the United Nation (FAO) 16-category soil types outside the United States (Miller and White 1998). It is believed that this soil dataset can be used in the United States, but it does not accurately reflect the detailed soil features of areas outside the United States (Gao et al. 2008). To reveal a more realistic geographical distribution of soil classification in Taiwan, the updated soil textures were collected based on field investigations from the Council of Agriculture, Executive Yuan (Leung and Chen 1957), and this local dataset was remapped to the default WRF soil classifications and replaces the default WRF soil dataset. The soil hydraulic parameters were also rederived according to the observed soil profile datasets that provide the fractions of soil textures (sand, silt, and clay). The WRF sensitivities were performed with respect to the default and updated soil type datasets to understand the role of soil texture on the land–air interactions in Taiwan. Detailed comparisons of the default and updated soil types are illustrated in the following section. Soil moisture–atmosphere interactions for a relatively small isolated mountainous island like Taiwan have received less attention in the past. To understand the effect of soil moisture initialization processes and soil textures on land–atmosphere interactions in Taiwan, the community WRF meteorological model with the coupled Noah LSM (Chen and Dudhia 2001) is adopted to investigate the land surface hydrologic processes in Taiwan. The objectives include 1) investigating the effect of soil moisture initializations on simulated land surface hydrologic processes and its
1339
feedback on atmospheric fields and 2) understanding the impact of the updated soil textures on the simulated soil moisture and its subsequent effect on the hydrometeorological fields. A detailed description of the GLDAS datasets and updated soil textures is discussed in section 2. The characterization of the episode and model configuration is described in section 3. A discussion of the simulation results and comparison with the measurements appear in section 4. Some conclusions are given in section 5.
2. Description of soil conditions a. Soil moisture initialization The products of GLDAS are generated from four uncoupled land surface models, the Mosaic model (Koster and Suarez 1996), the Community Land Model (Dai et al. 2003), the Variable Infiltration Capacity model (Liang et al. 1994, 1996), and the Noah model (Chen et al. 1996; Koren et al. 1999), for which a set of satellite- and groundbased meteorological forcing conditions and land surface parameters are ingested through data assimilation techniques to produce optimal, long-term (spanning from 1979 to present), 3-hourly, and 0.258 hydroclimatological fields, including soil moisture, surface temperature, and flux parameters (e.g., evaporation and SHF) around the world. Observation-based precipitation and downward radiation products and the best available analyses from atmospheric data assimilation systems are employed to force the models (Rodell et al. 2004). A vegetation-based tiling approach (Koster and Suarez 1992) is used to simulate subgrid-scale variability, with a 1-km global vegetation dataset provided from the University of Maryland Vegetation Classification (Hansen et al. 2000). The soil parameters use the 5-min-resolution global soils dataset derived from Reynolds et al. (2000). GLDAS adopts a Global 30 arc s elevation dataset (GTOPO30; Verdin and Greenlee 1996) as its standard. In this study, a 0.258 3 0.258 3-hourly GLDAS-1 dataset produced by the Noah model is used. The soil moisture generated by the GLDAS-1 dataset that is at a finer spatial resolution than the global reanalysis fields was used to initialize soil conditions for the WRF Model and to compare with the simulation that was driven by NCEP FNL data.
b. Soil textures The official release of soil textures in the WRF–Noah framework is developed by the USDA 30-s STATSGO database for North America only and merged with the 5-min FAO 16-category soil types outside the United States (Miller and White 1998). The soil texture of the top soil layer is treated as the dominant soil texture
1340
JOURNAL OF HYDROMETEOROLOGY
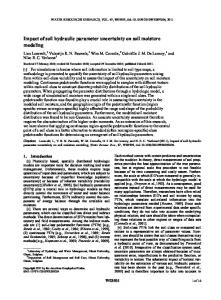
category throughout the whole soil column at each model grid cell. The soil parameters used in WRF– Noah LSM are presented through a lookup table that is dependent on the soil textures. The soil hydraulic parameters prescribed in the WRF Model, such as porosity, saturated hydraulic conductivity, saturated metric potential, and slope of the retention curve, are specified by Cosby et al. (1984). The field capacity and wilting point of volumetric soil moisture are not provided by Cosby et al. (1984), but computed for each soil texture by Chen and Dudhia (2001). Figures 1a and 1b show the original FAO soil textures used in the WRF Model and the updated soil textures, respectively, at 3-km resolution in the area of Taiwan. For the area outside Taiwan, the soil type is based on the default FAO data from the WRF Model. The dominant soil types from the FAO data in Taiwan are clay loam, sandy clay loam, and loamy and clay soils. The distribution of the soil type from the FAO data is homogeneous and follows the distribution of the topographical height, which does not reflect the real soil state and lacks realistic information on soil physical and hydraulic properties in Taiwan. The updated soil types over plains, mountains, and slope areas in Taiwan are collected based on field investigations from the Council of Agriculture, Executive Yuan, with vector-format (polygon) data for 1/50 000–1/ 25 000 soil maps (available online at http://taiwansoil. tari.gov.tw/Web.Net2008/index_1/main1-1.aspx). These datasets are surveyed according to the USDA Soil Survey Geographic Database (SSURGO) from 1960 to 2007 in order to provide standard digitization of the soil dataset in Taiwan for applications in agriculture, ecology, soil conservation, etc. The polygon data are subsequently rasterized with the Taiwan 1997 (TWD97) datum geographic coordinate system and aggregated to 3-km grid resolution in accordance with the WRF configuration by the Arc/Info geographical information system (GIS) software from the Environmental Systems Research Institute. There are 21 classifications in the updated soil type dataset, which had to be remapped to the corresponding STATSGO/FAO soil classification system in order to be used in WRF system. Table 1 is the corresponding mapping table. Most of the soil textures from the updated soil dataset can be assigned directly, as they corresponded to the primary STATSGO/FAO classification; however, classification for mixed silt and silt loam soils cannot be classified directly. In this study, silt loam is used as the main classification because the formation of soils occurred in the marine sedimentary environment and was very young over the Taiwan plain regions (Leung and Chen 1957). Similarly, the classification of clay loam and silty clay loam soil cannot be remapped
VOLUME 17
directly. Through personal communication with the Council of Agriculture in Taiwan, the silty clay loam soil is used for the classification. In the updated soil textures, the majority of the areas in Taiwan are classified as silt loam in the western and eastern plains, while near the mountainous areas the land is classified as loamy soils. Near the coastal low-lying regions, there are sandy loam and loamy sand soil types. The corresponding soil parameters are derived based on the observed soil profiles that provide information on percentages of sand, silt, and clay within each soil profile in Taiwan. The total number of observed soil profile datasets is 1394. Based on the percentages of sand, silt, and clay within each soil profile, the soil texture is determined by the texture triangle of the USDA (Miller and White 1998). Next, the percentages of sand, silt, and clay of the same soil textures are averaged to provide the soil particle fractions of the soil classifications defined in the WRF Model. Soil parameters including slope of the retention curve b, saturated metric potential Cs (m), saturation hydraulic conductivity Ks (m s21), and porosity Qs (m3 m23) are derived according to the equations in Cosby et al. (1984) that require information on soil particle fractions (sand, silt, and clay). The calculation of field capacity Qref (m3 m23) and wilting point Qw (m3 m23) are not provided by Cosby et al. (1984) but are computed from the approach of Chen and Dudhia (2001). Table 2 summarizes the averaged soil particle fractions and the derived soil hydraulic parameters for the WRF Model in Taiwan. Figures 1c and 1d are the soil porosity based on the default and updated soil type, respectively, and Fig. 1e is the corresponding difference (positive value indicates that the default value is higher than the value for the updated soil data). Figures 1f–h are for the distributions of the saturation hydraulic conductivity.
3. Description of study period and model configuration a. Study period The simulation period was from 10 August to 12 September 2013. During the study period there were two typhoons that affected the local weather and brought heavy rainfall in Taiwan (Typhoon Trami on 21–22 August and Typhoon Kong-Rey on 28–30 August). Typhoon Kong-Rey battered the island and caused severe flooding in central and southern Taiwan. After the passage of the typhoon, a southwesterly flow was induced, which brought extremely heavy precipitation to the island on 31 August and 1 September
MAY 2016
LIN AND CHENG
1341
FIG. 1. Distributions of soil textures at 3-km resolution in Taiwan from (a) default FAO datasets and (b) updated soil data, the soil porosity based on the lookup table of the (c) default setup and (d) updated soil parameters, (e) the corresponding difference (m3 m23), the saturation hydraulic conductivity based on the lookup table of the (f) default setup and (g) updated soil parameters, and (h) the corresponding difference (1025 m s21).
2013, leading to the most severe flooding event in southern and central Taiwan of the past 40 years. Evaluation of the model simulations with observed precipitation indicated that WRF was able to capture the heavy precipitation in southern Taiwan where the
continuous rainfall caused severe flooding and damage during the Typhoon Kong-Rey episode (Lin and Cheng 2014). From 3 to 11 September 2013, the synoptic wind in Taiwan was dominated by a weak northeasterly monsoonal flow induced by the Asian continental high
1342
JOURNAL OF HYDROMETEOROLOGY
TABLE 1. Mapping of soil textures from TWD97 soil classifications to STATSGO/FAO soil classifications. TWD97
STATSGO/FAO
(S) Sand (CoS) Coarse sand
Sand
(fS) Fine sand (LCoS) Loamy coarse sand (LS) Loamy sand
Loamy sand
(LfS) Loamy fine sand (CoSL) Coarse sandy loam (SL) Sandy loam (fSL) Fine sandy loam
Sandy loam
(vfS) Very fine sand (LvfS) Loamy very fine sand (vfSL) Very fine sandy loam
Loamy sand
(Si) Silt (SiL) Silt loam
Silt loam
(L) Loam
Loam
(SCL) Sandy clay loam
Sandy clay loam
(CL) Clay loam (SiCL) Silty clay loam
Silty clay loam
(SiC) Silty clay
Silty clay
(C) Clay
Clay
(Grv) Gravel
Bedrock
pressure system, and the atmosphere was stable, with very small amounts of rainfall. To examine the impacts of the soil texture and soil moisture variations on the land–atmosphere coupling processes, the evaluation of the model output was conducted and separated into two periods that are associated with distinct atmospheric fields. The first period targets the days from 29 August to 2 September 2013, the Typhoon KongRey period (TY-KR). The second period targets the days from 3 to 11 September when the atmospheric conditions were stable and associated with clear-sky days (DRY1).
b. Model configuration The WRF Model, version 3.5.1 (Skamarock et al. 2008), was deployed to provide the meteorological datasets. The WRF meteorological model is a numerical weather prediction system designed not only for scientific research but also for operational forecasting needs. Figure 2 identifies the study area. The WRF configuration includes four nested domains with horizontal grid spacing of 81, 27, 9, and 3 km. Vertically, there are 49 sigma levels from the surface to the model top set at 100 hPa. The simulations all started at 0000 UTC 10 August 2013 and ended at 0000 UTC 12 September 2013, with 24-h spinup time and a simulated
VOLUME 17
length of 1 month. The initial and boundary conditions for pressure, water vapor, temperature, and wind are from the NCEP FNL data at 18 grid spacing and with 6h time intervals. The sea surface temperature (SST) was updated every 6 h and was also acquired from FNL datasets. The physical packages applied for the WRF simulations include the GCM version of the Rapid Radiative Transfer Model (RRTMG) radiation (Iacono et al. 2008), WRF single-moment 5-class microphysics scheme (WSM5; Hong et al. 2004), the Kain–Fritsch (KF) cumulus parameterization scheme (not used at the 3-km resolution domain; Kain and Fritsch 1993; Kain 2004), the Yonsei University planetary boundary layer (PBL) scheme (Hong et al. 2006), and the revised MM5 surface layer scheme (Jiménez et al. 2012). The Noah LSM (Chen and Dudhia 2001) was chosen for the simulation of the surface evapotranspiration and runoff processes. The analysis nudging approach was applied above the boundary layer for wind, temperature, and water vapor to allow for large-scale forcing to be used to nudge the model simulation toward the reanalysis field at the 81-, 27-, and 9-km domains but not at the 3-km domain. The land-use data were taken from the 2007 reclassified Moderate Resolution Imaging Spectroradiometer (MODIS) land-use datasets that were maintained by the National Aeronautics and Space Administration (NASA) Land Processes Distributed Active Archive Center (LP DAAC). The application of the updated MODIS land-use data has shown improved results for the WRF simulations in Taiwan (Cheng et al. 2013). In addition, we updated the monthly MODIS Fractional Photosynthetically Active Radiation (FPAR) vegetation fraction (Kumar et al. 2014), which was developed by the Central Weather Bureau (CWB) of Taiwan and NCAR. Three WRF simulations were conducted. The first WRF simulation was conducted without any update (WRF-base) for which the initial soil moisture is provided by NCEP FNL data. In the second WRF sensitivity test, the soil moisture from GLDAS was utilized to provide the soil moisture initialization process (WRFGLDAS). The third WRF sensitivity test was applied with GLDAS and updated soil textures and soil parameters (WRF-GSOIL). Table 3 summarizes the designs of the three WRF sensitivity tests.
4. Model simulation results a. Impacts of soil moisture initialization process The simulation results from WRF-base and WRFGLDAS are compared to illustrate the influence of soil
MAY 2016
1343
LIN AND CHENG
TABLE 2. Updated soil hydraulic parameters. Variable N is the number of the observed soil profiles used for the estimation, Sf is sand fraction (%), Sif is silt fraction (%), and Cf is clay fraction (%). Soil parameters include slope of the retention curve (i.e., b), saturated metric potential (i.e., Cs ; m), saturation hydraulic conductivity (i.e., Ks ; m s21), porosity (i.e., Qs ; m3 m23), field capacity (i.e., Qref ; m3 m23), and wilting point (i.e., Qw ; m3 m23). Soil types
N
Sf (%)
Sif (%)
Cf (%)
b
Cs
Ks (1026)
Qs
Qref
Qw
Sand Loamy sand Sandy loam Silt loam Silt Loam Sandy clay loam Silty clay loam Clay loam Sandy clay Silty clay Clay
8 22 252 231 5 373 90 187 139 4 47 36
90.86 84.90 62.90 22.39 8.28 40.13 60.11 13 32.63 58.82 8.79 27.32
5.52 10.30 25.40 58.78 81.07 40.84 20.71 54.7 37.55 11.26 48.46 30.42
3.62 4.80 11.7 18.83 10.56 19.03 19.18 32.30 29.82 29.92 42.75 42.26
3.49 3.68 4.77 5.90 4.59 5.94 6.00 8.11 7.59 7.67 9.70 9.60
0.050 0.059 0.114 0.386 0.591 0.226 0.123 0.513 0.287 0.128 0.583 0.334
22.6 18.4 8.45 2.03 1.23 3.79 7.71 1.46 2.87 7.34 1.25 2.4
0.375 0.382 0.410 0.461 0.479 0.438 0.413 0.473 0.448 0.415 0.478 0.455
0.234 0.244 0.289 0.360 0.365 0.335 0.308 0.394 0.362 0.326 0.410 0.383
0.017 0.021 0.043 0.080 0.067 0.070 0.060 0.113 0.095 0.080 0.131 0.117
moisture initialization processes on land surface hydrologic processes and their subsequent impact on the atmospheric conditions.
1) SPATIAL DISTRIBUTION Since the near-surface soil moisture plays a leading role in the energy and water interactions between the land surface and the atmosphere, the simulated top 10-cm soil moisture is compared between the WRF-base and the WRF-GLDAS runs. The volumetric soil water content is defined as the ratio of the volume of water to the total volume of soil, water, and air pores. Figure 3 reveals spatial distributions of volumetric soil moisture (m3 m23) for the top soil layer (10 cm thickness) at initial time (0000 UTC 10 August 2013) from the NCEP FNL
data, GLDAS data, and the corresponding differences between NCEP FNL and GLDAS dataset (negative value indicates that the NCEP FNL value is higher than the value for the GLDAS data; applied for all the difference plots) at 3-km grid resolution. The distribution of the initial soil moisture fields from NCEP FNL reanalysis data is noticeably higher than that from the GLDAS. The averaged soil moisture values over the Taiwan area are 0.40 and 0.28 m3 m23 from the NCEP FNL and the GLDAS, respectively. The soil moisture from the NCEP FNL data shows homogeneous distributions with 18 spatial resolution in accordance with the global model setup, whereas the GLDAS products with 0.258 resolution illustrate the heterogeneous distributions with high values over the mountainous areas and
FIG. 2. (left) The WRF Model simulation domain. (right) The locations of Yongkang and Taichung observations. The contour line indicates the terrain height.
1344
JOURNAL OF HYDROMETEOROLOGY TABLE 3. Design of WRF sensitivity tests.
Experiment designs
Soil moisture initialization
Soil textures
WRF-base WRF-GLDAS WRF-GSOIL
NCEP FNL GLDAS GLDAS
STATSGO/FAO STATSGO/FAO TWD97
low values over the low-lying plains. The largest difference of soil moisture occurs in the western plain areas, while the difference over the central mountainous areas is less apparent. The GLDAS products more accurately represent the soil moisture conditions over the island of Taiwan, showing wet soil conditions over central mountainous areas and dry soil conditions over the surrounding low-lying plains. Similar findings may be seen in Hung et al. (2014), whose study indicated that the soil moisture from the NCEP Global Forecast System was much more pluvial than the HRLDAS results. Figure 4 is the distribution of simulated soil moisture water content averaged from the hourly WRF outputs from 11 August to 11 September 2013. The spatial distributions of soil moisture from the two WRF simulations are in accordance with the distribution of soil textures provided from the WRF Model, that is, the FAO dataset. Overall, the WRF-GLDAS simulates lower soil moisture than the WRF-base in most of the regions, with major differences occurring in the western low-lying plain areas. Figure 5 displays the distribution
VOLUME 17
of simulated SHF and LHF averaged for the entire simulation period from 11 August to 11 September 2013. Over the surrounding low-lying plains, the reduced soil moisture from WRF-GLDAS is significant, which indicates that less water can be transferred to the near-surface atmosphere, leading to confined energy available for ET and the decrease of LHF. As a result, more energy can be used to increase SHF and the nearsurface temperature. The GLDAS data indicate dry soil conditions over the surrounding low-lying plains that in turn reduce the ET. This is to be expected, since soil moisture controls the ET under a soil moisture–limited regime, particularly over dry soil conditions. The soil moisture–limited regime refers to the regimes where changes in soil moisture strongly affect ET (Koster et al. 2009). Yet, over the mountainous areas where the soil condition is wet, there is often a weak relationship between soil moisture and ET. The WRF-GLDAS shows slightly lower LHF and higher SHF over the mountains. Figure 6 shows the distributions of 2-m air temperature and 10-m wind fields. The domain-wide mean, maximum, and minimum values are also estimated and indicated. The temperature increases over the area where the soil moisture is significantly reduced. The maximum increase of the averaged temperature over the study area is around 0.35 K throughout the simulation period. The temperature contrast between the WRF-base and WRF-GLDAS may change the development of local
FIG. 3. The top-layer (0–10 cm) soil moisture (m3 m23) at 0000 UTC 10 Aug 2013 from (a) NCEP FNL, (b) GLDAS, and (c) the corresponding difference.
MAY 2016
LIN AND CHENG
1345
FIG. 4. The top-layer (0–10 cm) soil moisture (m3 m23), averaged between 11 Aug and 11 Sep 2013, from (a) WRF-base, (b) WRF-GLDAS, and (c) the corresponding difference.
circulation. Throughout the simulation period, the circulation is mainly dominated by the synoptic northeasterly wind. The local circulation such as the onshore/offshore flow is embedded in the prevailing flow and can still be formed with the apparent land–sea temperature gradient (Cheng et al. 2015). In addition, the drier land conditions might enhance the local heating and strengthen the convective activity that in turn intensifies the horizontal transport. The difference plot indicates the existence of the onshore flow in southwestern Taiwan. The WRF-GLDAS shows stronger onshore flow than the WRF-base, particularly in southwestern Taiwan, because of the enhancement of the land–sea temperature gradient. The maximum enhancement of the averaged wind speed reaches 0.19 m s21.
2) DIFFERENCES Table 4 quantifies the differences of total soil moisture content, ground temperature, 2-m temperature, 2-m mixing ratio, LHF, SHF, total ET (canopy water evaporation, direct soil evaporation, and plant transpiration), lifting condensation level (LCL), PBL height, precipitation, and surface/subsurface runoff between the WRF-base and WRF-GLDAS simulation (positive value indicates that the WRF-base value is higher than the WRFGLDAS value). The difference is calculated for the whole study period, TY-KR, and DRY1 period and
averaged over the grid points of the Taiwan area. As indicated previously, overall the WRF-GLDAS simulated lower soil moisture than the WRF-base run. Among all the variables, the WRF-GLDAS shows a higher reduction in the soil moisture and surface and subsurface runoff throughout the TY-KR period than that of the DRY1 period. For ground temperature, 2-m temperature, LHF, SHF, and PBL height, the variations between the two simulations are more sensitive in the DRY1 period, indicating soil moisture–atmosphere interaction is stronger in the dry atmosphere when the ET is constrained by soil moisture than in the wet atmosphere. The energy fluxes in response to the initial reduction of soil moisture show a decrease of LHF in the WRF-GLDAS run. Among the three components of the total ET, the direct evaporation from bare soil shows the largest reduction. Over the 1-month simulation, the canopy-intercepted water evaporation is slightly increased because the atmospheric environment with higher temperature is more suitable for evaporation, resulting in higher potential ET but lower actual ET and LHF. The reduction of the LHF and increase of SHF cause the decrease of the 2-m mixing ratio and increase of the ground temperature and 2-m temperature. The drier and warmer land conditions might strengthen the local heating of PBL and enhance the atmospheric
1346
JOURNAL OF HYDROMETEOROLOGY
VOLUME 17
FIG. 5. (top) LHF (W m22) and (bottom) SHF (W m22) averaged between 11 Aug and 11 Sep 2013 for the WRF-base, WRF-GLDAS, and the corresponding difference.
instability, and, in turn, elevate the PBL and LCL height and subsequently affect the precipitation amounts. The precipitation increases in the TY-KR episode and also throughout the 1-month simulation; however, it decreases in DRY1 episode. Throughout the 1-month simulation, the WRF-GLDAS simulates less soil water content than the WRF-base over Taiwan, leading to a decrease of LHF and lowlevel moisture and an increase of SHF, near-surface air temperature, PBL height, LCL, and precipitation. The increase of precipitation indicates a negative soil moisture– precipitation feedback loop, that is, the decrease of soil moisture results in an increase of precipitation. The process involved in understanding the relationships of soil moisture and precipitation is complex, and several
modeling studies suggested that under specific conditions convective instability and/or cloud formation may be stronger over dry soils (Seneviratne et al. 2010). Dry initial soil moisture conditions yield more vigorous thermals (owing to stronger daytime heating), which can more easily break through the stable air barrier and lead to deep convection and ultimately to a negative soil moisture–precipitation feedback loop (Hohenegger et al. 2009). Yet, the above discussion cannot be applied to the DRY1 episode for which the precipitation decreases in the WRF-GLDAS run. In other words, a positive soil moisture–precipitation feedback loop is simulated in the DRY1 episode. According to Koster and Suarez (2001), the reduction of soil moisture could produce lower ET, which in turn reduces the intensity of precipitation
MAY 2016
1347
LIN AND CHENG
FIG. 6. (top) The 2-m temperature (8C) and (bottom) 10-m wind fields (m s21) averaged between 11 Aug and 11 Sep 2013. (left) The WRF-base and (right) the corresponding differences (WRF-GLDAS minus WRF-base). The values of domain-wide mean, max, and min are indicated.
through both local recycling and modifications in the large-scale circulation. In fact, in the DRY1 episode the availability of atmospheric moisture that can form the precipitation is limited, and with reduced soil moisture in the WRF-GLDAS run, the intensity of precipitation would decrease in the DRY1 episode. Based on the previous analysis, a negative soil moisture–precipitation feedback loop is seen under wet atmospheric conditions while a positive soil moisture– precipitation feedback loop is simulated under dry atmospheric conditions in the area of Taiwan. The analysis conducted for the TY-KR and DRY1 period indicates
the land–atmosphere interaction is more significant in DRY1 than in the TY-KR period.
3) SURFACE WATER BUDGETS Figure 7 illustrates the analysis of surface water budgets to understand the variations of land surface hydrologic processes due to the change of soil moisture initializations. The integrated surface water budgets can be expressed as follows: dS 5 P 2 E 2 R. dt
(1)
1348
JOURNAL OF HYDROMETEOROLOGY
VOLUME 17
TABLE 4. Differences of hydrometeorological variables between WRF-base and WRF-GLDAS. Difference is calculated over the Taiwan area and averaged for whole, TY-KR, and DRY1 periods. Number in parentheses indicates the relative changes in percentages. Variables
Whole
TY-KR
DRY1
Total soil moisture content (mm) Ground temperature (K) 2-m temperature (K) 2-m mixing ratio (g kg21) LHF (W m22) SHF (W m22) Canopy water evaporation (W m22) Direct soil evaporation (W m22) Plant transpiration (W m22) LCL (m) PBL height (m) Precipitation (mm h21) Surface runoff (mm h21) Subsurface runoff (mm h21)
273.863 (29.82%) 0.138 (0.046%) 0.046 (0.015%) 20.077 (20.46%) 23.956 (24.03%) 2.691 (7.70%) 0.085 (0.53%) 22.928 (216.72%) 21.132 (21.95%) 10.858 (1.62%) 5.345 (1.61%) 0.027 (2.21%) 20.061 (28.32%) 20.152 (236.24)
232.330 (24.12%) 20.0001 (20.0001%) 0.003 (0.001%) 20.024 (20.15%) 20.598 (20.90%) 20.121 (21.09%) 20.029 (20.13%) 20.354 (22.70%) 20.216 (20.89%) 12.119 (1.82%) 1.647 (0.46%) 0.062 (1.66%) 20.091 (23.85%) 20.144 (216.20%)
213.097 (21.77%) 0.048 (0.016%) 0.019 (0.006%) 20.023 (20.15%) 20.814 (20.76%) 0.765 (1.68%) 20.080 (20.86%) 20.863 (24.61%) 0.123 (20.17%) 4.638 (0.59%) 2.890 (0.90%) 20.003 (21.57%) 20.001 (21.66%) 20.030 (211.37%)
Here, dS/dt represents the changes of soil water storage in the soil column (total soil depth is 2000 mm), P is the precipitation, E is ET, and R is the total runoff, including surface runoff and subsurface drainage. The surface runoff is given as the excess of precipitation (the sum of the precipitation not intercepted by the canopy and the dripping from the interception reservoir) not infiltrated into the soil and calculated by a simple water balance (SWB) scheme (Schaake et al. 1996). The 1-m soil layer underneath serves as a reservoir with a gravitational free-drainage mechanism that generates the subsurface runoff at the bottom soil layer. Analysis of the surface water budgets was conducted for the mountainous area and the surrounding low-lying plains. Figures 7a and 7b depict the hourly variations of individual terms in the surface water budget equation from the WRF-base run throughout the study periods. Figure 7a is averaged from the grid points with a terrain height lower than 300 m (surrounding low-lying plains) while Fig. 7b is averaged from the grid points with a terrain height greater than 300 m (mountainous areas). The changes in the storage term appear negative because of the water loss of ET and the runoff process throughout the simulation period, except for the rainfall days and the two typhoon events (Typhoon Trami on 21–22 August and Typhoon Kong-Rey from 29 August to 1 September). The variation of the surface water budget terms is stronger in the mountainous area than the surrounding low-lying plains because of the increased amounts of rainfall and a higher occurrence of the rainfall events over the mountainous area throughout the simulation episode. Figures 7c and 7d are the corresponding difference between the WRF-base and WRF-GLDAS run. The amplitude of ET is less apparent compared to other
terms, so ET is multiplied by 10 in Figs. 7c and 7d. As discussed earlier, the soil is drier in the WRF-GLDAS than the WRF-base. During the first few days of the simulation episode, the WRF-GLDAS shows lower ET and runoff processes than the WRF-base because of the drier soil conditions. The storage of soil water accumulates faster in the WRF-GLDAS run in response to the reduced ET and runoff processes. Over the surrounding low-lying plains, there is apparent increase of rainfall amounts that indicates a negative soil moisture–precipitation feedback loop. As indicated previously, the drier soil conditions might enhance the atmospheric instability and lead to the increase of rainfall. When the increase of precipitation becomes apparent, the runoff and storage term is also enhanced in WRF-GLDAS run. Over the mountainous area, the difference between the two simulations is smaller because the reduction of soil moisture is less compared to the surrounding lowlying plains. Most of the time, the WRF-GLDAS shows lower ET and runoff and higher accumulation of storage of soil water than the WRF-base run, except for the TY-KR period. Overall, the precipitation increases in the WRF-GLDAS simulation. Toward the end of the simulation period when the atmosphere is dry, the difference of surface water budget terms became less apparent between the two simulations.
b. Impact of updated soil textures The impact of the updated soil types is discussed by comparing the WRF-GLDAS and WRF-GSOIL simulation results. Both simulations utilized the GLDAS data to initialize the soil moisture; however, the WRFGLDAS used the default FAO soil data, while the
MAY 2016
LIN AND CHENG
1349
FIG. 7. The hourly variations of individual processes in surface water budget equation (mm h21) averaged from the grid points with the terrain height (a) lower than 300 m and (b) higher than 300 m from WRF-base run. (c),(d) The corresponding differences (WRFGLDAS minus WRF-base). Please be aware that the magnitude of the variation is different between panels (c) and (d). ET is multiplied by 10 in (c) and (d). Yellow line is change in soil water storage, red line is precipitation, black line is ET, and blue line is total runoff.
WRF-GSOIL used the updated soil textures and the corresponding soil parameters (Table 2) to provide the soil type information. In the WRF–Noah model, the soil’s physical and hydraulic parameters are supplied through a soil lookup table. In the following, comparisons between the WRF-GLDAS and WRF-GSOIL emphasize the impact of soil textures and soil parameters and only compare the DRY1 period when the land–atmosphere interaction is more sensitive to the soil conditions. Figure 8 shows the distributions of top-layer (0–10 cm soil depth) and bottom-layer soil (100–200 cm soil depth) moisture averaged from 3 to 11 September 2013 (DRY1 period). The distributions of soil moisture in each simulation closely follow the soil texture classifications. The difference of soil moisture resembles the corresponding soil hydraulic parameters, such as the soil porosity and the saturation hydraulic conductivity (see Fig. 1). According to the default FAO soil data, in the areas where the soil type is classified as sandy clay loam (gray color in Fig. 1a), the WRF-GSOIL shows higher soil moisture in the top and bottom soil layers when compared to the WRF-GLDAS run. A sandy clay loam soil is associated with coarse soil particles and a higher fraction of sand. With the usage of updated soil classifications, the sandy clay loam soil is replaced with the
smaller particle size of soil types such as the loamy soils (red color in Fig. 1b). Loamy soils have a higher soil porosity, field capacity, and lower sand fraction and soil conductivity than sandy clay loam soils; as a result, water infiltrates more rapidly into the sandy clay loam soils and drains rapidly throughout the soil column as subsurface runoff, which reduces the soil water contents. In western Taiwan, the soil type is classified as the clay loam soil (purple color in Fig. 1a) based on the default FAO soil data; yet, in the updated soil data, some areas are classified as silt loam soil (blue color in Fig. 1b) and some are classified as loam soil (red color in Fig. 1b). The simulated soil moisture in the WRF-GSOIL is lower in the top and bottom soil layers than the WRF-GLDAS simulation. Compared to the clay loam soil, the silt loam soil or loam soil is associated with coarser soil particles. Generally, soil textures with coarser particle sizes have higher soil conductivity; as a result, water infiltrates more rapidly from the top to the bottom soil layers, which leads to reduced soil moisture in the top and bottom soil layer in western Taiwan from the WRF-GSOIL run. Figure 9 shows the differences of runoff (surface and subsurface), LHF, SHF, and 2-m temperature between the WRF-GLDAS and WRF-GSOIL simulations. The difference in the runoff resembles the pattern of the
1350
JOURNAL OF HYDROMETEOROLOGY
VOLUME 17
FIG. 8. (a) Top-layer soil moisture and (b) bottom-layer soil moisture averaged for the DRY1 period for the WRF-GLDAS, WRF-GSOIL, and the corresponding differences. The values of domain-wide mean, max, and min are indicated.
difference in the hydraulic conductivity (see Fig. 1h). The difference in the LHF resembles the difference of soil moisture (see Fig. 8). In western Taiwan, with decreased soil moisture, the uptake of the soil moisture through the vegetation evapotranspiration process is also lowered, which in turn reduces the LHF and consequently warms the low-level atmosphere. The distribution of the SHF is in the opposite direction to that of the LHF.
c. Evaluation using the observed data Last, the assessment of the simulation results with the observation data is conducted. For the evaluations of the
near-surface meteorological variables, overall the comparison illustrates a reasonable reproduction of model outputs (Lin and Cheng 2014). The evaluation does not show significant differences in terms of the near-surface temperature and wind fields among the three simulations. Here, we mainly focus on the comparison at Taichung and Yongkang sites, where the observed soil moisture is available and of good quality (see Fig. 2b for site locations). Figure 10 compares the soil moisture between observations, the WRF-base, WRF-GLDAS, and WRF-GSOIL simulations at Taichung and Yongkang sites. The comparison is made at the top (10 cm) and
MAY 2016
LIN AND CHENG
1351
FIG. 9. Difference of (a) runoff, (b) LHF, (c) SHF, and (d) 2-m temperature between WRF-GLDAS and WRF-GSOIL (WRF-GSOIL minus WRF-GLDAS) averaged for the DRY1 period.
second (30 cm) soil layer. The WRF-GLDAS and WRF-GSOIL with the use of the GLDAS data show considerably lower soil moisture than the WRF-base simulation and agree better with the observed data, while the WRF-base shows a systematic wet value of soil moisture throughout the simulation periods. The too-wet initial soil moisture condition from the FNL reanalysis data is also indicated in Hung et al. (2014). At both Taichung and Yongkang sites, the soil type changes from a clay loam to a loam soil. A loam soil is
associated with coarser soil particles than a clay loam soil; as a result, soil water drains more rapidly in a loam soil than in a clay loam soil, which results in the reduced soil moisture at the top and second soil layers in the WRF-GSOIL simulation. The difference is enlarged when the atmosphere and soil are in a dry condition. In both stations, the gradual drying process after the heavy precipitation is not well captured in all simulations. Possible reasons for simulated biases may be due to the dominant land-use classification at 3-km grid spacing. At
FIG. 10. The time series comparisons of (top) top-layer soil moisture (10 cm) and (bottom) second-layer soil moisture (30 cm) from observations and simulations at the (left) Taichung and (right) Yongkang sites. Black circles are observations, green dotted line is WRF-base, yellow dashed line is WRF-GLDAS, and blue dot–dashed line is WRF-GSOIL.
1352
JOURNAL OF HYDROMETEOROLOGY
VOLUME 17
FIG. 11. The time series comparisons of (top) 2-m temperature, (middle) 10-m wind speed, and (bottom) wind direction at the (left) Taichung and (right) Yongkang sites. Black circles are observations, green dotted line is WRF-base, yellow dashed line is WRF-GLDAS, and blue dot–dashed line is WRF-GSOIL.
these two sites, the dominant land-use types are both classified as an urban type, which results in extremely low ET (approaching zero). With the low ET, the soil moisture can accumulate within the soil layers, which may contribute to the wet bias of the soil moisture. To improve the ET processes over a heterogeneous urban/ suburban area, the subgrid-scale variability in landcover composition needs to be considered. A mosaic/ tiling approach associated with an urban canopy model proposed in Li et al. (2013) may be helpful; however, that is beyond the scope of this study. In addition, the soil parameters computed based on the statistical formulas from soil particle fractions might also induce biases. Yet, WRF-GSOIL shows the best agreement overall with the observed pattern. Figure 11 compares the surface temperature and wind fields at the Yongkang and Taichung sites. Although there is an apparent difference in terms of soil water content, the difference of the near-surface meteorological fields is not that significant among the three WRF simulations at the individual stations. There is overestimation of the 2-m temperature and wind speed at Taichung station; yet all the WRF simulations agree well with the observed data at Yongkang station. For the
wind flow, the variations of the wind direction are better captured in WRF-GLDAS and WRF-GSOIL than in the WRF-base run.
5. Conclusions To investigate the effects of soil textures and soil moisture initialization on the land surface hydrologic process and its subsequent impact on land–atmosphere interactions, the WRF–Noah framework, which included the realistic and physical land surface processes, was conducted from 10 August to 12 September 2013. To provide a proper soil moisture initialization process for the regional numerical weather modeling systems, the soil moisture from GLDAS products was utilized to provide the optimal soil states. The soil moisture from GLDAS products is lower and has higher heterogeneous distributions than the data provided from the NCEP FNL data; however, the difference of soil moisture is trivial over the mountainous area. Over the surrounding low-lying plains, there is a significant decrease of soil moisture in the WRF-GLDAS at the initial time that would control the variation of the ET when under a soil moisture–limited regime; however,
MAY 2016
1353
LIN AND CHENG
over the mountainous areas where the soil condition is wet, there is often a weak relationship between soil moisture and ET, and the land–air exchanging process is less apparent. The WRF-GLDAS run can reproduce the temporal variations of soil moisture and agreed better with the observed data; however, the control run that uses the FNL reanalysis data to initialize the soil moisture shows a systematic wet value of soil moisture throughout the simulation period. The WRFGLDAS in response to the reduction of soil moisture results in lower LHF; higher SHF; and higher temperature, LCL, and PBL height than the WRF-base run, which also affects the precipitation amounts. The precipitation increases in the TY-KR episode and also throughout the 1-month simulation; however, it decreases in the DRY1 episode. In our study, a negative soil moisture–precipitation feedback loop is simulated under wet atmospheric conditions while a positive soil moisture–precipitation feedback loop is seen under dry atmospheric conditions. The updated soil textures and soil parameters based on field surveys are also adopted to improve the soil classifications in Taiwan for the WRF system. The importance of soil textures in the land surface hydrologic process lies in the determination of the soil’s physical and hydraulic properties. The distribution of soil moisture closely follows the patterns of soil types in the WRF Model. The soil textures with large-sized soil particles reveal higher soil conductivity; as a result, water infiltrates into the land surface and drains rapidly through the soil column, which produces a higher subsurface runoff than that from soil textures with fine-sized soil particles. Evaluation with the observed datasets indicates that WRF-GSOIL can better reproduce the variations of the soil moisture. The explicit consideration of the more realistic soil moisture data for the initialization process and fieldsurvey-based soil texture data in the WRF Model increases the spatial variability of soil moisture, which in turn influences the LHF; SHF; near-surface temperature, wind, and moisture; PBL height; and precipitation, which merits further applications in water resources in the era of climate change and will be considered in future work. The current study of a 1-month simulation focused on the short-term weather events and subseasonal time scale, which included two typhoon-induced precipitation episodes and a series of clear-sky days. Undoubtedly, a longer period with multiyear simulations is needed to assess the climatology changes and their statistical significance. However, the purpose of this study is to offer a prompt way to resolve the problems when using soil moisture data provided from a global model for soil initialization
in a short-term weather forecast modeling system and, meanwhile, to understand the impact of soil moisture variation due to the soil moisture initialization and soil textures on the land–atmosphere interactions in the area of Taiwan. Efforts are currently being made to improve the land surface data assimilation and hydrological processes in the WRF-Hydro modeling system (Gochis et al. 2013) for long-term simulations. For instance, the treatment of runoff processes in the WRF Model with Noah LSM is oversimplified and does not consider the physical three-dimensional flows (surface and subsurface lateral water transport and groundwater effects) in the local soil water budgets. With this deficiency, the distribution of soil moisture is too homogeneous and incorrect, which feeds back to the development of the atmospheric boundary layer, turbulent fluxes, and precipitation; however, over the complex topography and mountainous areas in Taiwan, the topology-induced lateral movement of soil water becomes significant and cannot be ignored in progressively finer-scale simulations (Lin and Cheng 2014). These long-term simulations will be conducted in the future to study the influence of the more realistic representation of initial soil states, soil physical and hydraulic properties, and subgrid-scale hydrological responses on the simulated soil moisture and meteorological model forecast. Acknowledgments. This study was conducted under the research project entitled ‘‘Development of high resolution atmospheric modeling and long-term atmospheric data sets in Taiwan and East Asia,’’ supported by the National Science Council, Taiwan, under Grant MOST 103-2621-M-008-003. We thank the National Center for High-Performance Computing (NCHC) of Taiwan for providing computational resources and storage resources. We also thank the Central Weather Bureau in Taiwan for providing the surface station data sets and Professor Ben-Jei Tsuang at National Chung-Hsing University for providing the observed soil moisture datasets. REFERENCES Cassardo, C., S. K. Park, B. M. Thakuri, D. Priolo, and Y. Zhang, 2009: Soil surface energy and water budgets during a monsoon season in Korea. J. Hydrometeor., 10, 1379–1396, doi:10.1175/ 2009JHM1101.1. Chen, F., and J. Dudhia, 2001: Coupling an advanced land-surface hydrology model with the Penn State–NCAR MM5 modeling system. Part I: Model implementation and sensitivity. Mon. Wea. Rev., 129, 569–585, doi:10.1175/1520-0493(2001)129,0569: CAALSH.2.0.CO;2. ——, and Coauthors, 1996: Modeling of land-surface evaporation by four schemes and comparison with FIFE observations. J. Geophys. Res., 101, 7251–7268, doi:10.1029/95JD02165.
1354
JOURNAL OF HYDROMETEOROLOGY
Cheng, F.-Y., Y. C. Hsu, P. L. Lin, and T. H. Lin, 2013: Investigation of the effects of different land use and land cover patterns on mesoscale meteorological simulations in the Taiwan area. J. Appl. Meteor. Climatol, 52, 570–587, doi:10.1175/ JAMC-D-12-0109.1. ——, S.-P. Jian, Z.-M. Yang, B.-J. Tsuang, and M.-C. Yen, 2015: Impact of regional climate changes on meteorological characteristics and their subsequent effect on ozone dispersion in Taiwan. Atmos. Environ., 103, 66–81, doi:10.1016/ j.atmosenv.2014.12.020. Cosby, B. J., G. M. Hornberger, R. B. Clapp, and T. R. Ginn, 1984: A statistical exploration of the relationships of soil moisture characteristics to the physical properties of soils. Water Resour. Res., 20, 682–690, doi:10.1029/WR020i006p00682. Dai, Y., and Coauthors, 2003: The Common Land Model (CLM). Bull. Amer. Meteor. Soc., 84, 1013–1023, doi:10.1175/ BAMS-84-8-1013. Dirmeyer, P. A., X. Gao, M. Zhao, Z. Guo, T. Oki, and N. Hanasaki, 2006: GSWP-2: Multimodel analysis and implications for our perception of the land surface. Bull. Amer. Meteor. Soc., 87, 1381–1397, doi:10.1175/BAMS-87-10-1381. Gao, Y., and Coauthors, 2008: Enhancement of land surface information and its impact on atmospheric modeling in the Heihe River basin, northwest China. J. Geophys. Res., 113, D20S90, doi:10.1029/2008JD010359. Gochis, D. J., W. Yu, and D. N. Yates, 2013: The WRF-Hydro Model technical description and user’s guide, version 1.0. NCAR Tech. Doc., 120 pp. [Available online at https:// www.ral.ucar.edu/projects/wrf_hydro.] Hansen, M. C., R. S. DeFries, J. R. G. Townshend, and R. Sohlberg, 2000: Global land cover classification at 1 km spatial resolution using a classification tree approach. Int. J. Remote Sens., 21, 1331–1364, doi:10.1080/014311600210209. Hohenegger, C., P. Brockhaus, S. Christopher, and C. Schär, 2009: The soil moisture–precipitation feedback in simulations with explicit and parameterized convection. J. Climate, 22, 5003–5020, doi:10.1175/2009JCLI2604.1. Hong, S. B., V. Lakshmi, E. E. Small, F. Chen, M. Tewari, and K. W. Manning, 2009: Effects of vegetation and soil moisture on the simulated land surface processes from the coupled WRF/Noah model. J. Geophys. Res., 114, D18118, doi:10.1029/2008JD011249. Hong, S.-Y., J. Dudhia, and S.-H. Chen, 2004: A revised approach to ice microphysical processes for the bulk parameterization of clouds and precipitation. Mon. Wea. Rev., 132, 103–120, doi:10.1175/1520-0493(2004)132,0103:ARATIM.2.0.CO;2. ——, Y. Noh, and J. Dudhia, 2006: A new vertical diffusion package with explicit treatment of entrainment processes. Mon. Wea. Rev., 134, 2318–2341, doi:10.1175/MWR3199.1. Hung, Y.-C., J.-S. Hong, C.-L. Tsay, M. Barlage, and F. Chen, 2014: Evaluation of the High Resolution Land Data Assimilation System [in Chinese]. Atmos. Sci., 42, 29–47. Husain, S. Z., S. Bélair, and S. Leroyer, 2014: Influence of soil moisture on urban microclimate and surface-layer meteorology in Oklahoma City. J. Appl. Meteor. Climatol., 53, 83–98, doi:10.1175/JAMC-D-13-0156.1. Iacono, M. J., J. S. Delamere, E. J. Mlawer, M. W. Shephard, S. A. Clough, and W. D. Collins, 2008: Radiative forcing by longlived greenhouse gases: Calculations with the AER radiative transfer models. J. Geophys. Res., 113, D13103, doi:10.1029/ 2008JD009944. Jiménez, P. A., J. Dudhia, J. F. González-Rouco, J. Navarro, J. P. Montávez, and E. García-Bustamante, 2012: A revised scheme
VOLUME 17
for the WRF surface layer formulation. Mon. Wea. Rev., 140, 898–918, doi:10.1175/MWR-D-11-00056.1. Kain, J. S., 2004: The Kain–Fritsch convective parameterization: An update. J. Appl. Meteor., 43, 170–181, doi:10.1175/ 1520-0450(2004)043,0170:TKCPAU.2.0.CO;2. ——, and J. M. Fritsch, 1993: Convective parameterization for mesoscale models: The Kain–Fritsch scheme. The representation of cumulus convection in numerical models. The Representation of Cumulus Convection in Numerical Models, Meteor. Monogr., No. 46, Amer. Meteor. Soc., 165–170. Koren, V., J. Schaake, K. Mitchell, Q.-Y. Duan, and F. Chen, 1999: A parameterization of snowpack and frozen ground intended for NCEP weather and climate models. J. Geophys. Res., 104, 19 569–19 585, doi:10.1029/1999JD900232. Koster, R. D., and M. J. Suarez, 1992: Modeling the land surface boundary in climate models as a composite of independent vegetation stands. J. Geophys. Res., 97, 2697–2715, doi:10.1029/91JD01696. ——, and ——, 1996: Energy and water balance calculations in the Mosaic LSM. NASA Tech. Memo. 104606, Vol. 9, 60 pp. [Available online at http://gmao.gsfc.nasa.gov/pubs/ docs/Koster130.pdf.] ——, and ——, 2001: Soil moisture memory in climate models. J. Hydrometeor., 2, 558–570, doi:10.1175/ 1525-7541(2001)002,0558:SMMICM.2.0.CO;2. ——, and Coauthors, 2004: Regions of strong coupling between soil moisture and precipitation. Science, 305, 1138–1140, doi:10.1126/science.1100217. ——, and Coauthors, 2006: GLACE: The Global Land–Atmosphere Coupling Experiment. Part I: Overview. J. Hydrometeor., 7, 590–610, doi:10.1175/JHM510.1. ——, S. D. Schubert, and M. J. Suarez, 2009: Analyzing the concurrence of meteorological droughts and warm periods, with implications for the determination of evaporative regime. J. Climate, 22, 3331–3341, doi:10.1175/2008JCLI2718.1. Kumar, A., F. Chen, M. Barlage, M. B. Ek, and D. Niyogi, 2014: Assessing impacts of integrating MODIS vegetation data in the Weather Research and Forecasting (WRF) Model coupled to two different canopy-resistance approaches. J. Appl. Meteor. Climatol, 53, 1362–1380, doi:10.1175/ JAMC-D-13-0247.1. Lam, J. S. L., A. K. H. Lau, and J. C. H. Fung, 2006: Application of refined land-use categories for high resolution mesoscale atmospheric modeling. Bound.-Layer Meteor., 119, 263–288, doi:10.1007/s10546-005-9027-3. LeMone, M. A., F. Chen, J. G. Alfieri, M. Tewari, B. Geerts, Q. Miao, R. L. Grossman, and R. L. Coulter, 2007: Influence of land cover and soil moisture on the horizontal distribution of sensible and latent heat fluxes in southeast Kansas during IHOP_2002 and CASES-97. J. Hydrometeor., 8, 68–87, doi:10.1175/JHM554.1. Leung, K.-W., and T.-T. Chen, 1957: Soils of Taiwan. J. Agric. Assoc. China, 20, 1–25. Li, D., E. Bou-Zeid, M. Barlage, F. Chen, and J. A. Smith, 2013: Development and evaluation of a mosaic approach in the WRF–Noah framework. J. Geophys. Res. Atmos., 118, 11 918–11 935, doi:10.1002/2013JD020657. Liang, X., D. P. Lettenmaier, E. F. Wood, and S. J. Burges, 1994: A simple hydrologically based model of land surface water and energy fluxes for GSMs. J. Geophys. Res., 99, 14 415–14 428, doi:10.1029/94JD00483. ——, ——, and ——, 1996: One-dimensional statistical dynamic representation of subgrid spatial variability of precipitation in
MAY 2016
LIN AND CHENG
the two-layer variable infiltration capacity model. J. Geophys. Res., 101, 21 403–21 422, doi:10.1029/96JD01448. Lin, T. S., and F. Y. Cheng, 2014: Effects of land surface hydrological processes on soil moisture and its coupled impact on the meteorological characteristics. 11th Annual Meeting of the Asia Oceania Geosciences Society, Sapporo, Japan, AOGS, HS08-A011. Mahanama, S. P. P., R. D. Koster, R. H. Reichle, and L. Zubair, 2008: The role of soil moisture initialization in subseasonal and seasonal streamflow predictability: A case study in Sri Lanka. Adv. Water Resour., 31, 1333–1343, doi:10.1016/ j.advwatres.2008.06.004. Meng, L., and Y. J. Shen, 2014: On the relationship of soil moisture and extreme temperatures in east China. Earth Interact., 18, doi:10.1175/2013EI000551.1. ——, D. Long, S. M. Quiring, and Y. J. Shen, 2014: Statistical analysis of the relationship between spring soil moisture and summer precipitation in east China. Int. J. Climatol., 34, 1511–1523, doi:10.1002/joc.3780. Miller, D. A., and R. A. White, 1998: A conterminous United States multilayer soil characteristics data set for regional climate and hydrology modeling. Earth Interact., 2, 1–26, doi:10.1175/1087-3562(1998)002,0001:ACUSMS.2.3.CO;2. Mostovoy, G. V., and V. G. Anantharaj, 2008: Observed and simulated soil moisture variability over the lower Mississippi Delta region. J. Hydrometeor., 9, 1125–1150, doi:10.1175/ 2008JHM999.1. Reichle, R., R. D. Koster, J. Dong, and A. Berg, 2004: Global soil moisture from satellite observations, land surface models, and ground data: Implications for data assimilation. J. Hydrometeor., 5, 430–442, doi:10.1175/ 1525-7541(2004)005,0430:GSMFSO.2.0.CO;2. Reynolds, C. A., T. J. Jackson, and W. J. Rawls, 2000: Estimating soil water-holding capacities by linking the Food and Agriculture Organization Soil map of the world with global pedon databases and continuous pedotransfer functions. Water Resour. Res., 36, 3653–3662, doi:10.1029/2000WR900130. Rodell, M., and Coauthors, 2004: The Global Land Data Assimilation System. Bull. Amer. Meteor. Soc., 85, 381–394, doi:10.1175/BAMS-85-3-381. Santanello, J. A., C. D. Peters-Lidard, and S. V. Kumar, 2011: Diagnosing the sensitivity of local land–atmosphere coupling via the soil moisture–boundary layer interaction. J. Hydrometeor., 12, 766–786, doi:10.1175/JHM-D-10-05014.1. Schaake, J. C., V. I. Koren, Q. Y. Duan, K. Mitchell, and F. Chen, 1996: A simple water balance model (SWB) for estimating runoff at different spatial and temporal scales. J. Geophys. Res., 101, 7461–7475, doi:10.1029/95JD02892. Seneviratne, S. I., T. Corti, E. L. Davin, M. Hirschi, E. Jaeger, I. Lehner, B. Orlowsky, and A. J. Teuling, 2010: Investigating soil moisture–climate interactions in a changing climate: A review. Earth-Sci. Rev., 99, 125–161, doi:10.1016/j.earscirev.2010.02.004. Seuffert, G., P. Gross, C. Simmer, and E. Wood, 2002: The influence of hydrologic modelling on the predicted local weather: Twoway coupling of a mesoscale weather prediction model and a
1355
land surface hydrologic model. J. Hydrometeor., 3, 505–523, doi:10.1175/1525-7541(2002)003,0505:TIOHMO.2.0.CO;2. Skamarock, W. C., and Coauthors., 2008: A description of the Advanced Research WRF version 3. NCAR Tech. Note NCAR/TN-4751STR, 113 pp., doi:10.5065/D68S4MVH. Sörensson, A. A., and E. H. Berbery, 2015: A note on soil moisture memory and interactions with surface climate for different vegetation types in the La Plata basin. J. Hydrometeor., 16, 716–729, doi:10.1175/JHM-D-14-0102.1. Trier, S. B., F. Chen, K. W. Manning, M. A. LeMone, and C. A. Davis, 2008: Sensitivity of the PBL and precipitation in 12-day simulations of warm-season convection using different land surface models and soil wetness conditions. Mon. Wea. Rev., 136, 2321–2343, doi:10.1175/2007MWR2289.1. ——, M. A. LeMone, F. Chen, and K. W. Manning, 2011: Effects of surface heat and moisture exchange on ARW-WRF warm-season precipitation forecasts over the central United States. Wea. Forecasting, 26, 3–25, doi:10.1175/ 2010WAF2222426.1. Verdin, K. L., and S. K. Greenlee, 1996: Development of continental scale digital elevation models and extraction of hydrographic features. Proc. Third Int. Conf./Workshop on Integrating GIS and Environmental Modeling, Santa Fe, NM, National Center for Geographic Information and Analysis, CD-ROM, 8.2. Vivoni, E. R., K. Tai, and D. J. Gohis, 2009: Effects of the initial soil moisture on rainfall generation and subsequent hydrologic response during the North American monsoon. J. Hydrometeor., 10, 644–664, doi:10.1175/ 2008JHM1069.1. Warrach-Sagi, K., V. Wulfmeyer, R. Grasselt, F. Ament, and C. Simmer, 2008: Streamflow simulations reveal the impact of the soil parameterization. Meteor. Z., 17, 751–762, doi:10.1127/ 0941-2948/2008/0343. Yang, S., S.-H. Yoo, R. Yang, K. E. Mitchell, H. van den Dool, and R. W. Higgins, 2007: Response of seasonal simulations of a regional climate model to high-frequency variability of soil moisture during the summers of 1988 and 1993. J. Hydrometeor., 8, 738–757, doi:10.1175/JHM616.1. Yang, Y., M. Uddstrom, M. Revell, P. Andrews, H. Oliver, R. Turner, and T. Carey-Smith, 2011: Numerical simulations of effects of soil moisture and modification by mountains over New Zealand in summer. Mon. Wea. Rev., 139, 494–510, doi:10.1175/2010MWR3324.1. Zaitchik, B. F., J. A. Santanello, S. V. Kumar, and C. D. PetersLidard, 2013: Representation of soil moisture feedbacks during drought in NASA Unified WRF (NU-WRF). J. Hydrometeor., 14, 360–367, doi:10.1175/JHM-D-12-069.1. Zhang, C., Y. Wang, A. Lauer, and K. Hamilton, 2012: Configuration and evaluation of the WRF Model for the study of Hawaiian regional climate. Mon. Wea. Rev., 140, 3259–3277, doi:10.1175/MWR-D-11-00260.1. Zhang, J., L. Wu, and W. Dong, 2011: Land–atmosphere coupling and summer climate variability over East Asia. J. Geophys. Res., 116, D05117, doi:10.1029/2010JD014714.